Visual Interactions with Analytics

a technology of visual interaction and analytics, applied in the field of visual interaction with analytics, can solve the problems of limiting the amount of user (other than the actual author of the model) that can manipulate the model, and the limitations of the application itsel

Inactive Publication Date: 2009-12-31
MICROSOFT TECH LICENSING LLC
View PDF102 Cites 48 Cited by
  • Summary
  • Abstract
  • Description
  • Claims
  • Application Information

AI Technical Summary

Problems solved by technology

However, any given application does have limits on the type of information that can be visually conveyed, how that information is visually conveyed, or the scope of data and behavior that can be attributed to the various visual representations.
Also, there are limits to how much a user (other than the actual author of the model) can manipulate the model to test various scenarios.

Method used


Image

  • Visual Interactions with Analytics
  • Visual Interactions with Analytics
  • Visual Interactions with Analytics

Examples


example # 1

Additional Example #1

Retailer Shelf Arrangements

[0121]Product salespersons often use 3-D visualizations to sell retailers on shelf arrangements, end displays and new promotions. With the pipeline 201, the salesperson will be able to do what-ifs on the spot. Given some product placements and given a minimum daily sales / linear foot threshold, the salesperson may calculate and visualize the minimum required stock at hand. Conversely, given some stock at hand and given a bi-weekly replenishment cycle, the salesperson might calculate product placements that will give the desired sales / linear foot. The retailer will be able to visualize the impact, compare scenarios, and compare profits. FIG. 12 illustrates an example retailer shelf arrangement visualization. The input data might include visual images of the product, a number of the product, a linear square footage allocated for each product, and shelf number for each product, and so forth.

example # 2

Additional Example #2

Urban Planning

[0122]Urban planning mash ups are becoming prominent. Using the principles described herein, analytics can get integrated into such solutions. A city planner will open a traffic model created by experts, and drag a bridge in from a gallery of road improvements. The bridge will bring with it analytical behavior like length constraints and high-wind operating limits. Via appropriate visualizations, the planner will see and compare the effect on traffic of different bridge types and placements. The principles described herein may be applied to any map scenarios where the map might be for a wide variety of purposes. The map might be for understanding the features of a terrain and finding directions to some location. The map might also be a visual backdrop for comparing regionalized data. More recently, maps are being used to create virtual worlds in which buildings, interiors and arbitrary 2-D or 3-D objects can be overlaid or positioned in the map. FI...

example # 3

Additional Example #3

Visual Education

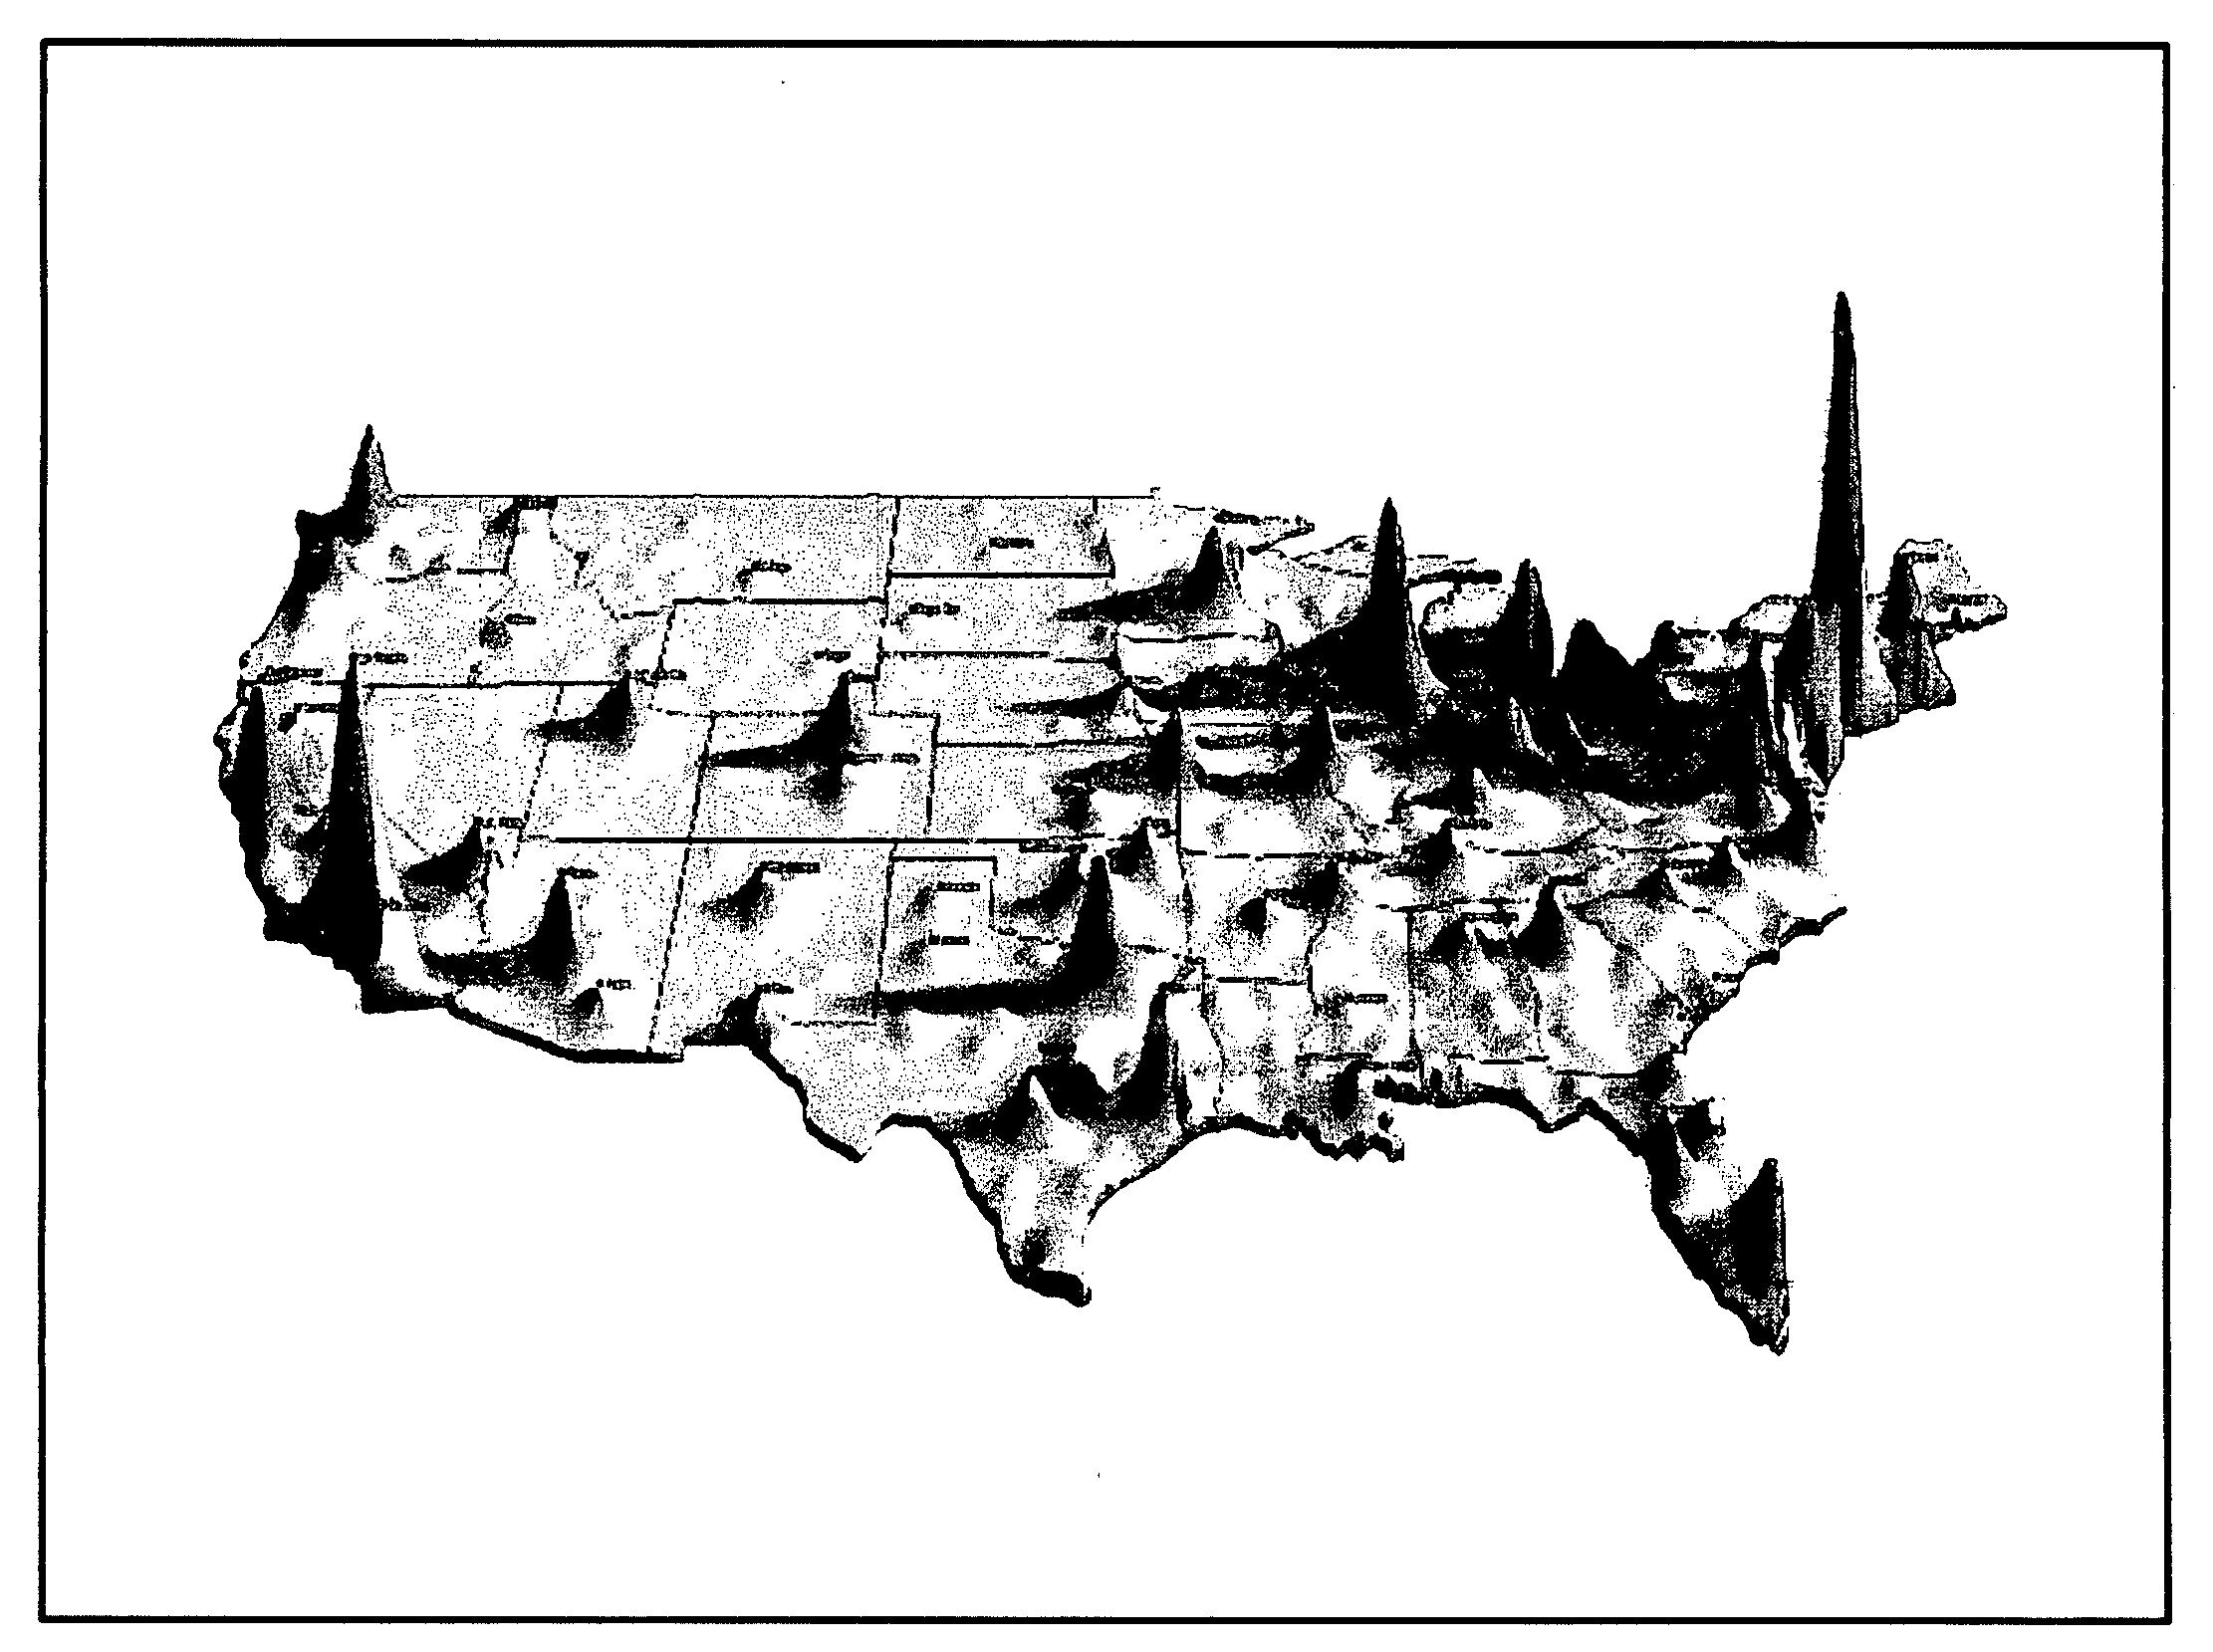
[0123]In domains like science, medicine, and demographics where complex data needs to be understood not just by domain practitioners but also the public, authors can used the principles described herein to create data visualizations that intrigue and engage the mass audience. They will use domain-specific metaphors, and impart the authors' sense of style. FIG. 14 is an illustration about children's education. FIG. 15 is a conventional illustration about population density. Conventionally, such visualizations are just static illustrations. With the principles described herein, these can become live, interactive experiences. For instance, by inputting a geographically distributed growth pattern as input data, a user might see the population peaks change. Some visualizations, where the authored model supports this, will let users do what-ifs. That is, the author may change some values and see the effect on that change on other values.

[0124]According...


PUM


Abstract

Visual interaction with an analytics-driven model view composition application. The application includes a data-model binding component that binds input data to model parameters, an analytics solver component that solves for remaining unknown model parameters, and a view composition component that generates a view composition using the model parameters. In one visual interaction, various solutions of the model are provided in alternative views of various view compositions in a single integrated composition. In another interaction, regardless of whether there are multiple view compositions illustrated in a single integrated view, there might be visual prompts in the view composition that suggest an adjustment to make that might move the value of a particular model parameter in a desired direction.

Description

BACKGROUND[0001]Often, the most effective way to convey information to a human being is visually. Accordingly, millions of people work with a wide range of visual items in order to convey or receive information, and in order to collaborate. Such visual items might include, for example, concept sketches, engineering drawings, explosions of bills of materials, three-dimensional models depicting various structures such as buildings or molecular structures, training materials, illustrated installation instructions, planning diagrams, and so on.[0002]More recently, these visual items are constructed electronically using, for example, Computer Aided Design (CAD) and solid modeling applications. Often these applications allow authors to attach data and constraints to the geometry. For instance, the application for constructing a bill of materials might allow for attributes such as part number and supplier to be associated with each part, the maximum angle between two components, or the lik...

Claims


Application Information

Patent Timeline
Patent Type & Authority Applications(United States)
IPC IPC(8): G06T15/00
CPCG06T11/206
Inventor RUBIN, DARRYL E.MITAL, VIJAYBAPAT, VIKRAMPEREZ, MEGHAN R.CLARKE, STEVEN JOHN
Owner MICROSOFT TECH LICENSING LLC
Why Eureka
Try Eureka