Method and system for generating and displaying an interactive dynamic view of bi-directional impact analysis results for multiply connected objects

a dynamic view and multi-directional impact technology, applied in the field of graphical display of data, can solve the problems of analyzing and understanding the nature and state of data units, user inability to retain a view of all data at once, and difficulty in appreciating and analyzing

Inactive Publication Date: 2010-04-01
IBM CORP
View PDF38 Cites 56 Cited by
  • Summary
  • Abstract
  • Description
  • Claims
  • Application Information

AI Technical Summary

Problems solved by technology

Analyzing and understanding the nature and state of units of data, and appreciating any subtle relationships and connections therebetween, can be difficult and time consuming.
For example, in a screen display, large sets of textual data cannot fit on a single display without the user having to scroll or page, whereby a user cannot retain a view of all the data at once.
Generating and presenting a list of affected objects in tabular form does provide useful information but it can be difficult to interpret.
However, given a graph drawing algorithm that produces a hierarchical arrangement of graph nodes, and given impact analysis results for both outbound and inbound relationships, such conventional graph drawing algorithms cannot merge the two hierarchies of data into a common graph layout where there is a single root object.

Method used


Image

  • Method and system for generating and displaying an interactive dynamic view of bi-directional impact analysis results for multiply connected objects
  • Method and system for generating and displaying an interactive dynamic view of bi-directional impact analysis results for multiply connected objects
  • Method and system for generating and displaying an interactive dynamic view of bi-directional impact analysis results for multiply connected objects

Examples


Embodiment Construction

[0022]The following description is made for the purpose of illustrating the general principles of the invention and is not meant to limit the inventive concepts claimed herein. Further, particular features described herein can be used in combination with other described features in each of the various possible combinations and permutations. Unless otherwise specifically defined herein, all terms are to be given their broadest possible interpretation including meanings implied from the specification as well as meanings understood by those skilled in the art and / or as defined in dictionaries, treatises, etc.

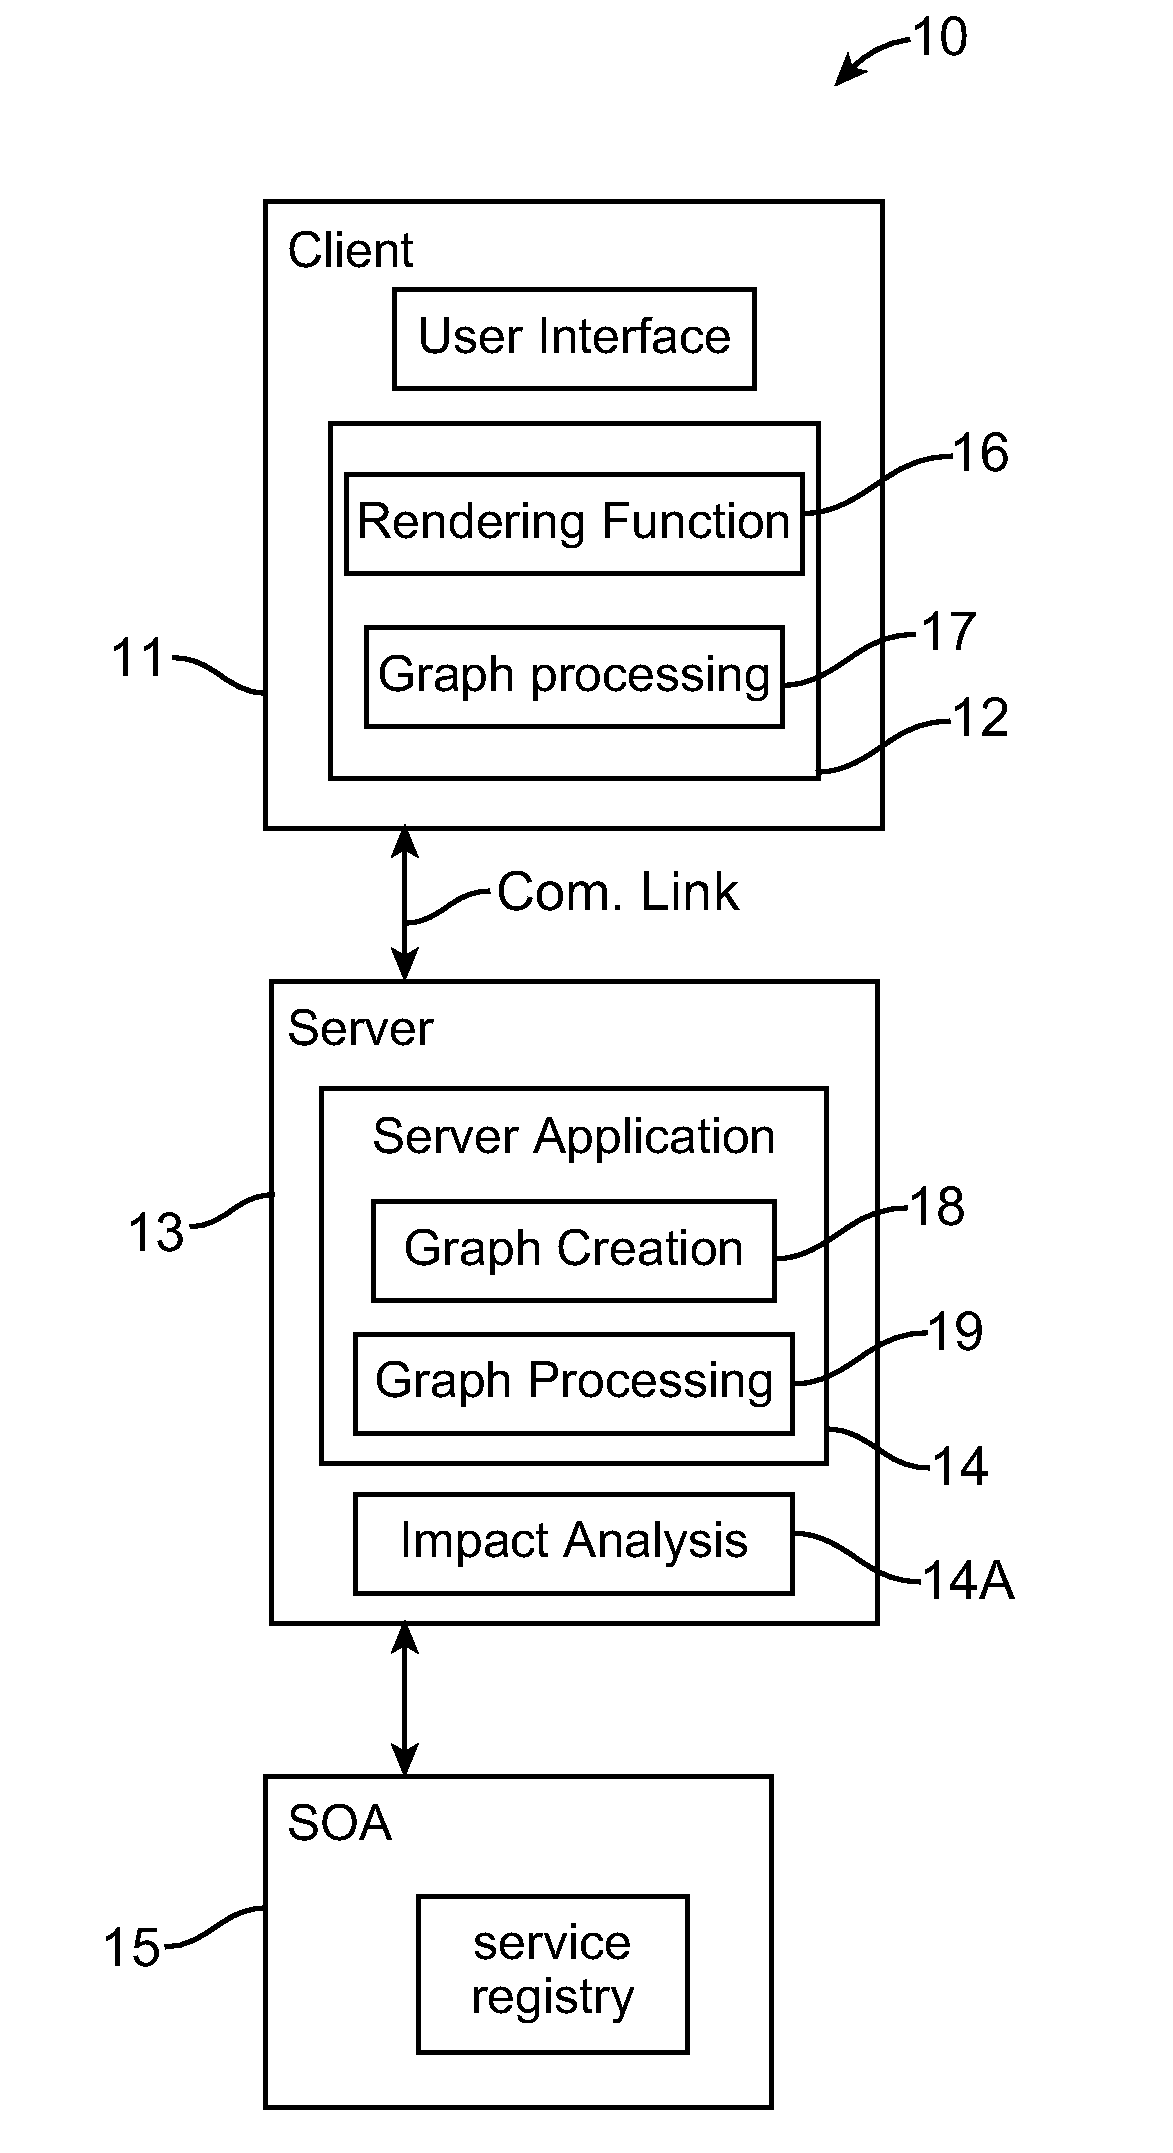
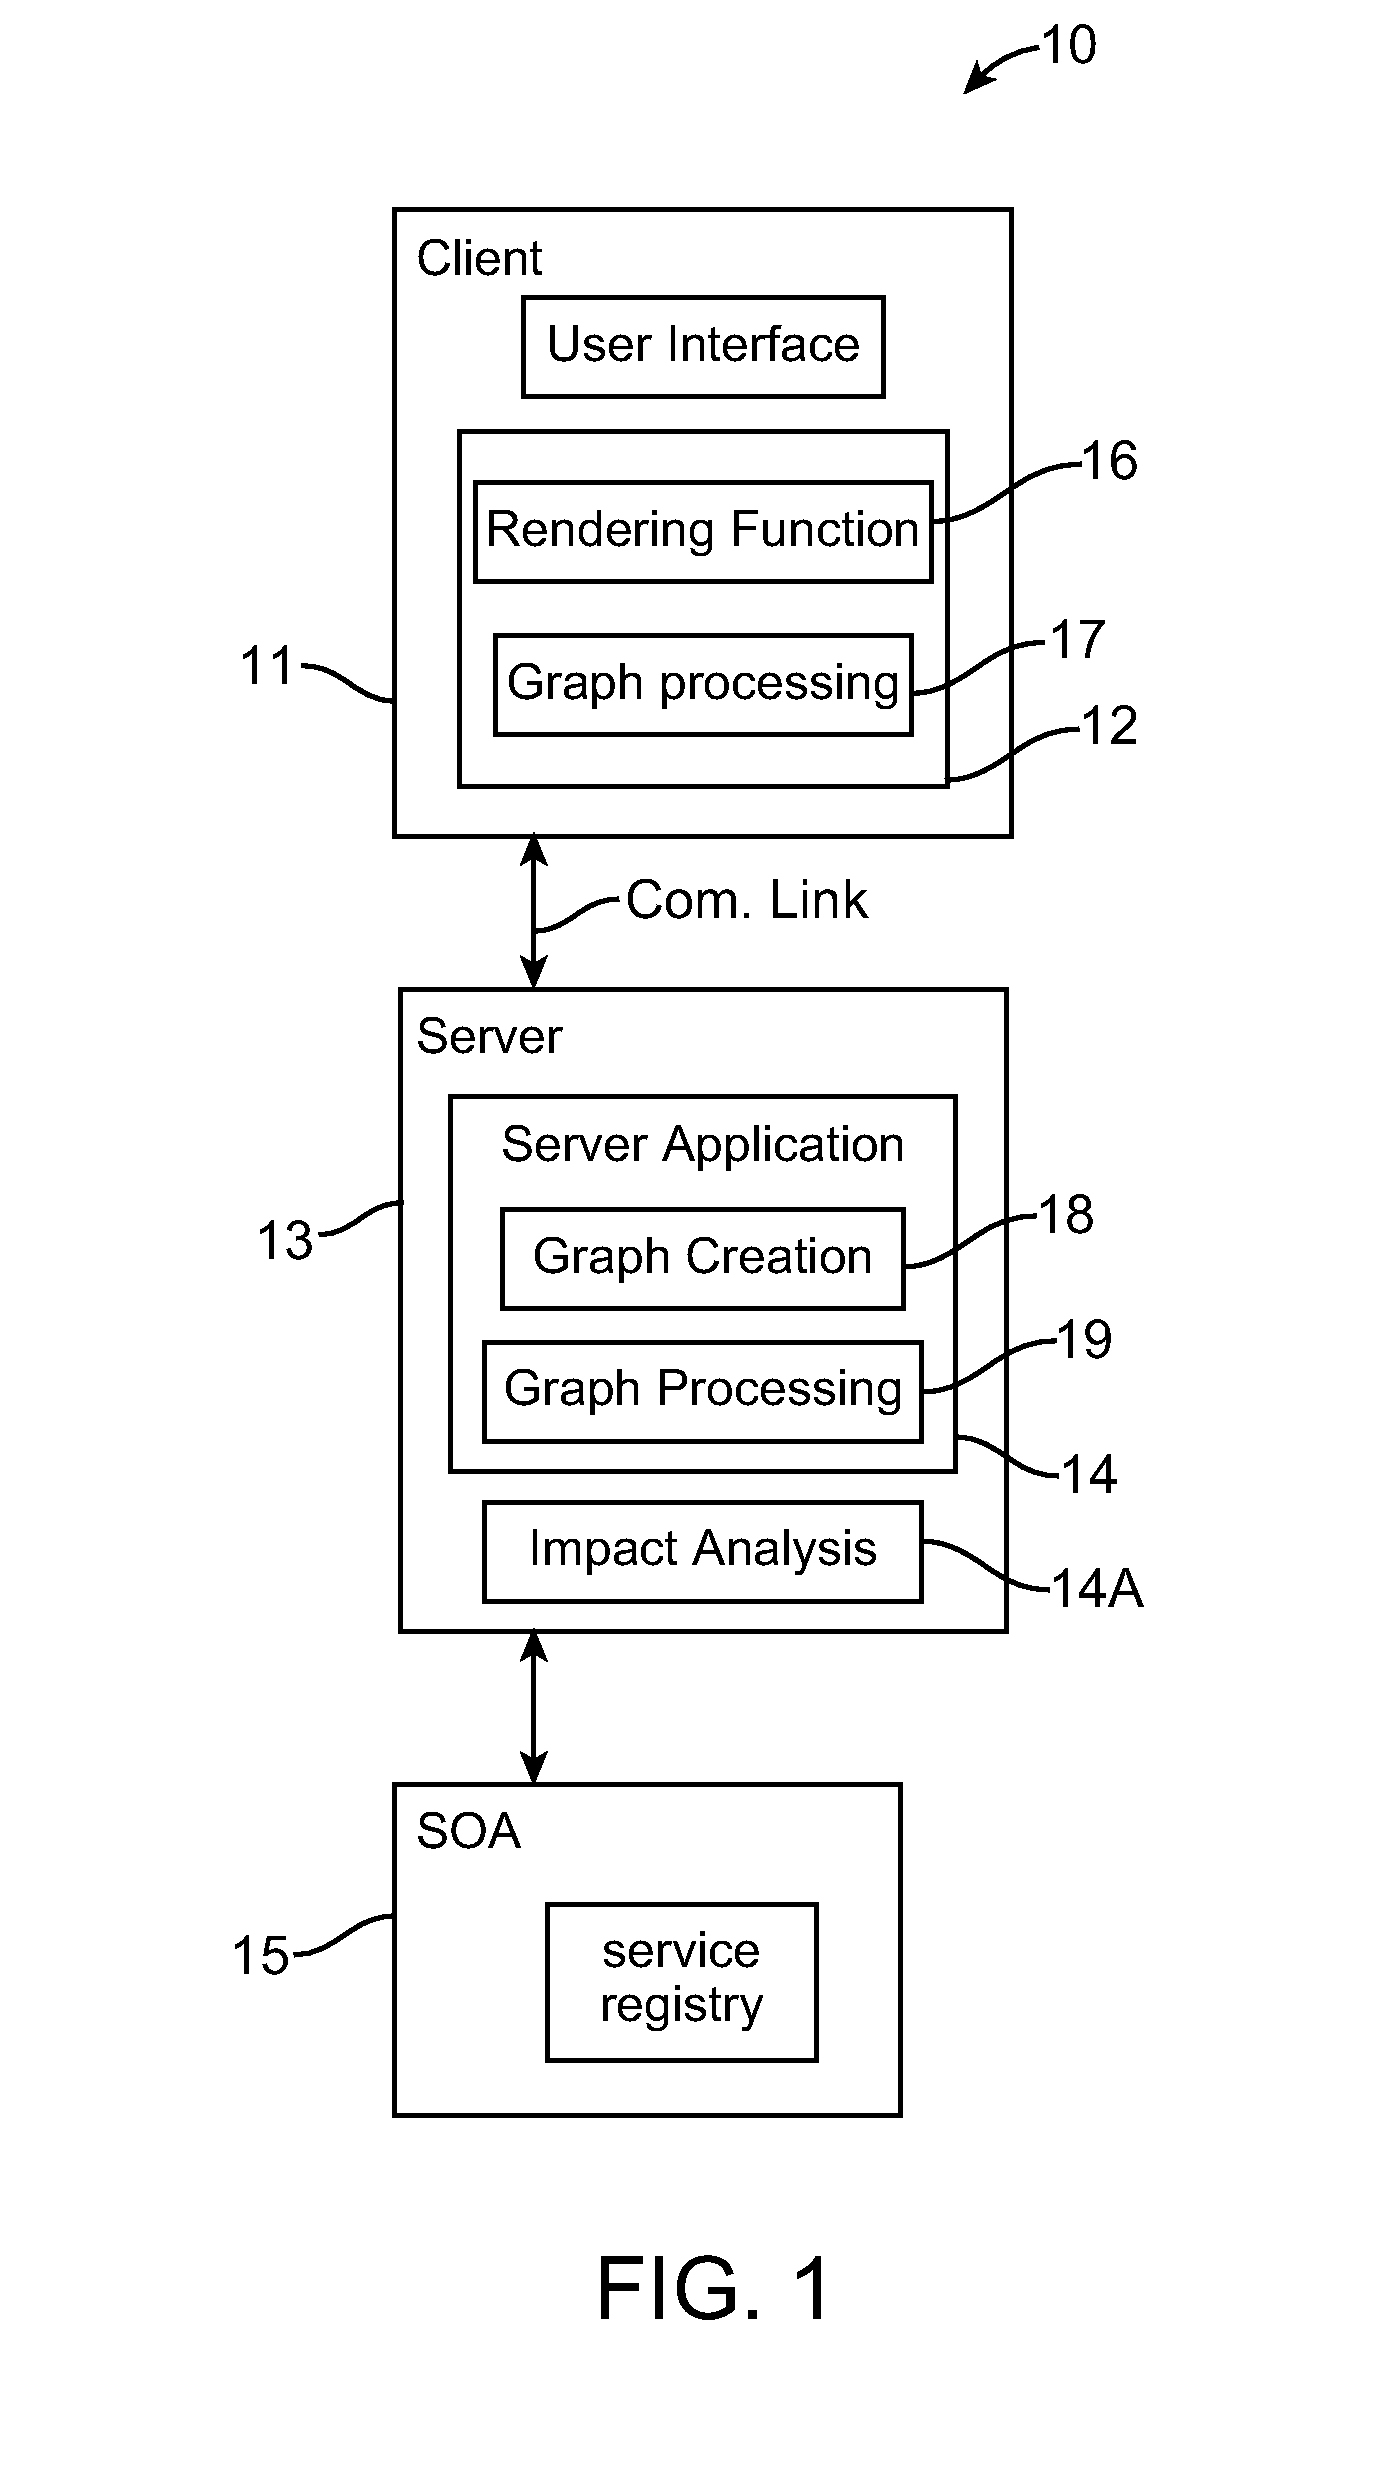
[0023]The invention provides a method and system for generating and displaying an interactive dynamic graph view of multiply connected objects. One embodiment includes generating and displaying an interactive dynamic view of bi-directional impact analysis results for multiply connected objects. Preferably, the bi-directional impact analysis results are presented in a graph view usi...


PUM


Abstract

A method and system for generating a graph view on a user interface in a computing environment, is provided. One implementation involves, at a server, generating graph coordinate data for a dependency graph view of bi-directional impact analysis results for multiply connected objects in a data source; transmitting the graph coordinate data to a client as lightweight object data; and at the client, based on the lightweight object data rendering an interactive dynamic dependency graph view on a user interface.

Description

BACKGROUND OF THE INVENTION[0001]1. Field of the Invention[0002]The invention relates generally to graphical display of data, and in particular, to displaying a graph view of multiply connected objects.[0003]2. Background Information[0004]Visualization of and interaction with data helps users quickly understand the types of data available and their interrelationships. Often, sets of data are presented as lists, or tables with columns, depicting specific attributes of each instance of data. Analyzing and understanding the nature and state of units of data, and appreciating any subtle relationships and connections therebetween, can be difficult and time consuming. For example, in a screen display, large sets of textual data cannot fit on a single display without the user having to scroll or page, whereby a user cannot retain a view of all the data at once.[0005]A conventional solution is to draw a graph of objects with lines indicating relationships between pairs of objects, and some ...

Claims


Application Information

Patent Timeline
Patent Type & Authority Applications(United States)
IPC IPC(8): G06T11/20
CPCG06T11/206
Inventor BREEDS, ROBERT J.TAUNTON, PHILIP R.
Owner IBM CORP
Why Eureka
Try Eureka