

Method and computer program product for plotting distribution area of data points in scatter diagram
a technology of data points and distribution areas, applied in the field of plotting the distribution area of data points in the scatter diagram, can solve the problems of difficult to perceive the feature of the distribution in each layer, difficult to perceive the distribution feature in each layer, and the typical probability ellipse does not accurately represent the actual distribution of data
- Summary
- Abstract
- Description
- Claims
- Application Information
AI Technical Summary
Benefits of technology
Problems solved by technology
Method used
Image

Examples
Embodiment Construction
[0066]A description is given below, with reference to FIGS. 1 through 42 of embodiments of the present invention.
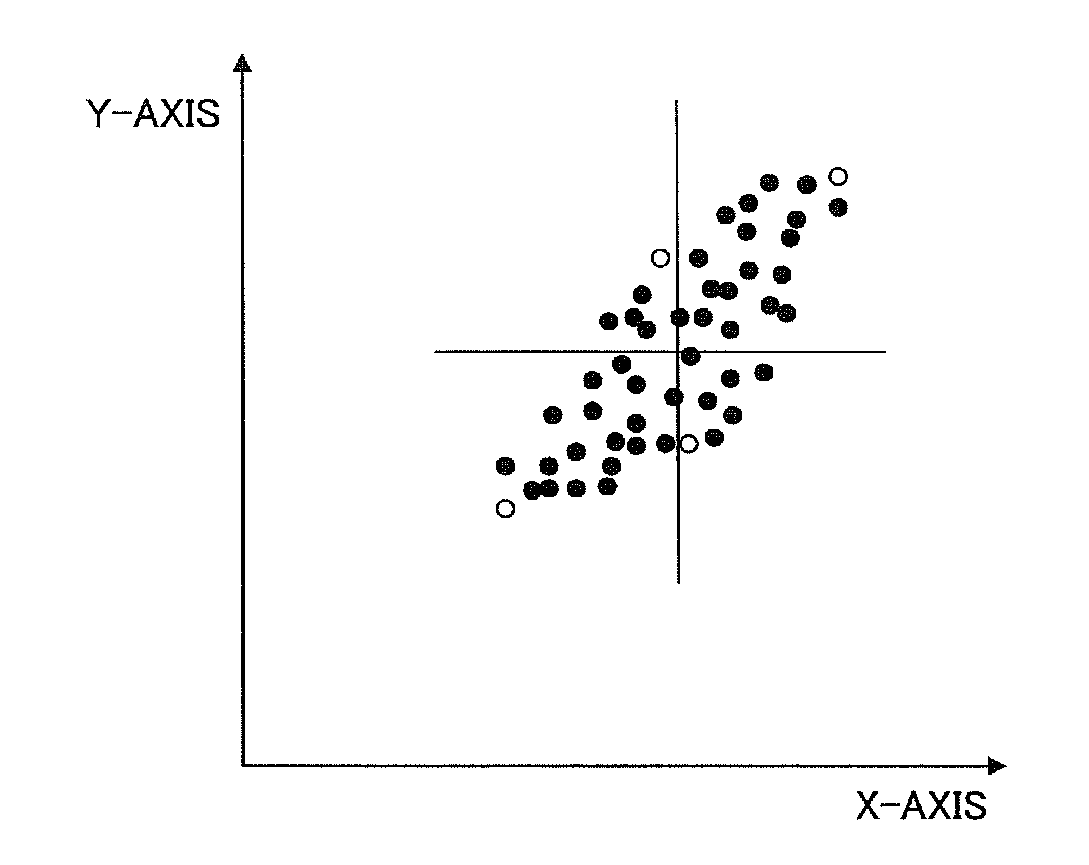
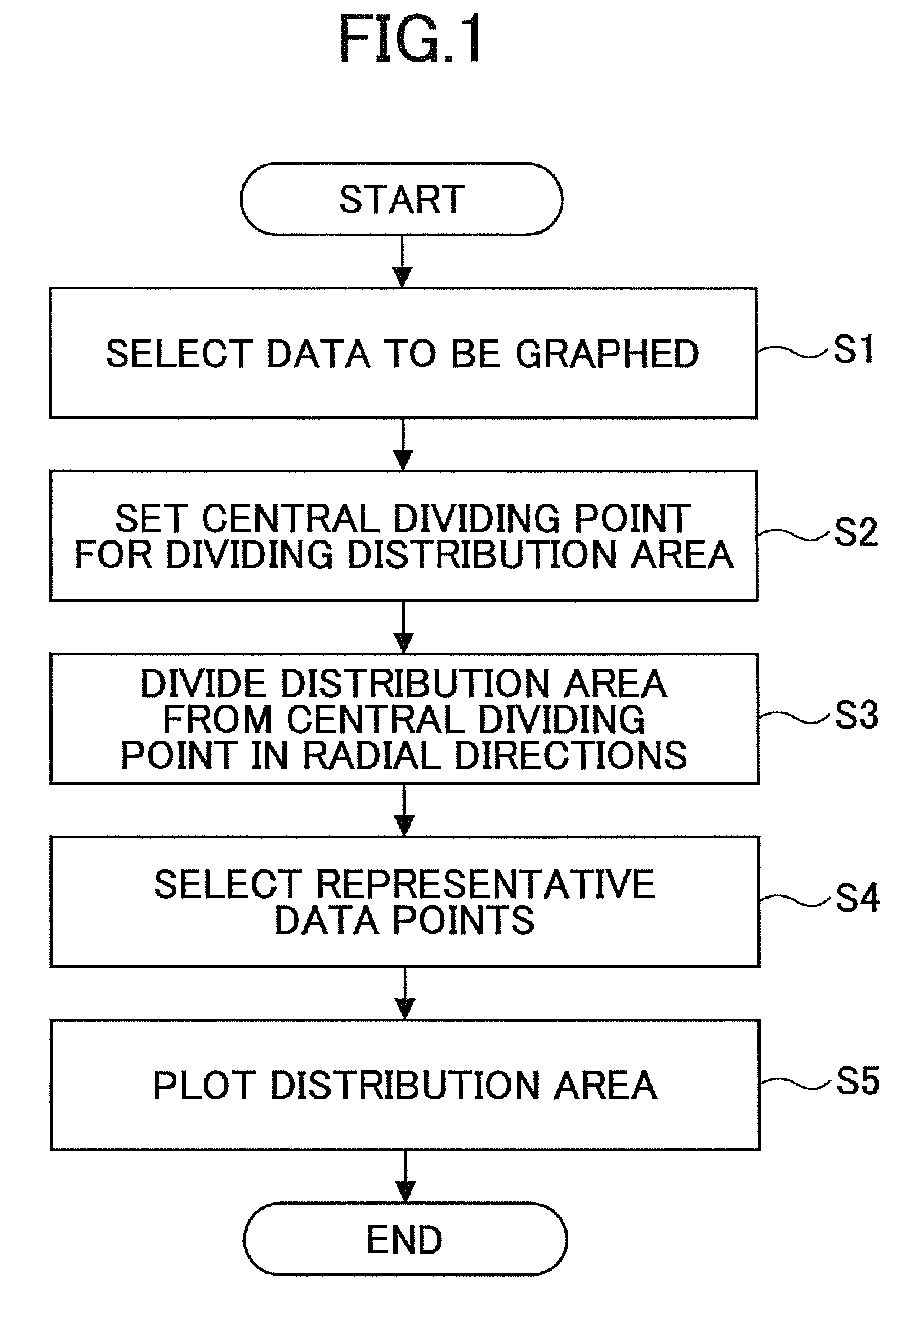
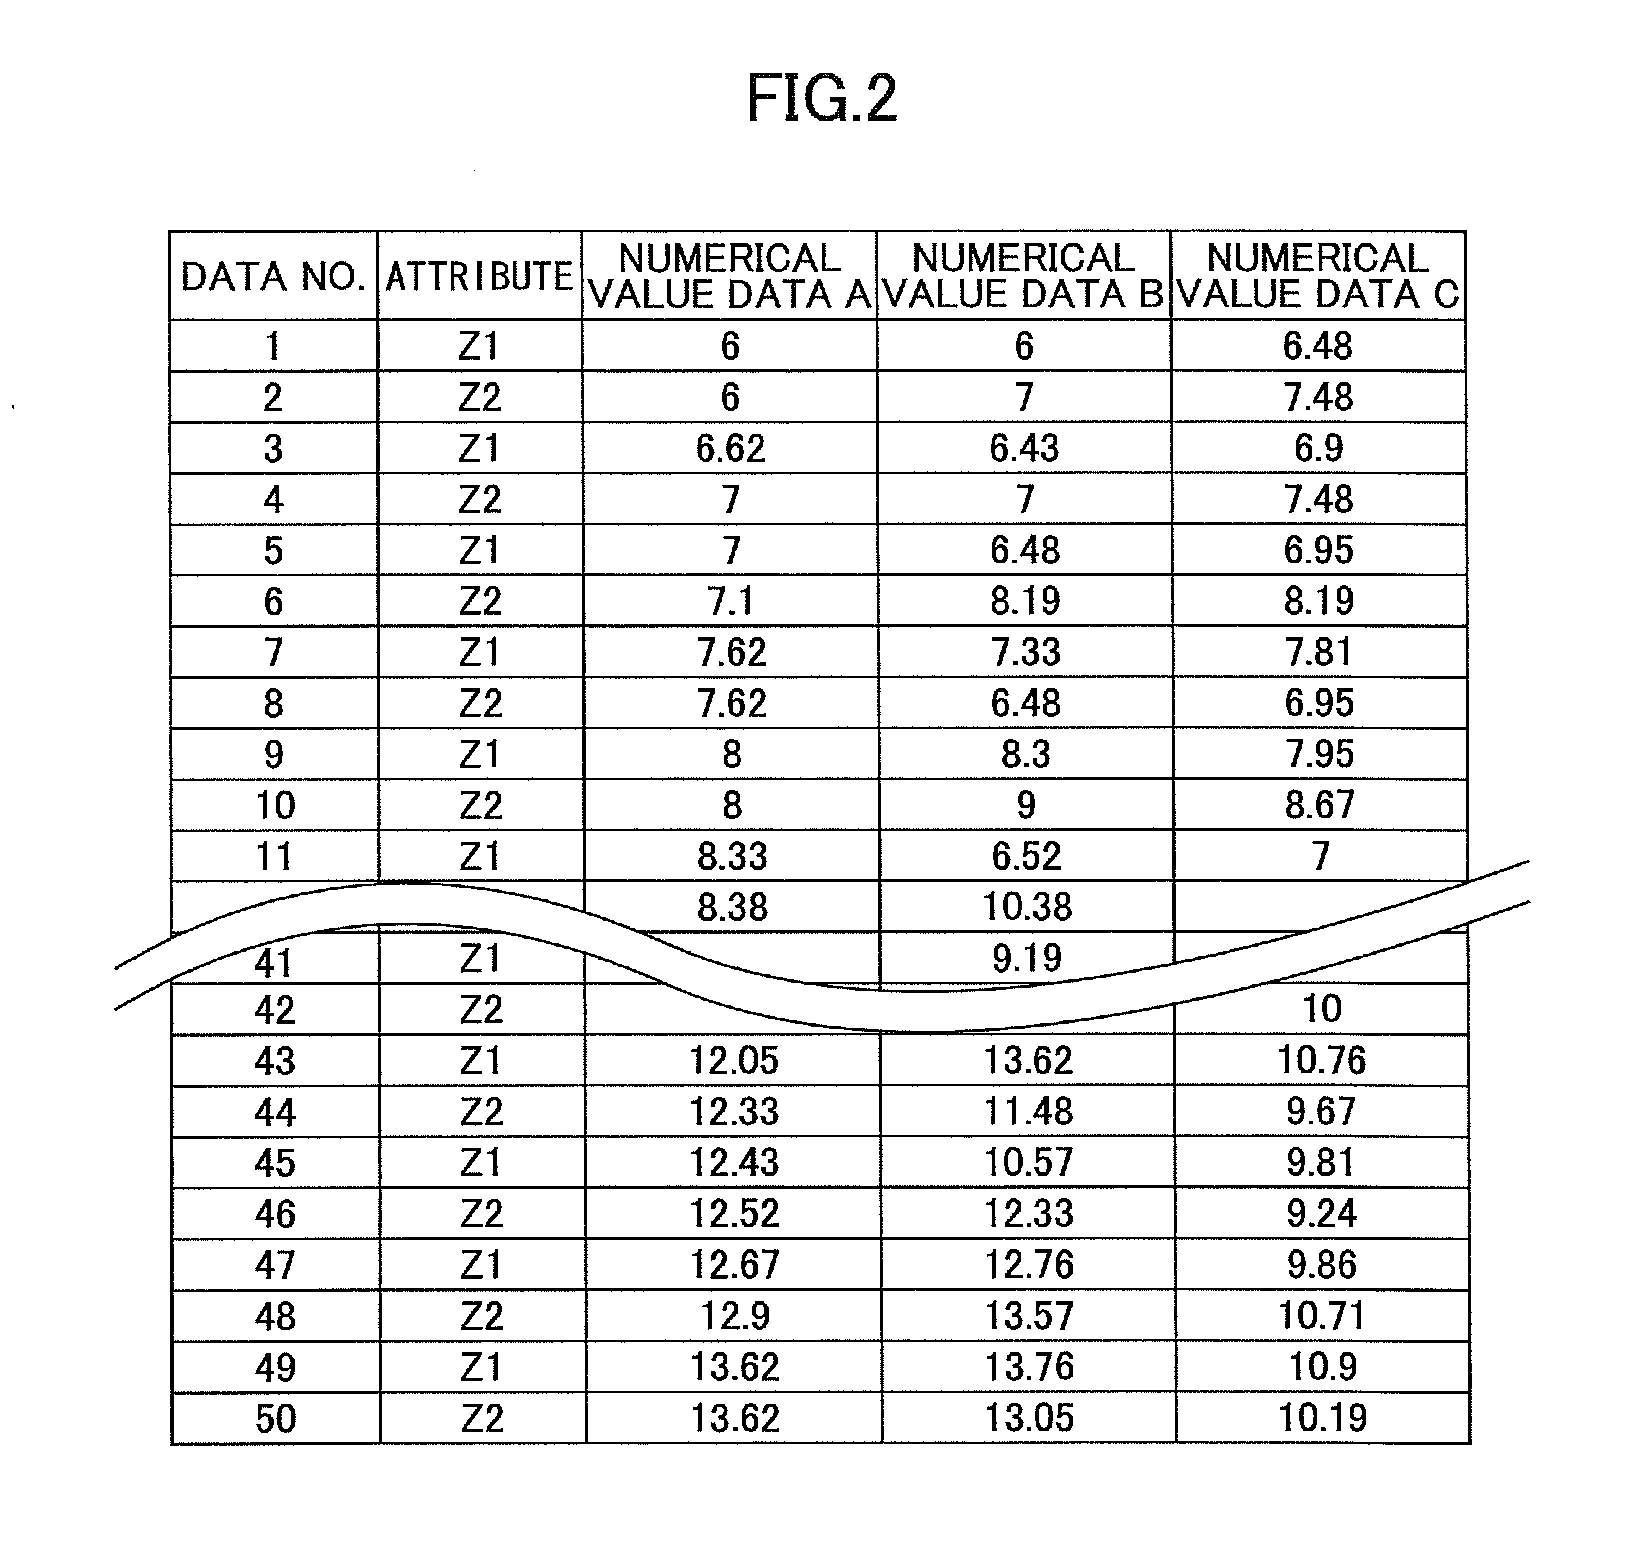
[0067]FIG. 1 is a flow chart illustrating an embodiment of the invention, FIG. 2 is a data table partially illustrating data used in the embodiment of the invention, and FIG. 3 is a scatter diagram that represents data shown by the data table in FIG. 2 in dots, in which lines to divide a distribution area of the data represented by dots into four are drawn in this embodiment. FIG. 4 is a scatter diagram that represents data shown by the data table in FIG. 2 in dots, in which lines to divide a distribution area of the data represented by dots into four and a line to indicate the distribution area are drawn in the embodiment. First, the embodiment of the invention is described with reference to FIGS. 1 to 4.
[0068]Step 1: Select two related numerical value data to be graphed. In the embodiment, the two numerical value data are denoted by respective numerical value data A and...
PUM
 Abstract
Description
Claims
Application Information