Method of generating attribute cardinality maps

a cardinality map and attribute technology, applied in the field of estimation, can solve the problems of preventing the practical application of these methods, substantial errors, and computational costs in determining the histogram and/or statistical information relating to estimation accuracy

Inactive Publication Date: 2005-03-08
OOMMEN BASANTKUMAR JOHN +1
View PDF10 Cites 300 Cited by
  • Summary
  • Abstract
  • Description
  • Claims
  • Application Information

AI Technical Summary

Problems solved by technology

It is evident, then, that for each estimated value, substantial error exists.
Accordingly, computational costs in determining the histogram and / or statistical information relating to estimation accuracy are substantial.
This has prevented practical application of these methods.

Method used


Image

  • Method of generating attribute cardinality maps
  • Method of generating attribute cardinality maps
  • Method of generating attribute cardinality maps

Examples


example 1

FIG. 11 shows the histogram and the R-ACM of the Age attribute of a relation Emp(SIN, Age, Salary) between Age=30 and Age=49. Note that the actual frequency for every age value is shown in the histogram as shaded rectangles. Whenever the frequency of the current age differs from the frequency of the running mean value for age in the sector by more than the allowed tolerance value τ=8, a new partition is formed. From the ACM, the number of tuples in this relation with ages in the range of 34≦Age≦36 is 130 and the estimate for the number of employees having age=48 is 15 / 3=5.

Pseudocode to implement the above method is as follows.

Method 2 Generate_R-ACM

Input: tolerance τ, frequency distrib. of X as A[0 . . . L−1]Output: R-ACMbeginInitialize_ACM; / * set all entries in ACM to zero * / current_mean:=A[1]; j:=0;ACM[j]:=A[1];for i:=1 to L−1 do / * for every attribute value * / if abs (A[i]−current mean)<τACM[j]:=ACM[j]+A[i]; / * compute the running mean * / current_mean:=(current_mean*i+A[i]) / (i...

example 2

Consider an R-ACM sector of width 10 containing 124 tuples, where the R-ACM is partitioned using a tolerance value τ=3. Let us attempt to find the estimated frequency ranges for the attribute values (a) X3 and (b) X6.

(a). The frequency range of X3 is, 12.4-3⁢(ln⁢ ⁢5-1)≤x3≤12.4+3⁢(ln⁢ ⁢5-1)10.57≤x3≤14.23

(b). The frequency range of X6 is, 12.4-3⁢(ln⁢ ⁢2-1)≤x6≤12.4+3⁢(ln⁢ ⁢2-1)11.48≤x6≤13.32

Notice that in both the above cases, the possible frequency values from an equi-width or equi-depth histograms are 0≦x≦124, where x=x3 or x6. The power of the R-ACM in the estimation is clearly advantageous.

5.1.9 Worst-Case Error in Estimating the Frequency of an Arbitrary Value Xi

The previous theorem gives an estimate of the number of occurrences of an arbitrary attribute value by considering the worst-case R-ACM sector. So the worst-case error in the above estimate is given by the frequency range that the attribute value can assume. The following theorem provides a worst-case error for this frequ...

example 3

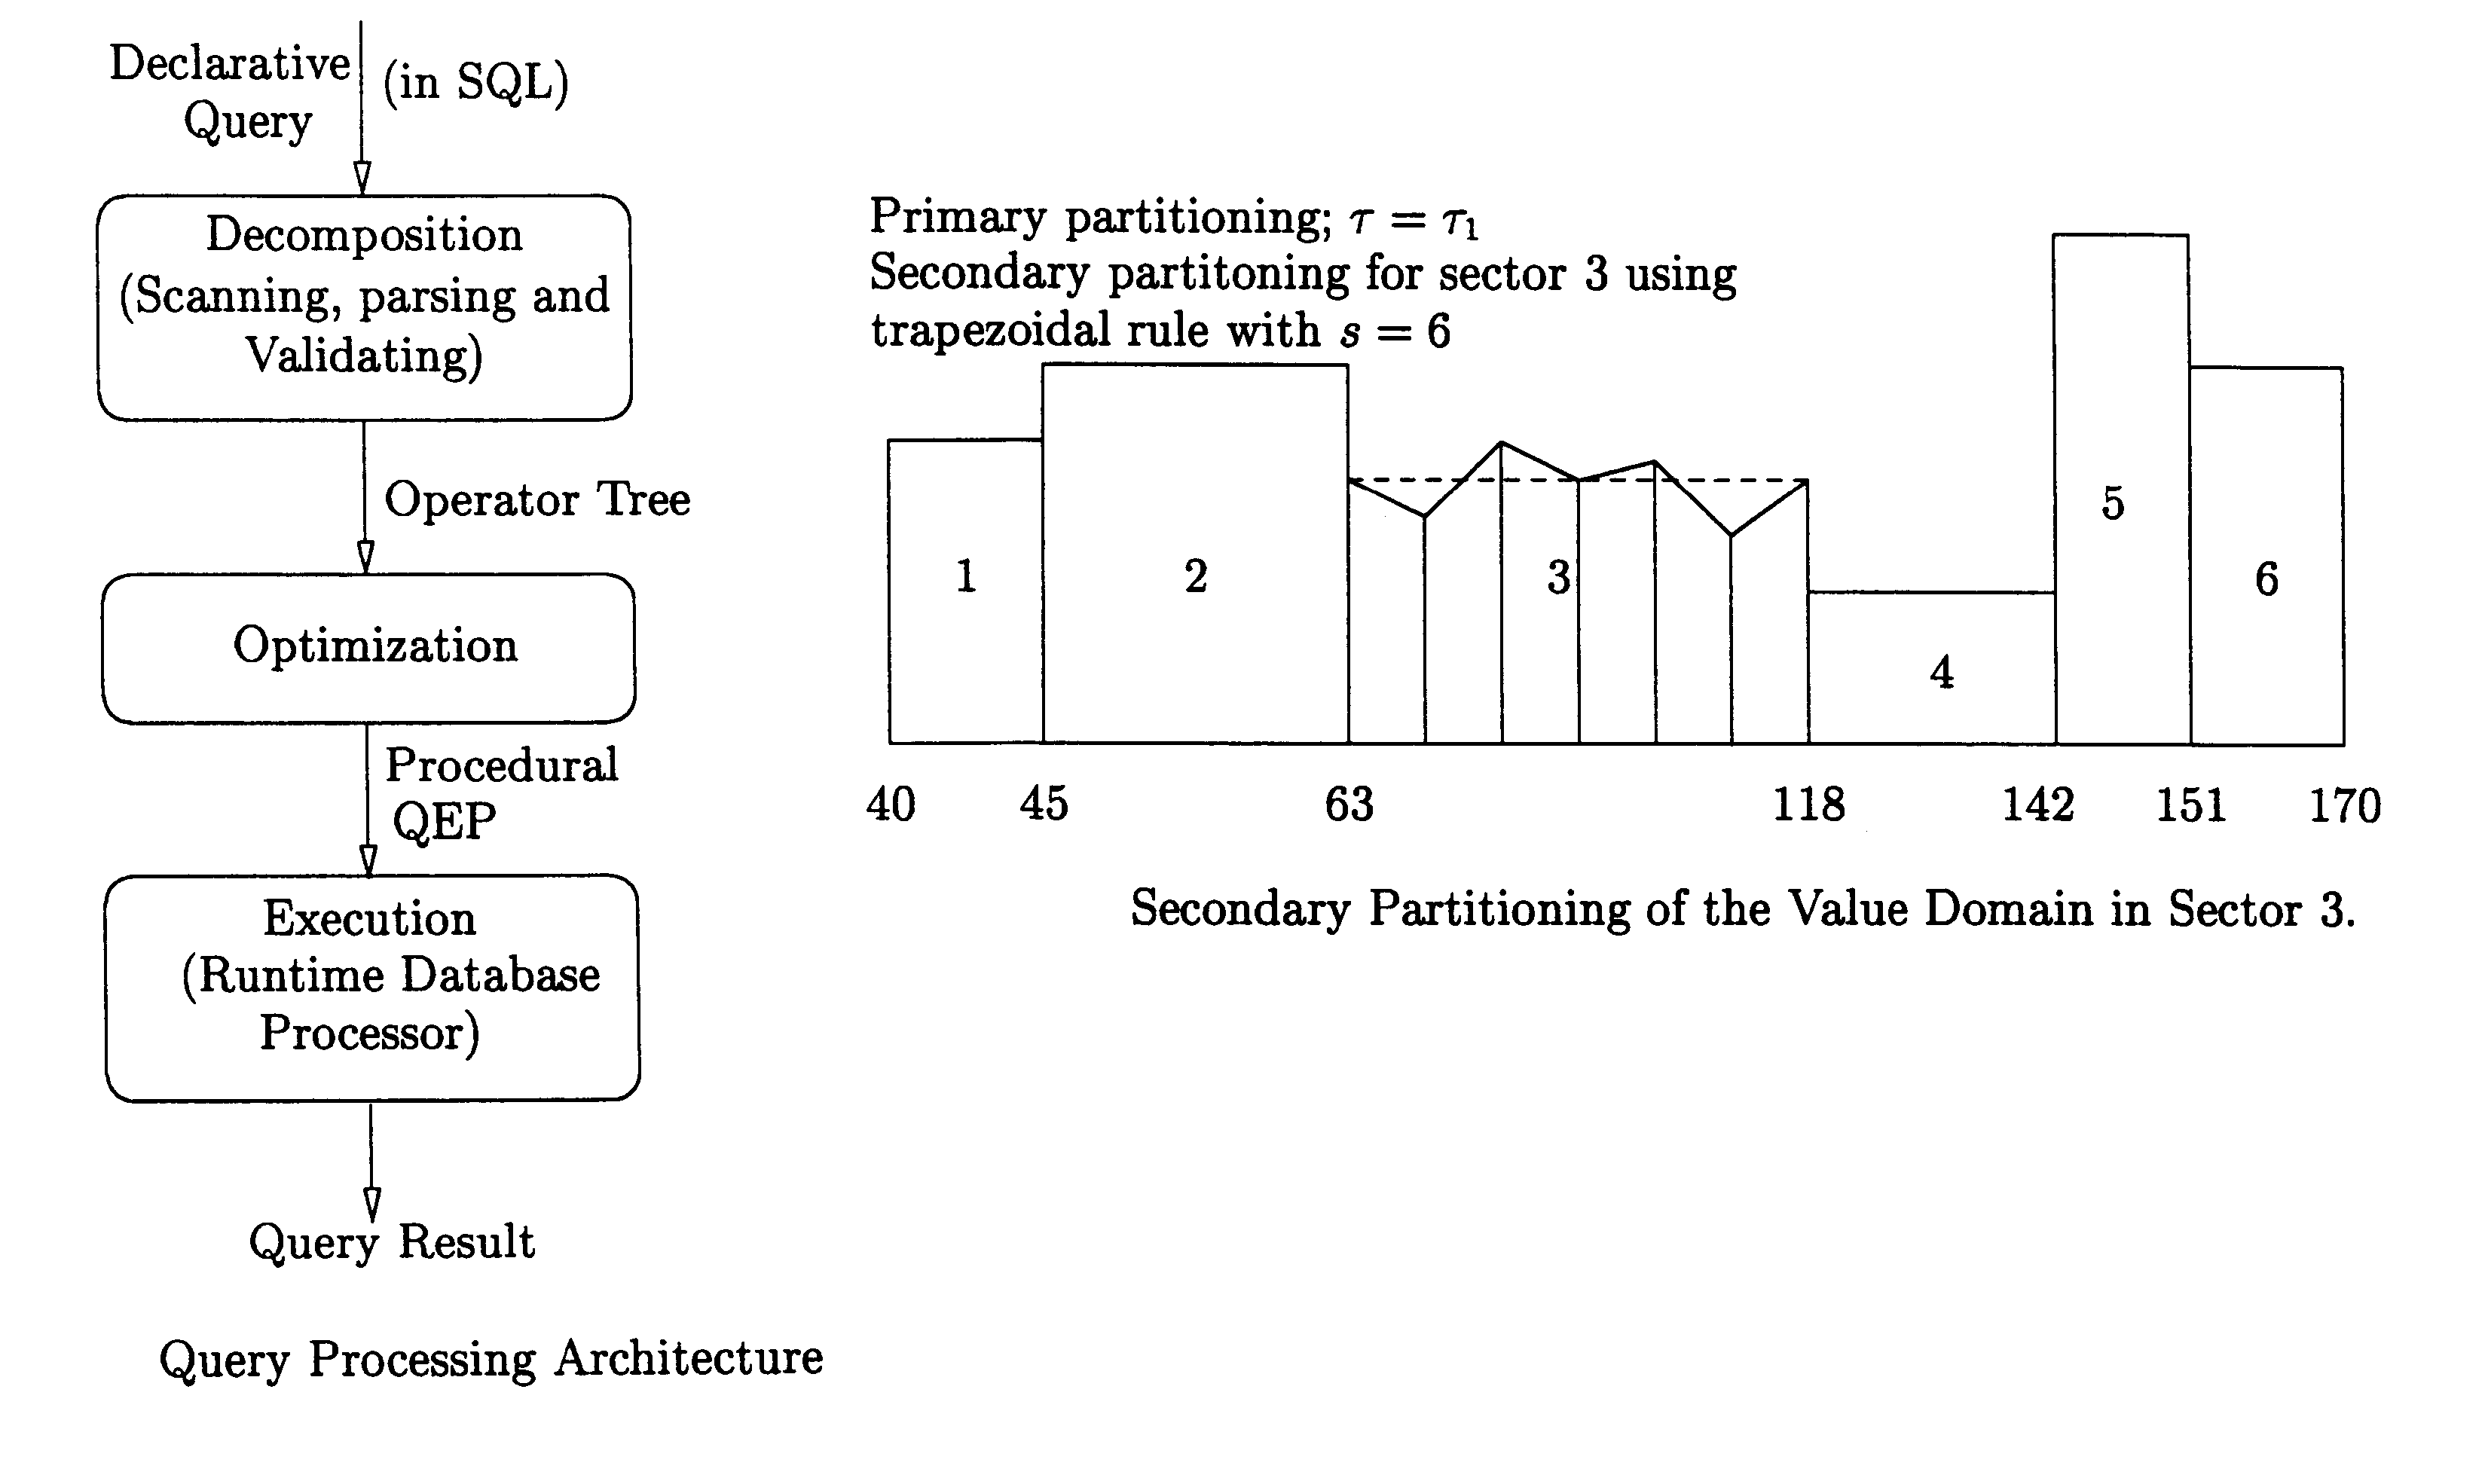
FIG. 26 shows the equi-width histogram and the trapezoidal ACM of the Age attribute of a relation Emp(SIN, Age, Salary) between Age=30 and Age=49. Note that the actual frequency for every age value is shown in the histogram as shaded rectangles. The starting and ending frequencies of each trapezoidal sector is chosen so that the area under the trapezoid is equivalent to the area of the corresponding rectangular sector of the histogram. From the trapezoidal ACM, the number of tuples in the relation with ages in the range of 35≦Age<40 is 283 and the estimate for the number of employees having Age=48 is 6. Compare this with the rectangular ACM in Example 1.

Finding the result size of a selection query on a range-predicate is a discrete case of finding the area under a curve. Thus any numerical integration technique used to find the area under a curve will fit our purpose well. More accurate and sophisticated methods such as Simpson's Rule exist which may also be used. The trapezoid...


PUM


Abstract

This invention provides a novel means for creating a histogram for use in minimizing response time and resource consumption when optimizing a query in a database, and other like structures, the histogram being created by placing ordered elements into specific range until the next element to be considered for inclusion in the range is a predetermined distance from the (generalized) mean value associated with the elements within the range, whereupon that next element is placed in the following range. Similarly, the following ranges are closed when the next element to be considered for inclusion in the range is greater than a predetermined distance from the (generalized) mean value associated with the elements in that range, whereupon that next element is placed in the following range. For each range, the location and size of the range is recorded with, for example, the mean value, the slope or other attribute characterizing one or more elements in the range. The invention has also applications in pattern recognition, message routing, and in actuarial sciences.

Description

1. FIELD OF THE INVENTIONThe present invention relates generally to estimation involving generalized histogram structures and more particularly to a method of result size estimation in query optimization.2. BACKGROUND OF THE INVENTIONOne of the main uses of computers is storing and retrieving large amounts of data efficiently. The computer system used for this purpose are known as database systems and the software that manages them are known as database management systems (DBMS). The DBMS facilitates the efficient management of data by (i) allowing multiple users concurrent access to a single database, (ii) restricting access to data to authorized users only, and (iii) providing recovery from system failures without loss of data integrity. The DBMS usually provides an easy to use high-level query / data manipulation language such as the Structured Query Language (SQL) as the primary interface to access the underlying data.SQL, the most commonly used language in modern-day DBMSs, is a ...

Claims


Application Information

Patent Timeline
Patent Type & Authority Patents(United States)
IPC IPC(8): G06F17/30
CPCG06F17/30463G06F17/30536G06F17/30469Y10S707/99932G06F16/24542G06F16/24545G06F16/2462
Inventor OOMMEN, BASANTKUMAR JOHNTHIYAGARAJAH, MURALI
Owner OOMMEN BASANTKUMAR JOHN
Why Eureka
Try Eureka