System and method for monitoring resources in a water utility network

a water utility network and resource technology, applied in the direction of instruments, fluid loss/gain rate measurement, fluid tightness measurement, etc., to achieve the effect of increasing consumption and being easy to d

Active Publication Date: 2011-09-08
TAKADU
View PDF79 Cites 100 Cited by
  • Summary
  • Abstract
  • Description
  • Claims
  • Application Information

AI Technical Summary

Benefits of technology

[0015]In some embodiments, the method includes receiving secondary data from one or more sources external to the meters, the secondary data representing one or more conditions affecting consumption of water in a region serviced by the water utility network. The secondary data could include, for example, weather data representing weather conditions in the region of the water utility network, calendar data representing one or more factors affecting water consumption on a given date, repair data representing one or more repairs performed on the water utility network, and structural data representing a structure of the water utility network. As explained further herein, this secondary data can be analyzed along with the meter data to provide better, more accurate results and to reduce or eliminate false alarms. For example, an anomalous increase in water flow or consumption in a given region of a water utility network may be explained by above average heat or dryness or by a holiday or other natural or human event which causes people to stay home and not go to work or otherwise change the typical consumption pattern at a particular location or locations.
[0017]In some embodiments, statistically predicting meter data for the first meter based on other meter data from the water utility network includes selecting one or more second meters as one or more corresponding meters and correlating meter data received from the first meter with meter data received from the one or more corresponding meters. The one or more second meters may be selected by correlating historical meter data for the one or more second meters with historical meter data for the first meter. In some embodiments, the one or more second meters may be meters which each historically had close correlation with the values of the first meter. Loosely speaking, in routine network operation, the first meter's values are expected to continue this correlation. By way of illustration, such a situation may arise when several meters measure the flow of water consumed by several distinct neighborhoods with similar demographics, and hence similar (or proportional) consumption patterns. The one or more second meters may further be selected as ones which are positioned within the water utility network so as to be unaffected by local anomalies affecting the first meter, of the sort which is of interest to the network operator, such as a leak; yet, being part of the same network and general area, the second meters are affected by the same global anomalies, such as increased consumption on a hot day. In this way, a local anomaly affecting the data from the first meter will not affect the data from the second meters and so will be easier to detect by a statistical comparison to the data from the second meter(s), yet a global anomaly will not generate a false alert, even if its cause is unknown.

Problems solved by technology

The informational events that may be reported include an unexpected increase in consumption pattern, a change in consumption pattern, a theft of water, a zonal boundary breach, a utility meter fault, and a network device malfunction.

Method used


Image

  • System and method for monitoring resources in a water utility network
  • System and method for monitoring resources in a water utility network
  • System and method for monitoring resources in a water utility network

Examples


Embodiment Construction

[0030]In the following description, reference is made to the accompanying drawings that form a part hereof, and in which is shown by way of illustration of specific embodiments in which the invention may be practiced. It is to be understood that other embodiments may be utilized and structural changes may be made without departing from the scope of the present invention.

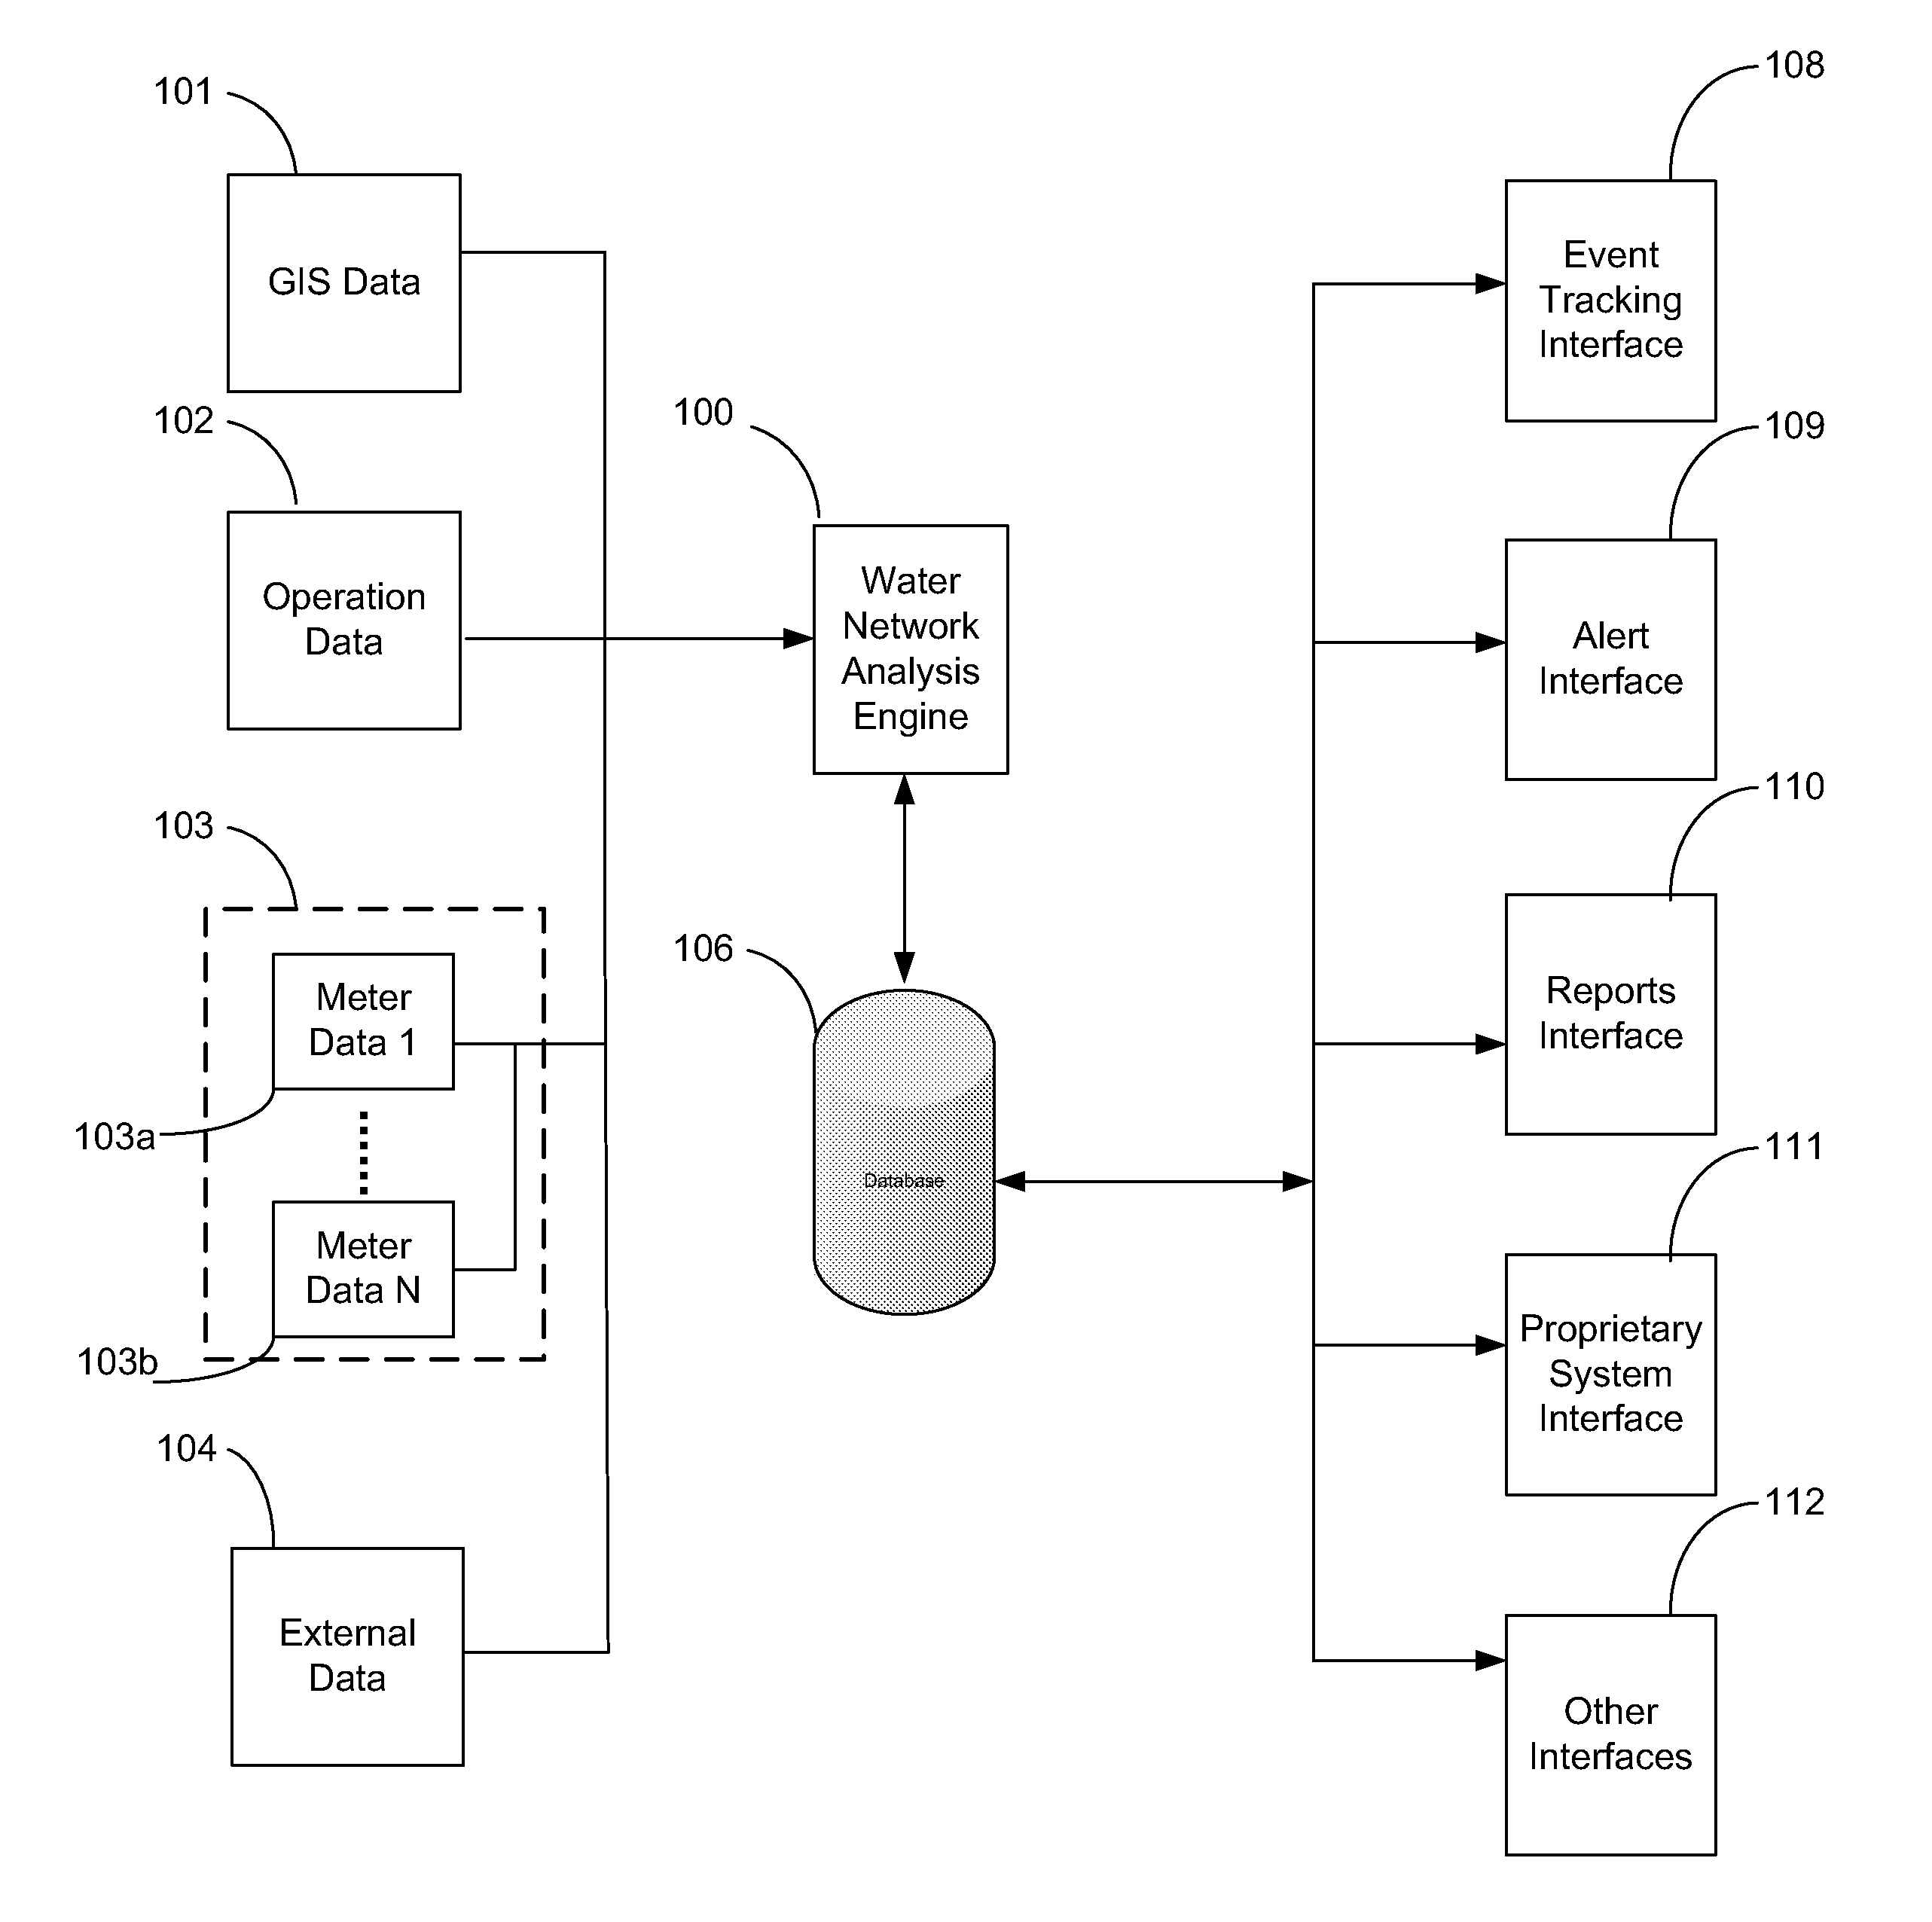
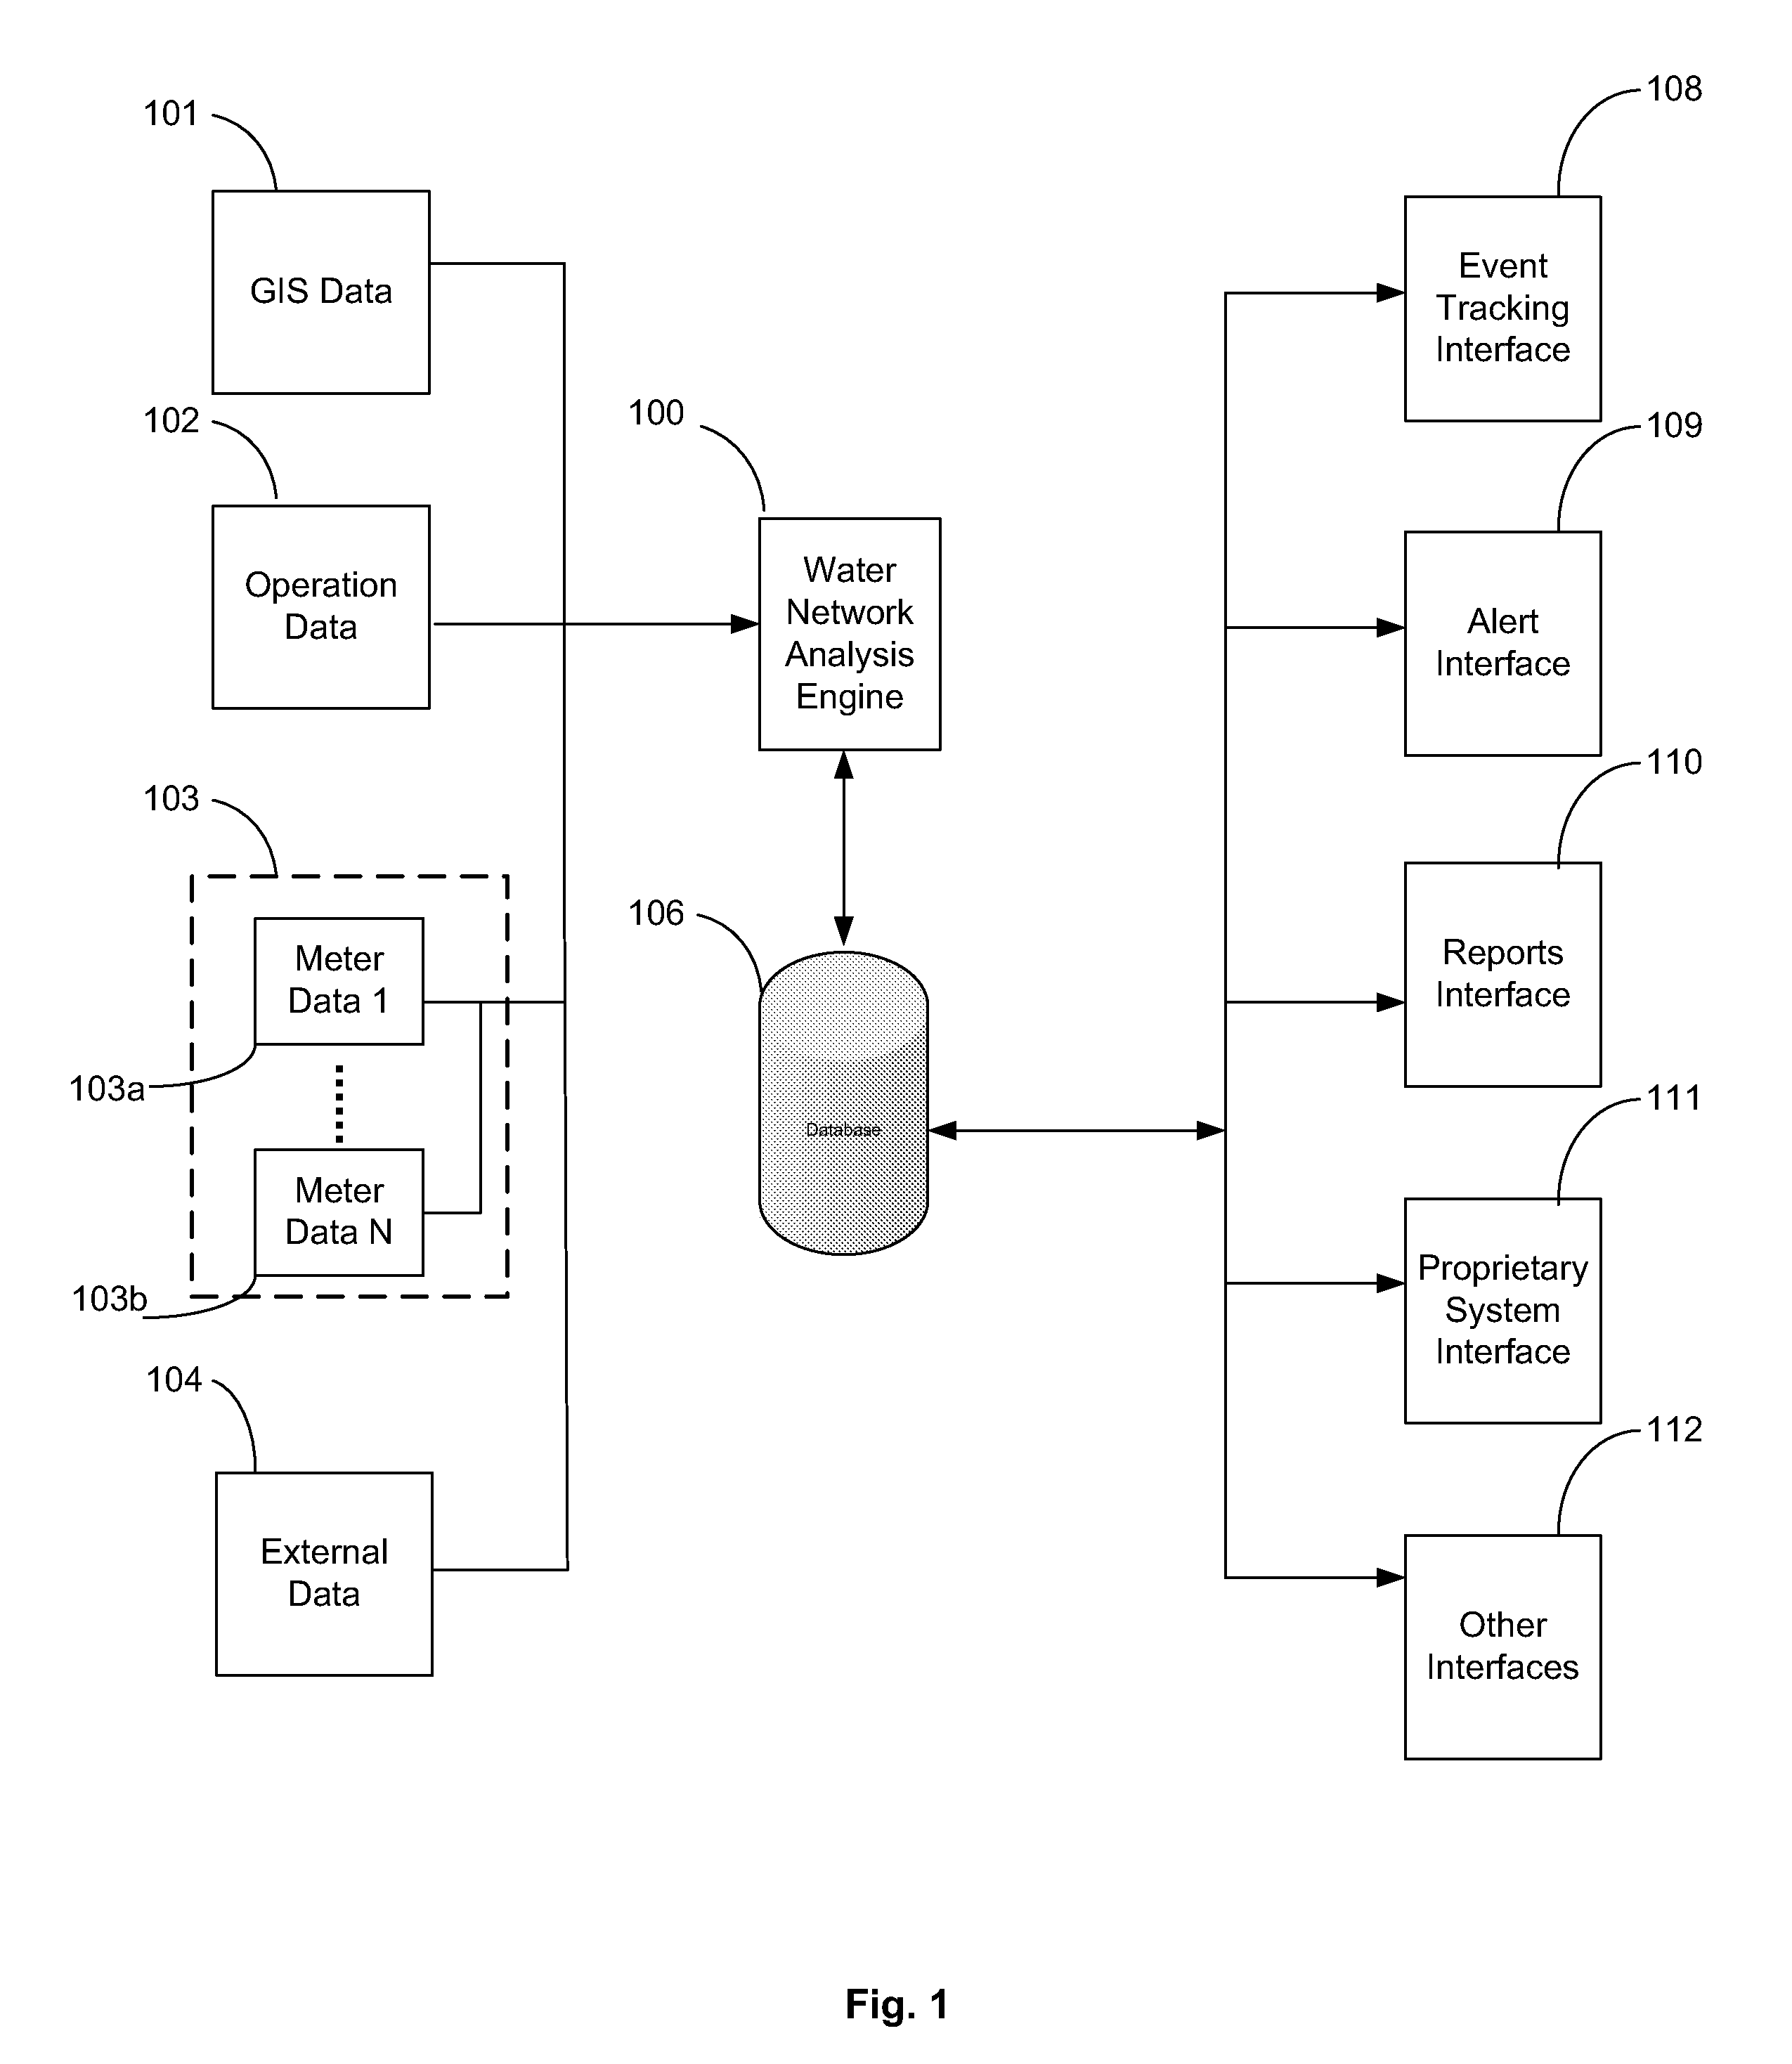
[0031]FIG. 1 presents a block diagram illustrating one embodiment of a system for monitoring resources in a water distribution system. As shown in FIG. 1, the system includes a Water Network Analysis Engine 100 composed of various software modules and databases residing on computer hardware and performing the functions described further below. The engine 100 may include one or more processing devices performing the below-described operations in response to executable instructions. The Water Network Analysis Engine 100 analyzes data received from different meters, sensors, reading devices, or other data pertaining to ...


PUM


Abstract

A computerized method for monitoring a water utility network, the water utility network comprising a network of pipes for delivering water to consumers and a plurality of meters positioned within the pipes across the water distribution network. The method includes receiving meter data representing parameters measured by the meters, such as flow, pressure, chlorine level, pH and turbidity of the water being distributed through the pipes. The method also includes receiving secondary data from sources external to the meters and representing conditions affecting consumption of water in a region serviced by the water utility network such as weather and holidays. The meter and secondary data is analyzed using statistical techniques to identify water network events including leakage events and other events regarding quantity and quality of water flowing through the pipes and operation of the water network. The events are reported to users via a user interface.

Description

CLAIM OF PRIORITY[0001]This application is a continuation of and claims priority to U.S. Ser. No. 12 / 717,944, filed on Mar. 4, 2010, which is incorporated herein by reference in its entirety.COPYRIGHT NOTICE[0002]A portion of the disclosure of this patent document contains material which is subject to copyright protection. The copyright owner has no objection to the facsimile reproduction by anyone of the patent document or the patent disclosure, as it appears in the Patent and Trademark Office patent files or records, but otherwise reserves all copyright rights whatsoever.FIELD OF THE INVENTION[0003]The field of the invention relates generally to monitoring resource distribution systems, such as a water utility network, and detecting anomalies associated with the distributed network.BACKGROUND OF THE INVENTION[0004]The United Nations notes that water use has been growing at more than twice the rate of population increase in the last century, and an increasing number of regions are ...

Claims


Application Information

Patent Timeline
Patent Type & Authority Applications(United States)
IPC IPC(8): G08C15/06
CPCG01M3/2807G06Q50/06G06Q10/06Y10T137/0318Y04S20/30Y02B90/20F17D5/02G01D4/00G01D4/004G01D4/02G01M3/28
Inventor PELEG, AMIRARMON, AMITAIBARKAY, URISCOLNICOV, HAGGAIGUTNER, SHAI
Owner TAKADU
Why Eureka
Try Eureka