
Optimized inventory selection

a technology of inventory selection and selection method, applied in the direction of knowledge representation, pulse technique, instruments, etc., can solve the problems of high purchase rate of inventory items, loss of potential sales, and sales are not without problems

Inactive Publication Date: 2010-05-06
EXPEDIA INC
View PDF8 Cites 18 Cited by
  • Summary
  • Abstract
  • Description
  • Claims
  • Application Information

AI Technical Summary

Problems solved by technology

This revolution in sales is not without problems, however.
While inventory catalogs have been made searchable, search results are often not displayed in any order of relevance to the consumer, requiring an investment of time and resources by the consumer to identify possible items for purchase, and may result in loss of potential sales.
One problem with this approach, among others, is the assumption that search results ranked in this manner will have greater relevance to the consumer viewing the ranked inventory, and result in higher purchase rates of inventory items, than search results not ranked in this manner.
Furthermore, even assuming that higher purchase rates result from such ranking, there is no guarantee that the profits of the seller will rise in response, as the per unit profit of inventory items may vary significantly.

Method used


Image

  • Optimized inventory selection
  • Optimized inventory selection
  • Optimized inventory selection

Examples


example 1

Generation of Training Data

[0061]Assume that observations are made regarding purchasing choices with respect to a first hotel and a second hotel. In a first case, the first hotel possesses the attributes of a 1-star rating and a daily rate of $100, while the second hotel possesses the attributes of a 2-star rating and a daily rate of $100. Assuming that any other attributes of the first and second hotels are the same, except for the star rating, and the buyer chooses the second hotel for lodging, it may be concluded that a 2-star rating is preferred to a 1-star rating.

[0062]Consider a second case that is kept constant with respect to the first case, except that that the daily rate of the second hotel is increased from $100 to $120. If the user still chooses the second hotel for lodging, then it may be concluded that an extra 1-star is worth at least $20 to the buyer. By repeating this exercise, increasing the daily rate of the second hotel while keeping all other attributes of the f...

example 2

Calculation of Utility, Purchase Likelihood, and Inventory Score

[0064]Mathematically, the utility function for the two hotels may be written according to Equation 2 using the training data of Table I as:

[0065]First Hotel, i=1:

Utility1=exp(weight1*attribute1,1+weight2*attribute2,1)

Utility1=exp(40*star rating1−1*daily rate1)

Utility1=exp(40*1−1*100)=exp(40−100)=exp(−60)

Utility1=8.7*10−27

[0066]Second Hotel, i=1:

Utility2=exp(weight1*attribute1,2+weight2*attribute2,2)

Utility2=exp(40*star rating2−1*daily rate2)

Utility2=exp(40*2−1*141)=exp(80−141)=exp(−61)

Utility2=3.2*10−27

[0067]Thus, it may be seen that the utility function numerically captures the observation of the training data that the utility of the second hotel is equal to or greater than the utility of the first hotel until the daily rate of the second hotel exceeds $140. By adding more inventory attributes, a utility function valuing all the inventory attributes may be derived, provided that a training data set having sufficient ...


PUM


Abstract

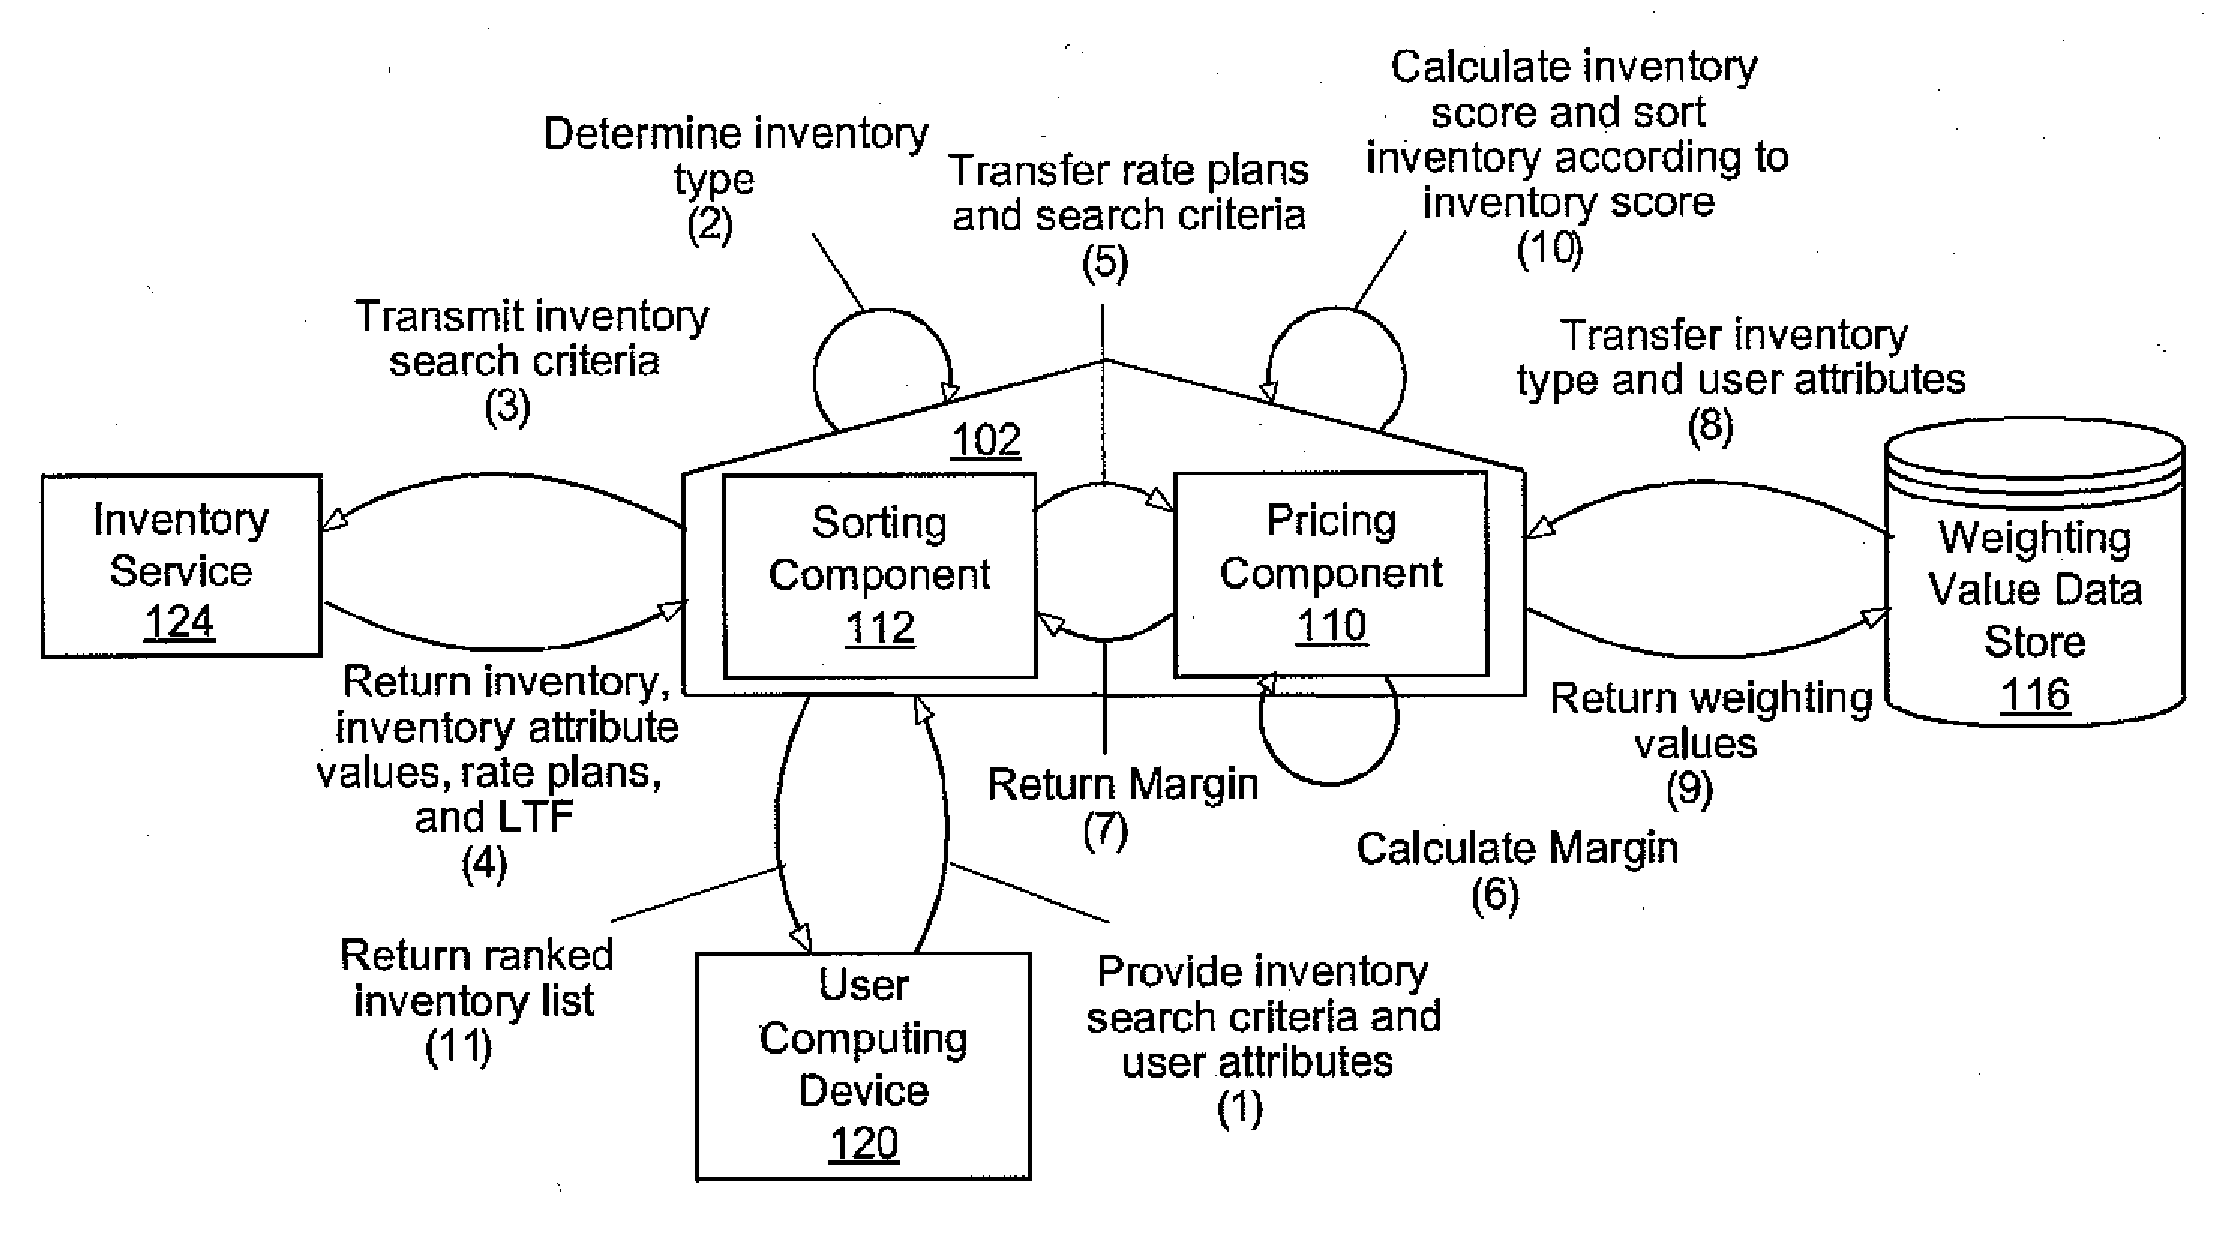
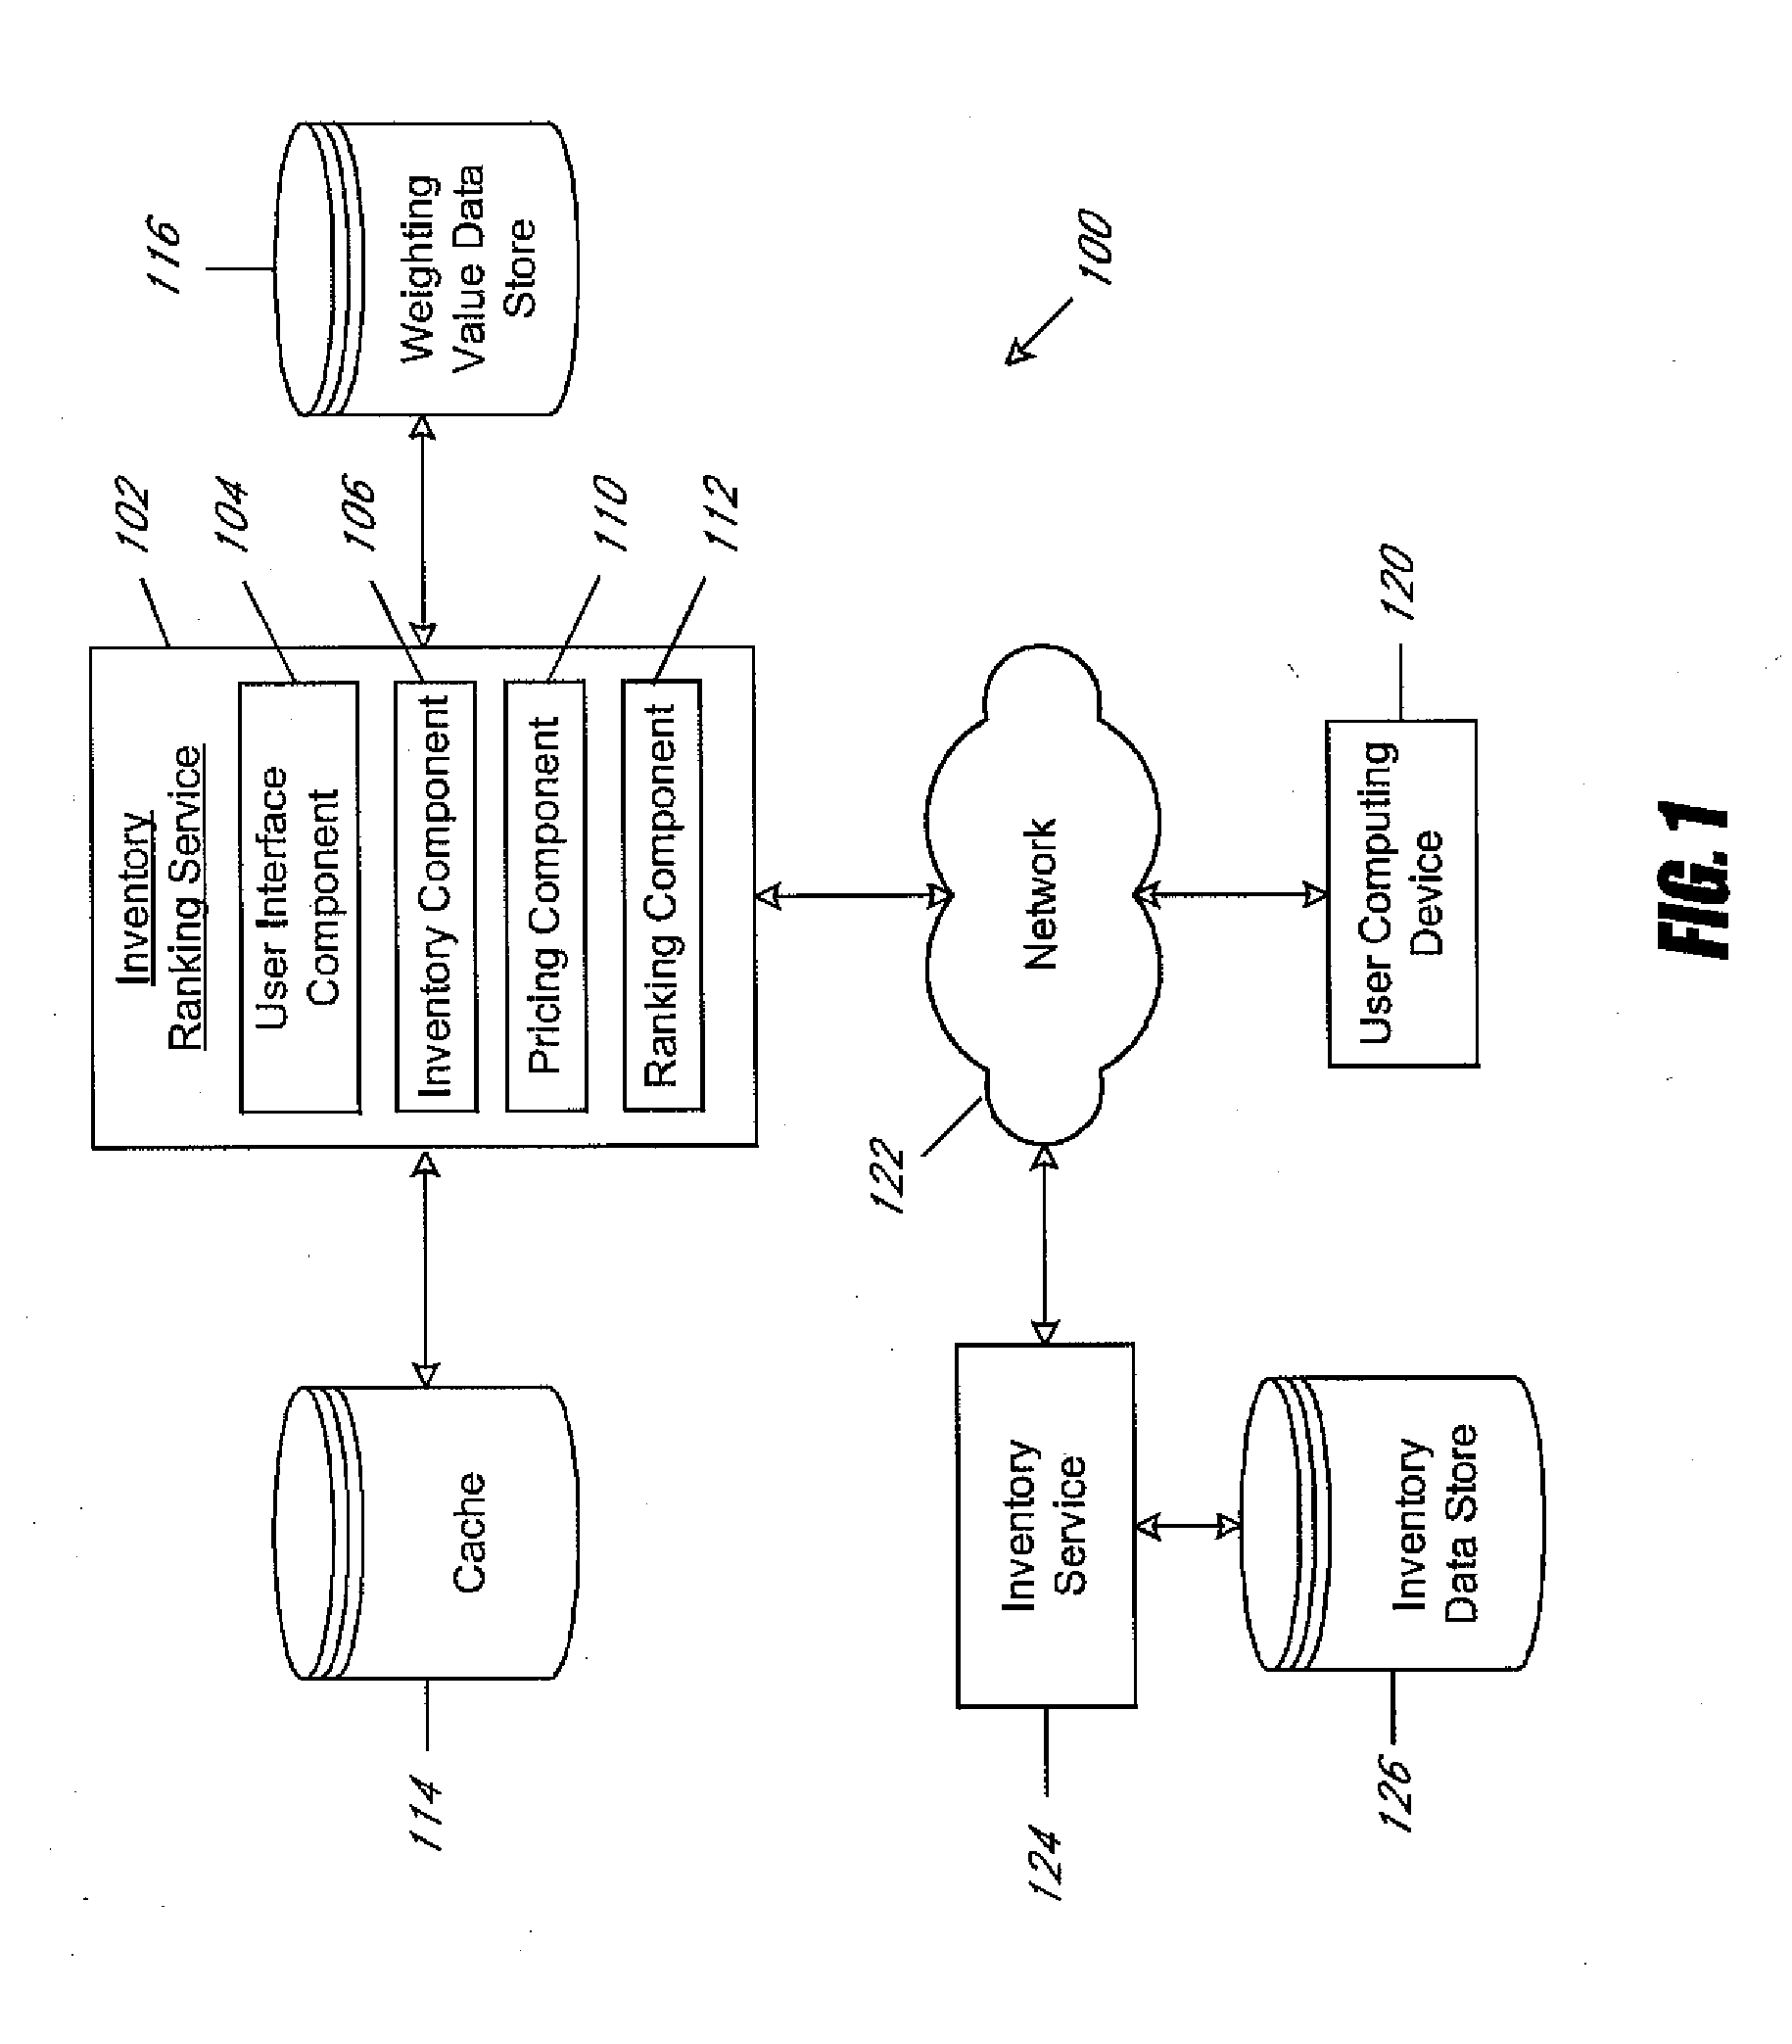
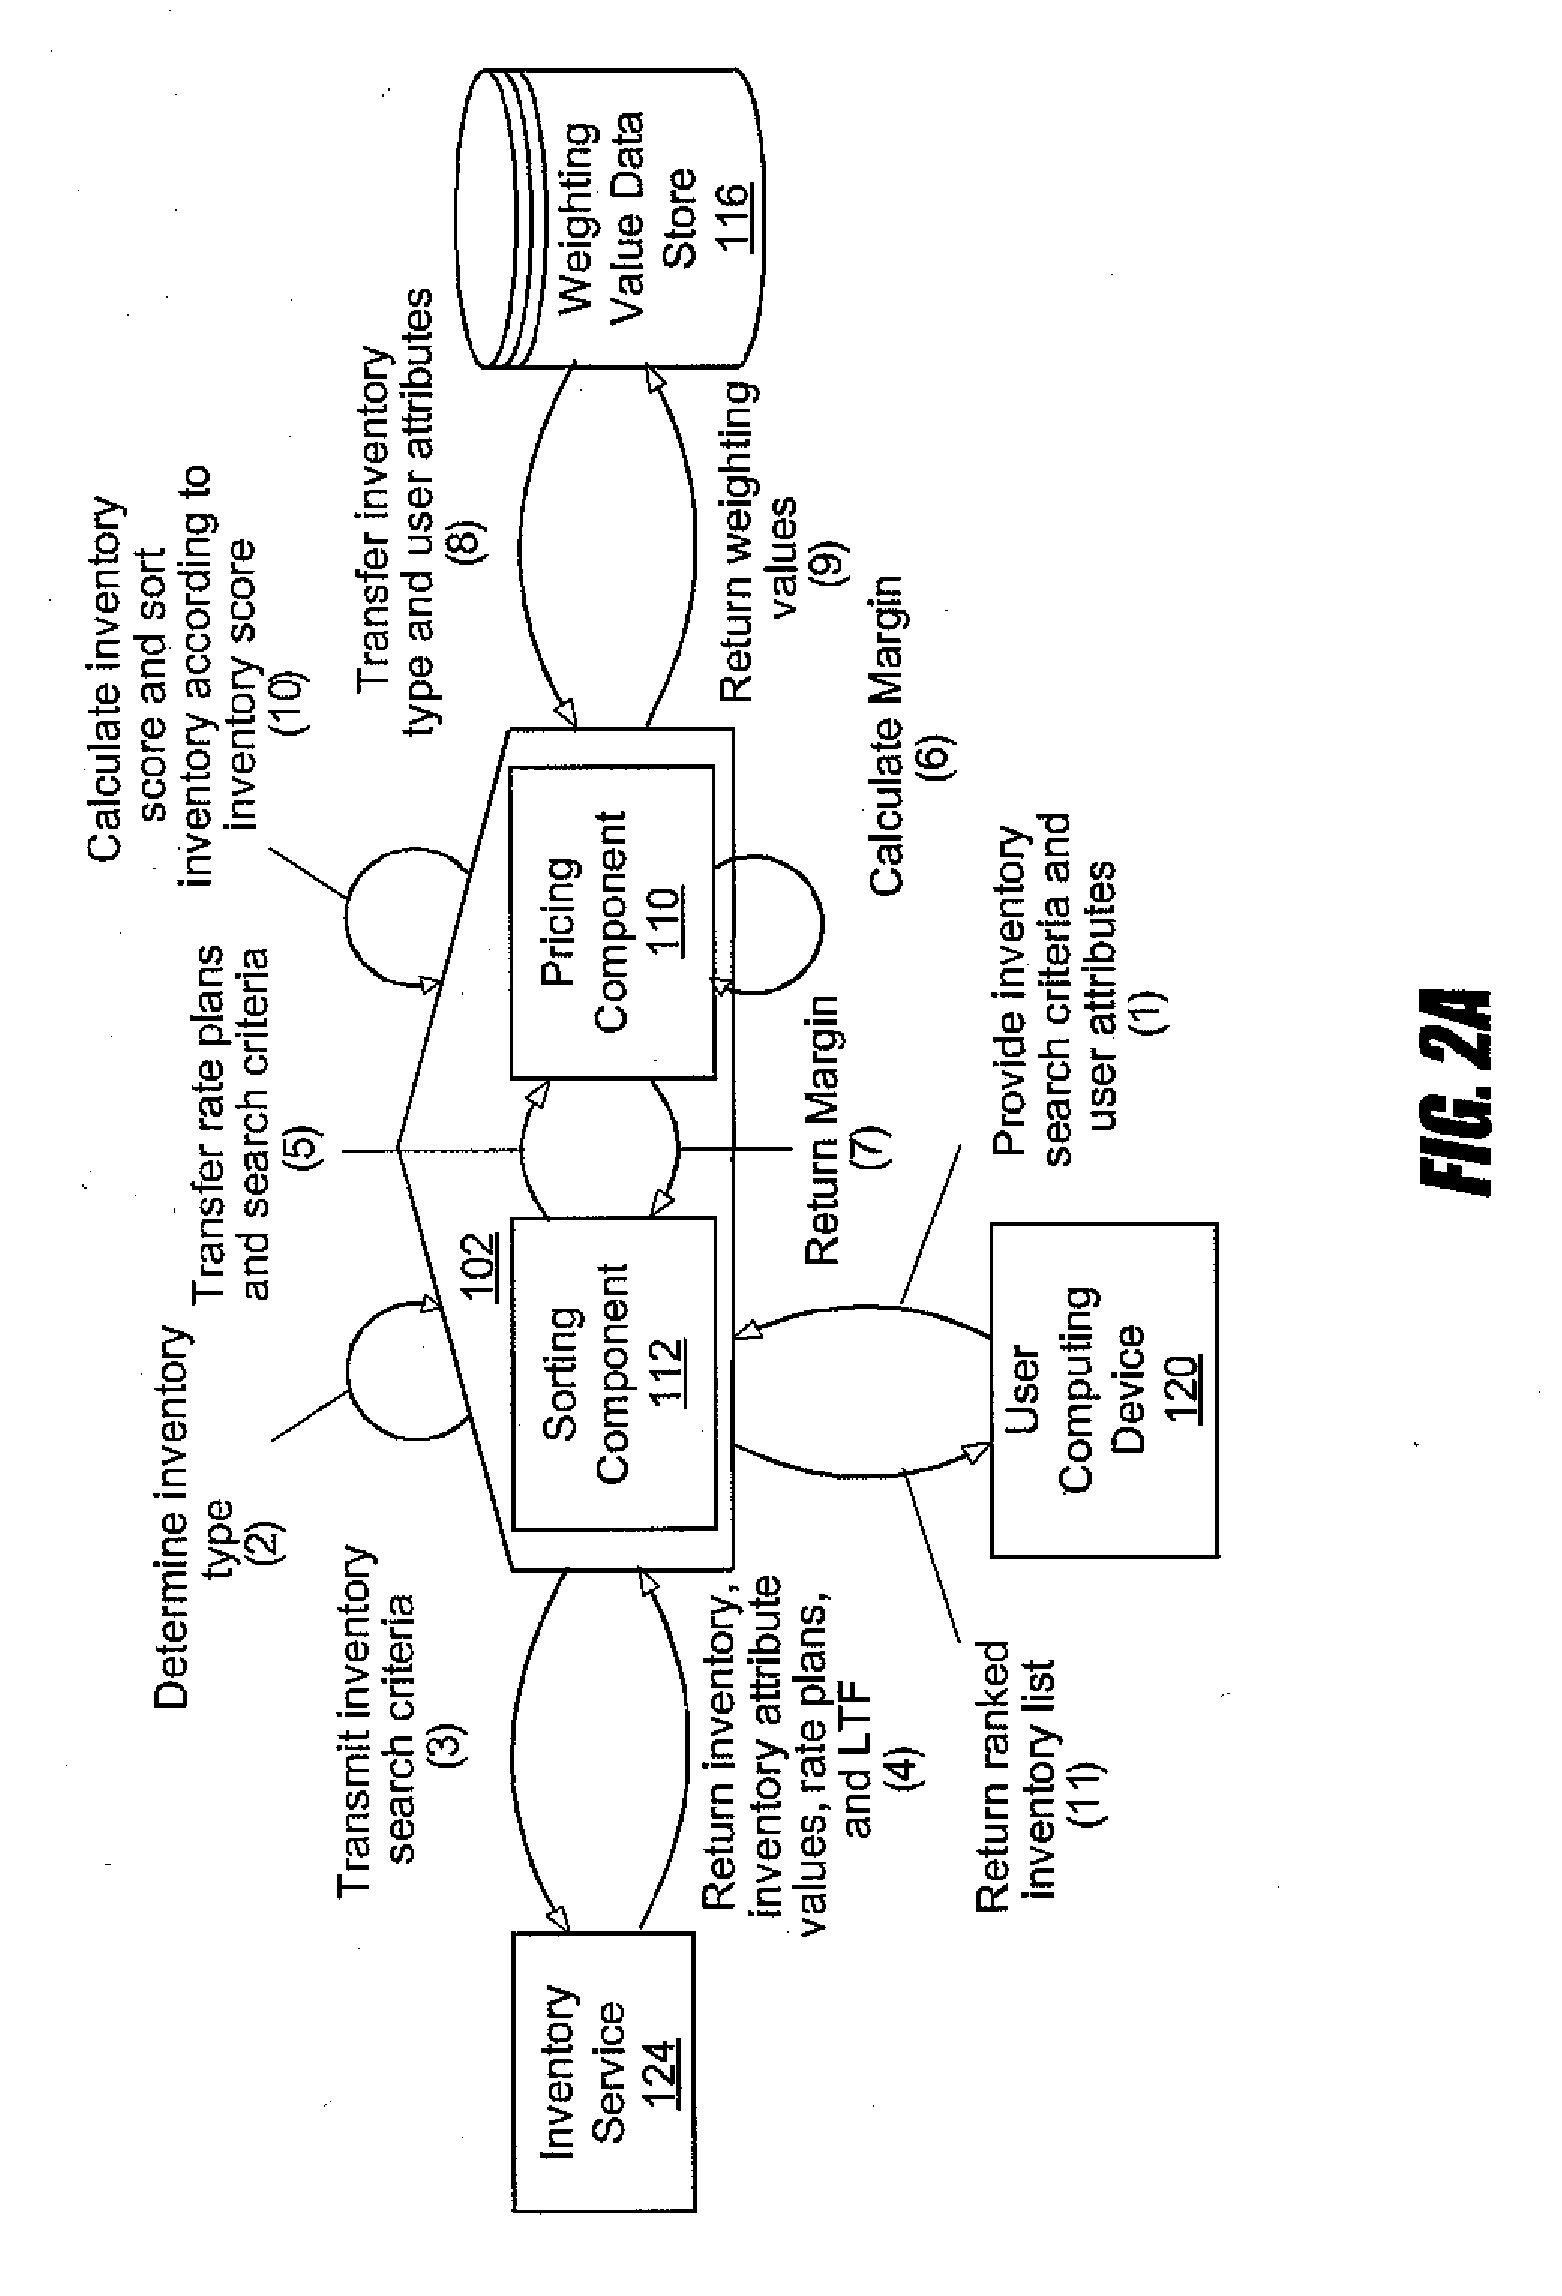
Systems and methods for electronically ranking records of inventory items are provided. Inventory items satisfying search criteria are electronically identified and ranked according to an inventory score calculated from a function comprising inventory attribute values of the inventory items and weighting values corresponding to the inventory attributes. The scored inventory may be further displayed to a user, such as a user that electronically submits the search criteria. The attribute values may include inventory item characteristics perceptible to users of the inventory items. The weighting values may be generated from a discrete choice model employing a conditional logit function fit to training data. The inventory score function may further include a long term function that numerically represents inventory items characteristic that are not perceptible to users of the inventory items. The disclosed embodiments may be applied to inventory including, but not limited to, travel inventory, such as hotels.

Description

CROSS-REFERENCE TO RELATED APPLICATION[0001]This application claims the benefit of U.S. Provisional Application No. 61 / 112,136, filed Nov. 6, 2008, the entirety of which is incorporated herein by reference.BACKGROUNDDescription of the Related Art[0002]Data networks, such as the Internet, have become an increasingly popular mechanism for making retail and business purchases. Advances in technology have allowed large catalogs of inventory to be made available for searching and viewing, facilitating the selection and purchase of inventory items. As a result, industries such as autos, books, electronics, tickets, travel, and others now consider network originated sales to be an important sales channel.[0003]This revolution in sales is not without problems, however. While inventory catalogs have been made searchable, search results are often not displayed in any order of relevance to the consumer, requiring an investment of time and resources by the consumer to identify possible items fo...

Claims


Application Information

Patent Timeline
Patent Type & Authority Applications(United States)
IPC IPC(8): G06Q10/00G06Q50/00G06N5/02G06F17/30
CPCG06Q10/02G06Q10/087G06F16/24578G06Q30/0206G06Q50/12G06Q30/02
Inventor GANGULY, SANDIPANLYNN, DANIEL MARK
Owner EXPEDIA INC
Learn More