Method and Data Processing Appliance for the Production and for the Output of a Multidimensional Chart Having at Least Two Graphs

a multi-dimensional chart and data processing technology, applied in the field of multi-dimensional chart production and output, can solve problems such as problems, and achieve the effects of avoiding problems, ensuring complete visibility of all graphs, and ensuring clear and concise presentation

Inactive Publication Date: 2010-12-09
SIEMENS AG
View PDF11 Cites 1 Cited by
  • Summary
  • Abstract
  • Description
  • Claims
  • Application Information

AI Technical Summary

Benefits of technology

[0007]This and other objects and advantages are achieved in accordance with the invention by providing a method for producing and outputting a multidimensional chart having at least two graphs, where for each of the graphs which are to be presented an area between the graph and an abscissa is provided with a respective fill color or with a respective fill pattern, where the graphs and the associated areas are presented in presentation planes located above one another relative to a presentation area, and where a respective graph and the associated area in a lower presentation plane are concealed by a graph and the associated area in a higher presentation plane. Here, the chart is produced and output in sections, where for each section of the abscissa a first of the graphs and the area associated with the graph are presented using a higher value (e.g., functional value or measured value) in a lower presentation plane and a second of the graphs and the associated area thereof are presented using a lower value in a higher presentation plane. The application of the method changes the graphs for each section of the abscissa in those presentation planes such that concealment is avoided. This further development of an area chart or what is know as an area trend allows a plurality of curves to be visually displayed completely within a chart / trend. As a result, it is possible to use the advantages of an area chart, such as clarity and conciseness of presentation, while at the same time retaining the advantage of a line chart, i.e., complete visibility of all graphs. The attribution of the graph elements or area elements to the respective presentation planes can be controlled by virtue of the chronological order of the production or visual display / presentation thereof being respectively re-stipulated in each of the sections.

Problems solved by technology

Problems can arise when a plurality of graphs need to be presented together (simultaneously) within an area chart / area trend.
This is disadvantageous in cases in which the graph presented last has higher values than a graph presented previously.

Method used


Image

  • Method and Data Processing Appliance for the Production and for the Output of a Multidimensional Chart Having at Least Two Graphs
  • Method and Data Processing Appliance for the Production and for the Output of a Multidimensional Chart Having at Least Two Graphs
  • Method and Data Processing Appliance for the Production and for the Output of a Multidimensional Chart Having at Least Two Graphs

Examples


Embodiment Construction

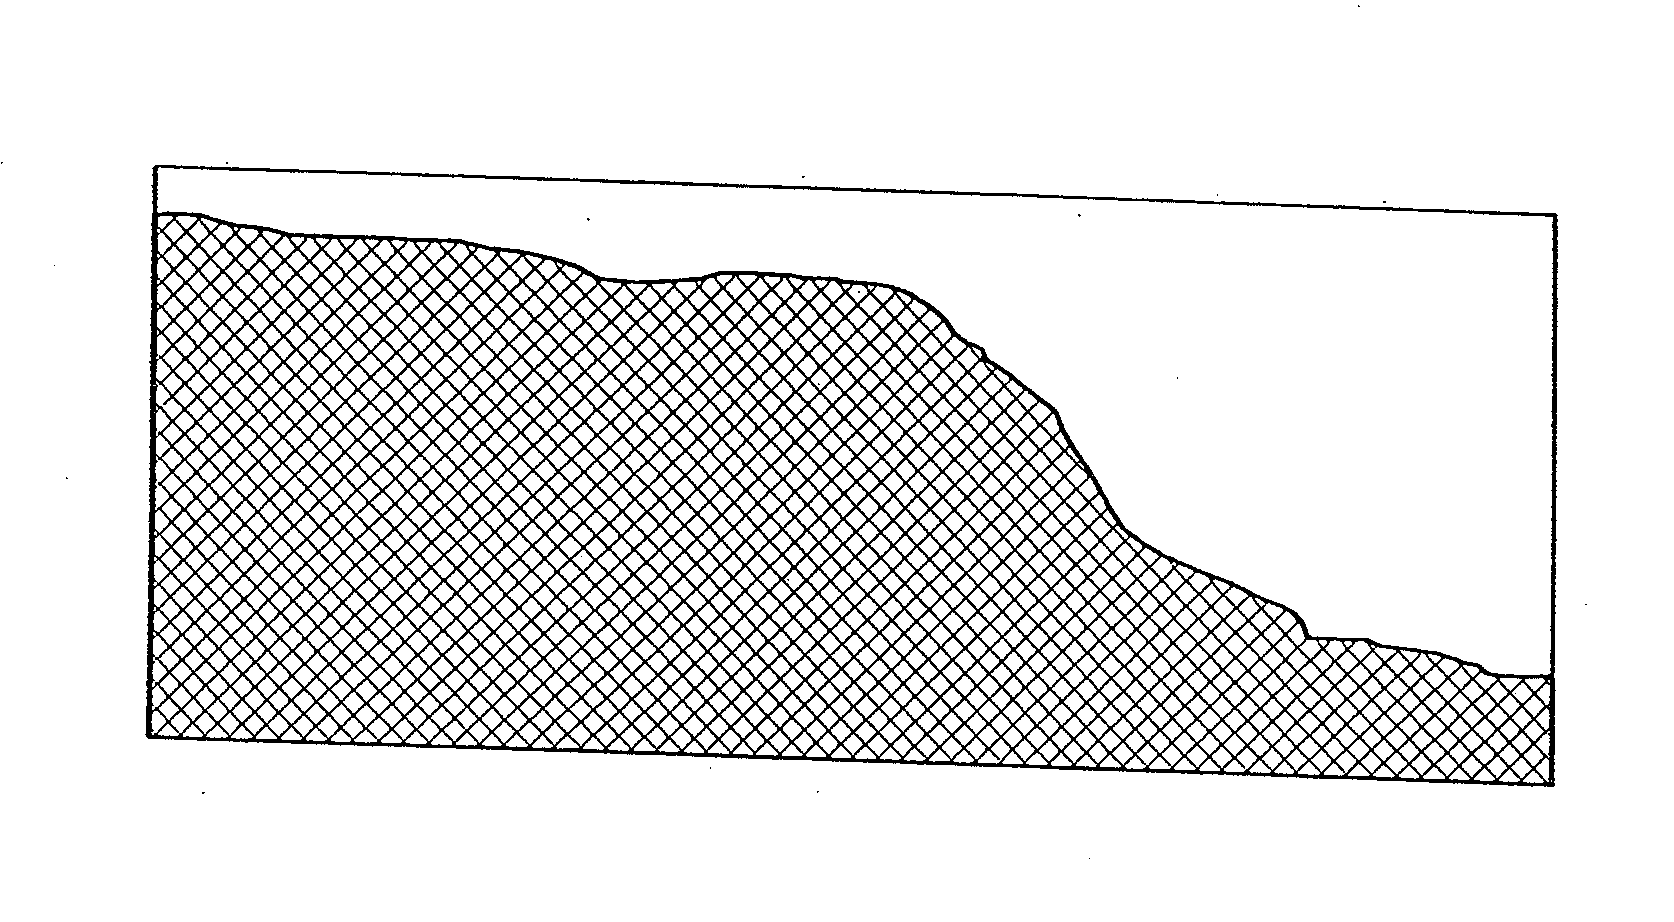
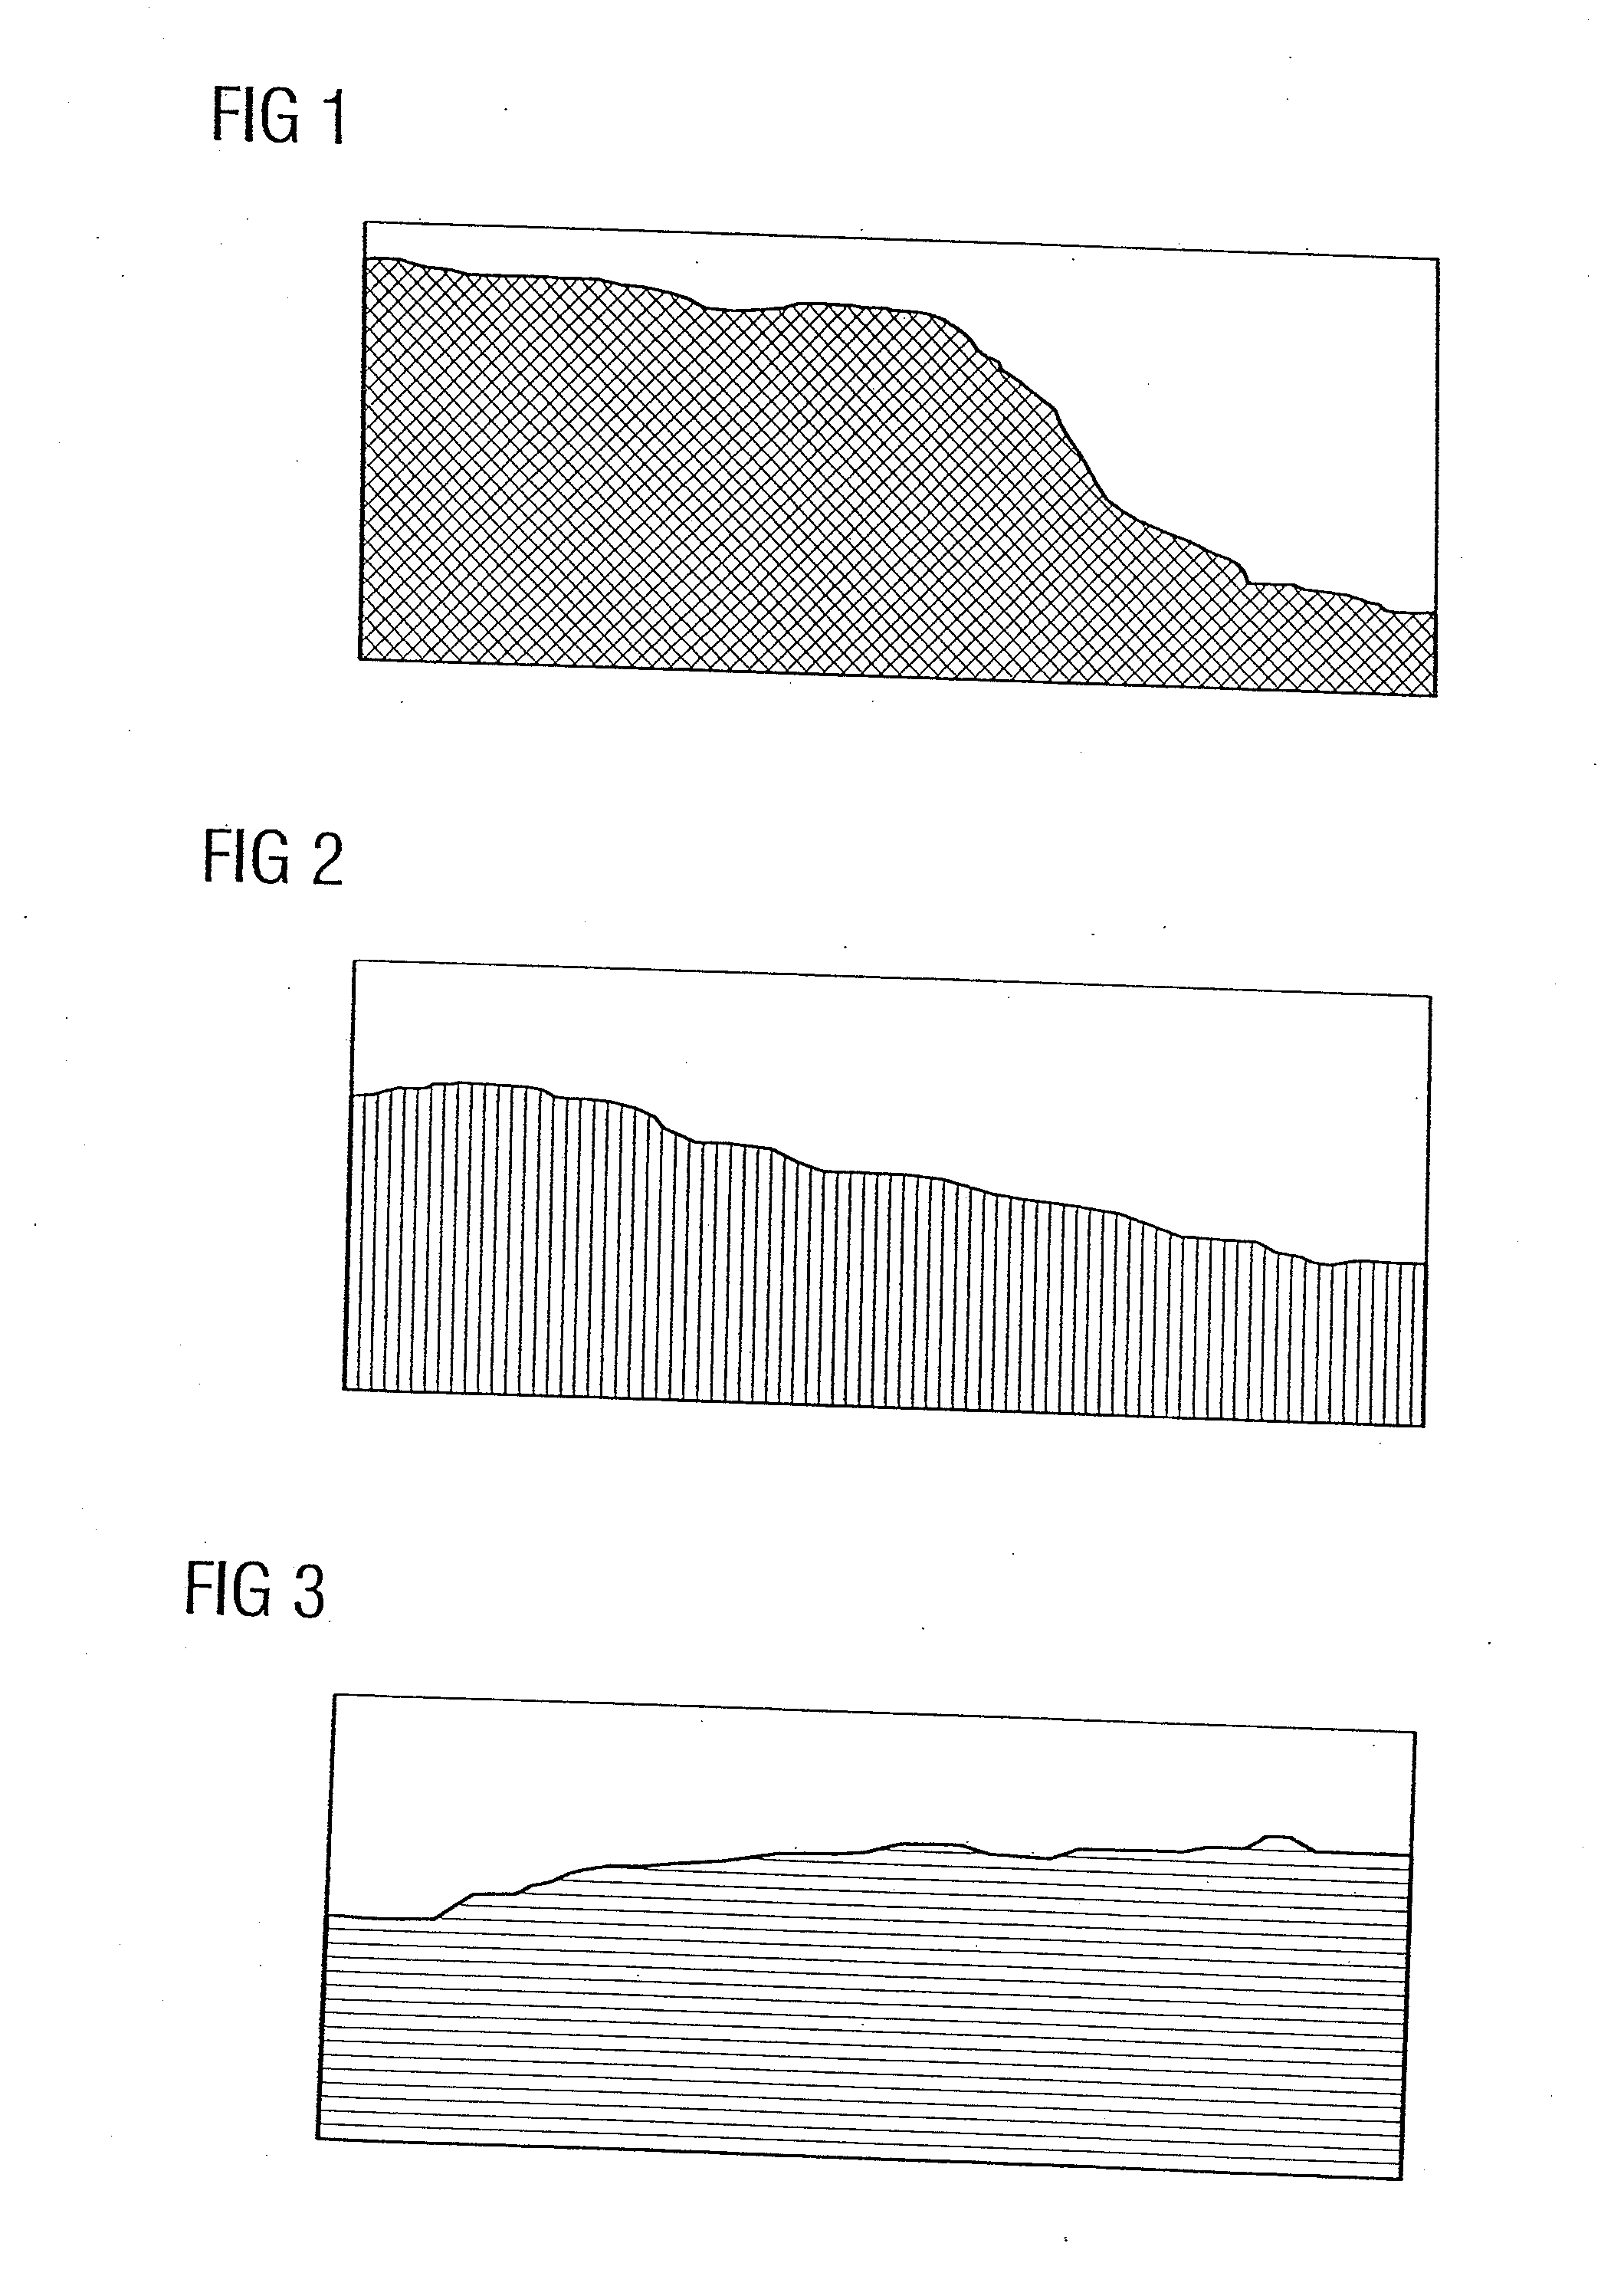
[0019]FIGS. 1, 2 and 3 each show a respective graph, where the respective area between the graph and the abscissa (in the figures the respective lower edge of the presentation is the abscissa) and the respective value (the actual graph, e.g., functional value or measured value) is filled with the respective fill pattern. While the area of the graph is cross-hatched in FIG. 1, the area for the graph from FIG. 2 is vertically hatched and the area for the graph from FIG. 3 is horizontally hatched. It should be understood that the area graphs in FIGS. 1, 2 and 3 can also be presented using different colors or different grayscales or a combination thereof instead of the hatchings.

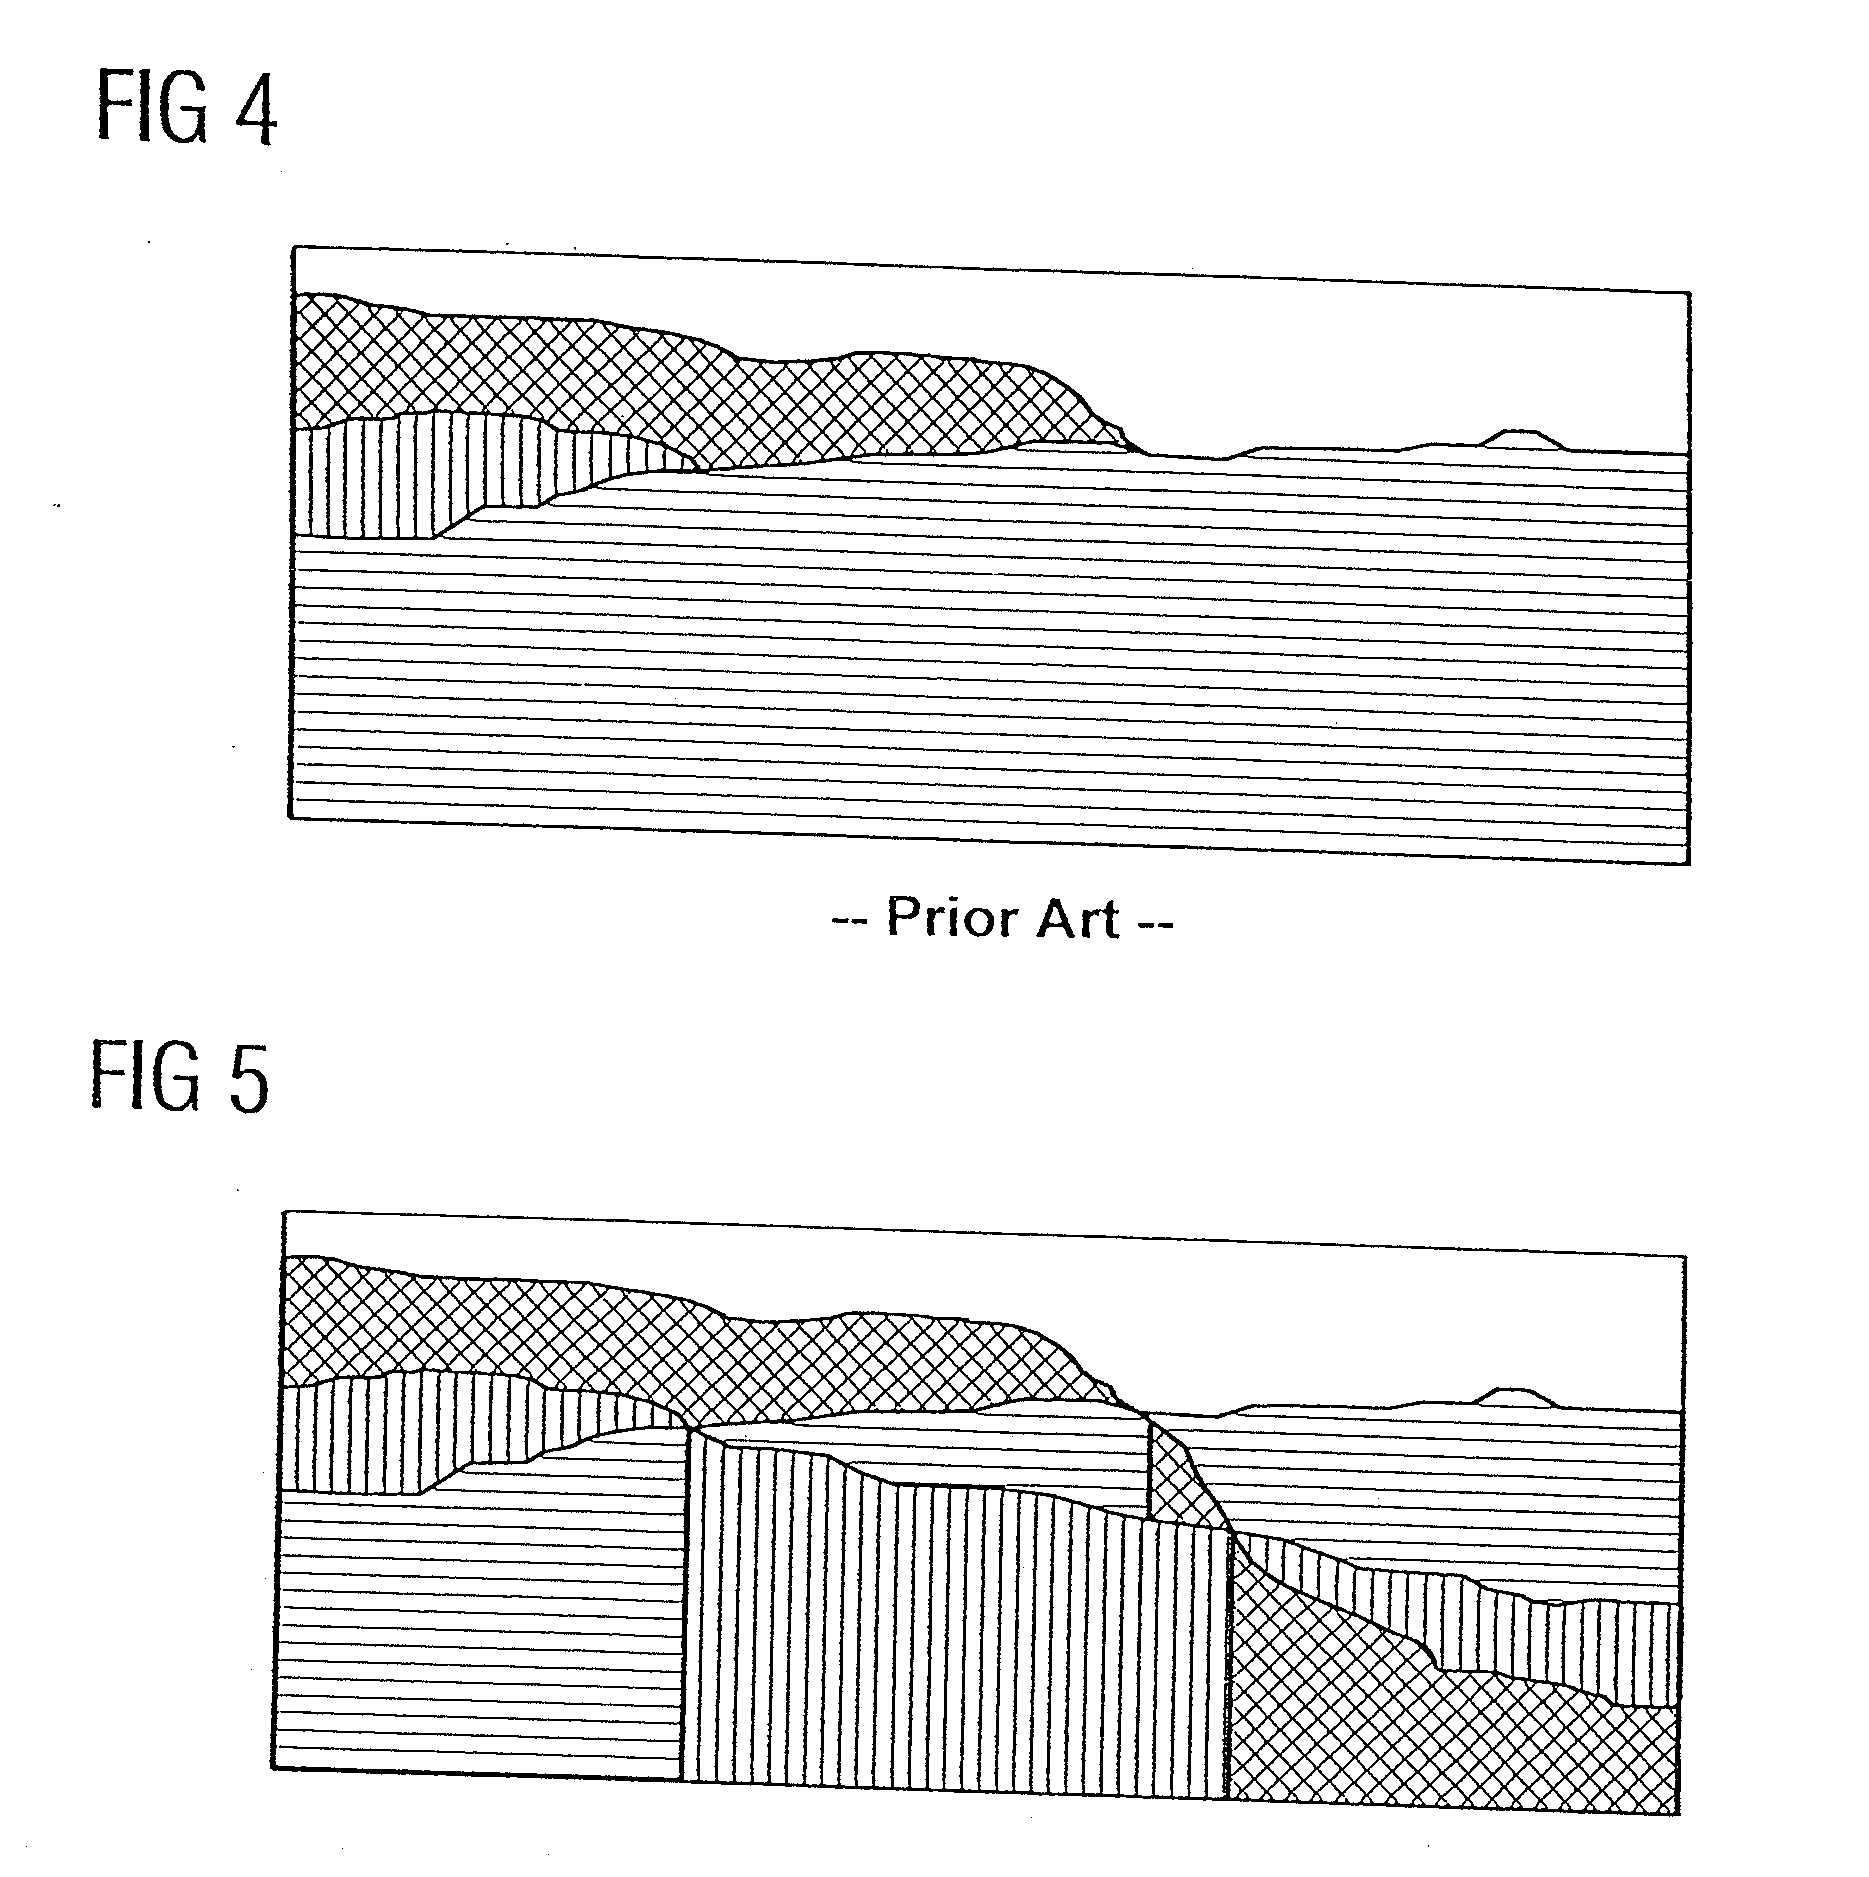
[0020]It will subsequently be assumed that the graphs from FIGS. 1, 2 and 3 are intended to be presented simultaneously within a single area chart. Using a method based on the prior art, the graphs with the associated areas are shown successively in one and the same chart, with it either being left to chance or ...


PUM


Abstract

A method and data processing appliance for the producing and outputting a multi-dimensional chart having at least two graphs, wherein for each of the graphs which are to be presented an area between the graph and an abscissa is provided with a respective fill color or with a respective fill pattern, the graphs and the associated areas are presented in presentation planes located above one another, and wherein a respective graph and the associated area in a lower presentation plane are concealed by a graph and the associated area in a higher presentation plane. Here, the chart is produced and output in sections, wherein for each section of the abscissa a first of the graphs and the area associated with the graphs are presented using a higher value in a lower presentation plane and a second of the graphs and the associated area thereof are presented using a lower value in a higher presentation plane. As a result, each graph and a portion of its area are visible in each section.

Description

BACKGROUND OF THE INVENTION[0001]The invention relates to a method and a data processing appliance for producing and outputting a multidimensional chart.[0002]Mathematical functions, series of values from experiments or measured values are often presented in two-dimensional charts, where an abscissa is used to present a reference variable and an ordinate is used to plot the associated values, such as functional values or measured values. The resulting line is called a “graph”. Here, it is usual for the visual display of value pairs to involve the individual values being plotted as points in a chart, and then the points are then connected to one another to form a solid line so that a “solid” graph in the form of a line is obtained.[0003]It is often a requirement for a chart with a graph to be able to be read even under difficult conditions. In such cases, the area between the graph and the abscissa is frequently presented in color or provided with a fill pattern so that an observer d...

Claims


Application Information

Patent Timeline
Patent Type & Authority Applications(United States)
IPC IPC(8): G06T15/00
CPCG06T11/206
Inventor BAUMLER, TOBIAS
Owner SIEMENS AG
Why Eureka
Try Eureka