
Display of travel routes

a technology of travel routes and graphs, applied in image data processing, image data processing details, forecasting, etc., can solve the problems of difficult to read graphs, difficult to understand, and difficult to draw graphs in general cases, etc., and achieve the effect of easy-to-read display of graphs

Active Publication Date: 2011-02-03
AMADEUS S
View PDF7 Cites 2 Cited by
  • Summary
  • Abstract
  • Description
  • Claims
  • Application Information

AI Technical Summary

Benefits of technology

[0007]It is a specific object of the invention that the method neither requires the use of complex iterative algorithms nor the setting of heuristic parameters to always obtain easy-to-read display of graphs.

Problems solved by technology

Nevertheless, the drawing of graphs in the general case remains a very hard problem for which a single best solution does not exist.
Although it is a highly useful function for professionals of this industry (e.g., to let them establish fares, to find alternate routes to a destination or just to have a view of a complete airline network) it is in practice rather poorly supported.
It is really not that easy though to understand the structure of a particular graph of city nodes from its list of edges and paths.
Still, it has severe limitations, like having to display in text mode a connected graph of city nodes while a graphic display would be much more appropriate in this case.
However, as stated above, the drawing of graphs on a graphic display is not an easy task in itself.

Method used


Image

  • Display of travel routes
  • Display of travel routes
  • Display of travel routes

Examples


Embodiment Construction

[0034]The following detailed description of the invention refers to the accompanying drawings. While the description includes exemplary embodiments, other embodiments are possible, and changes may be made to the embodiments described without departing from the spirit and scope of the invention.

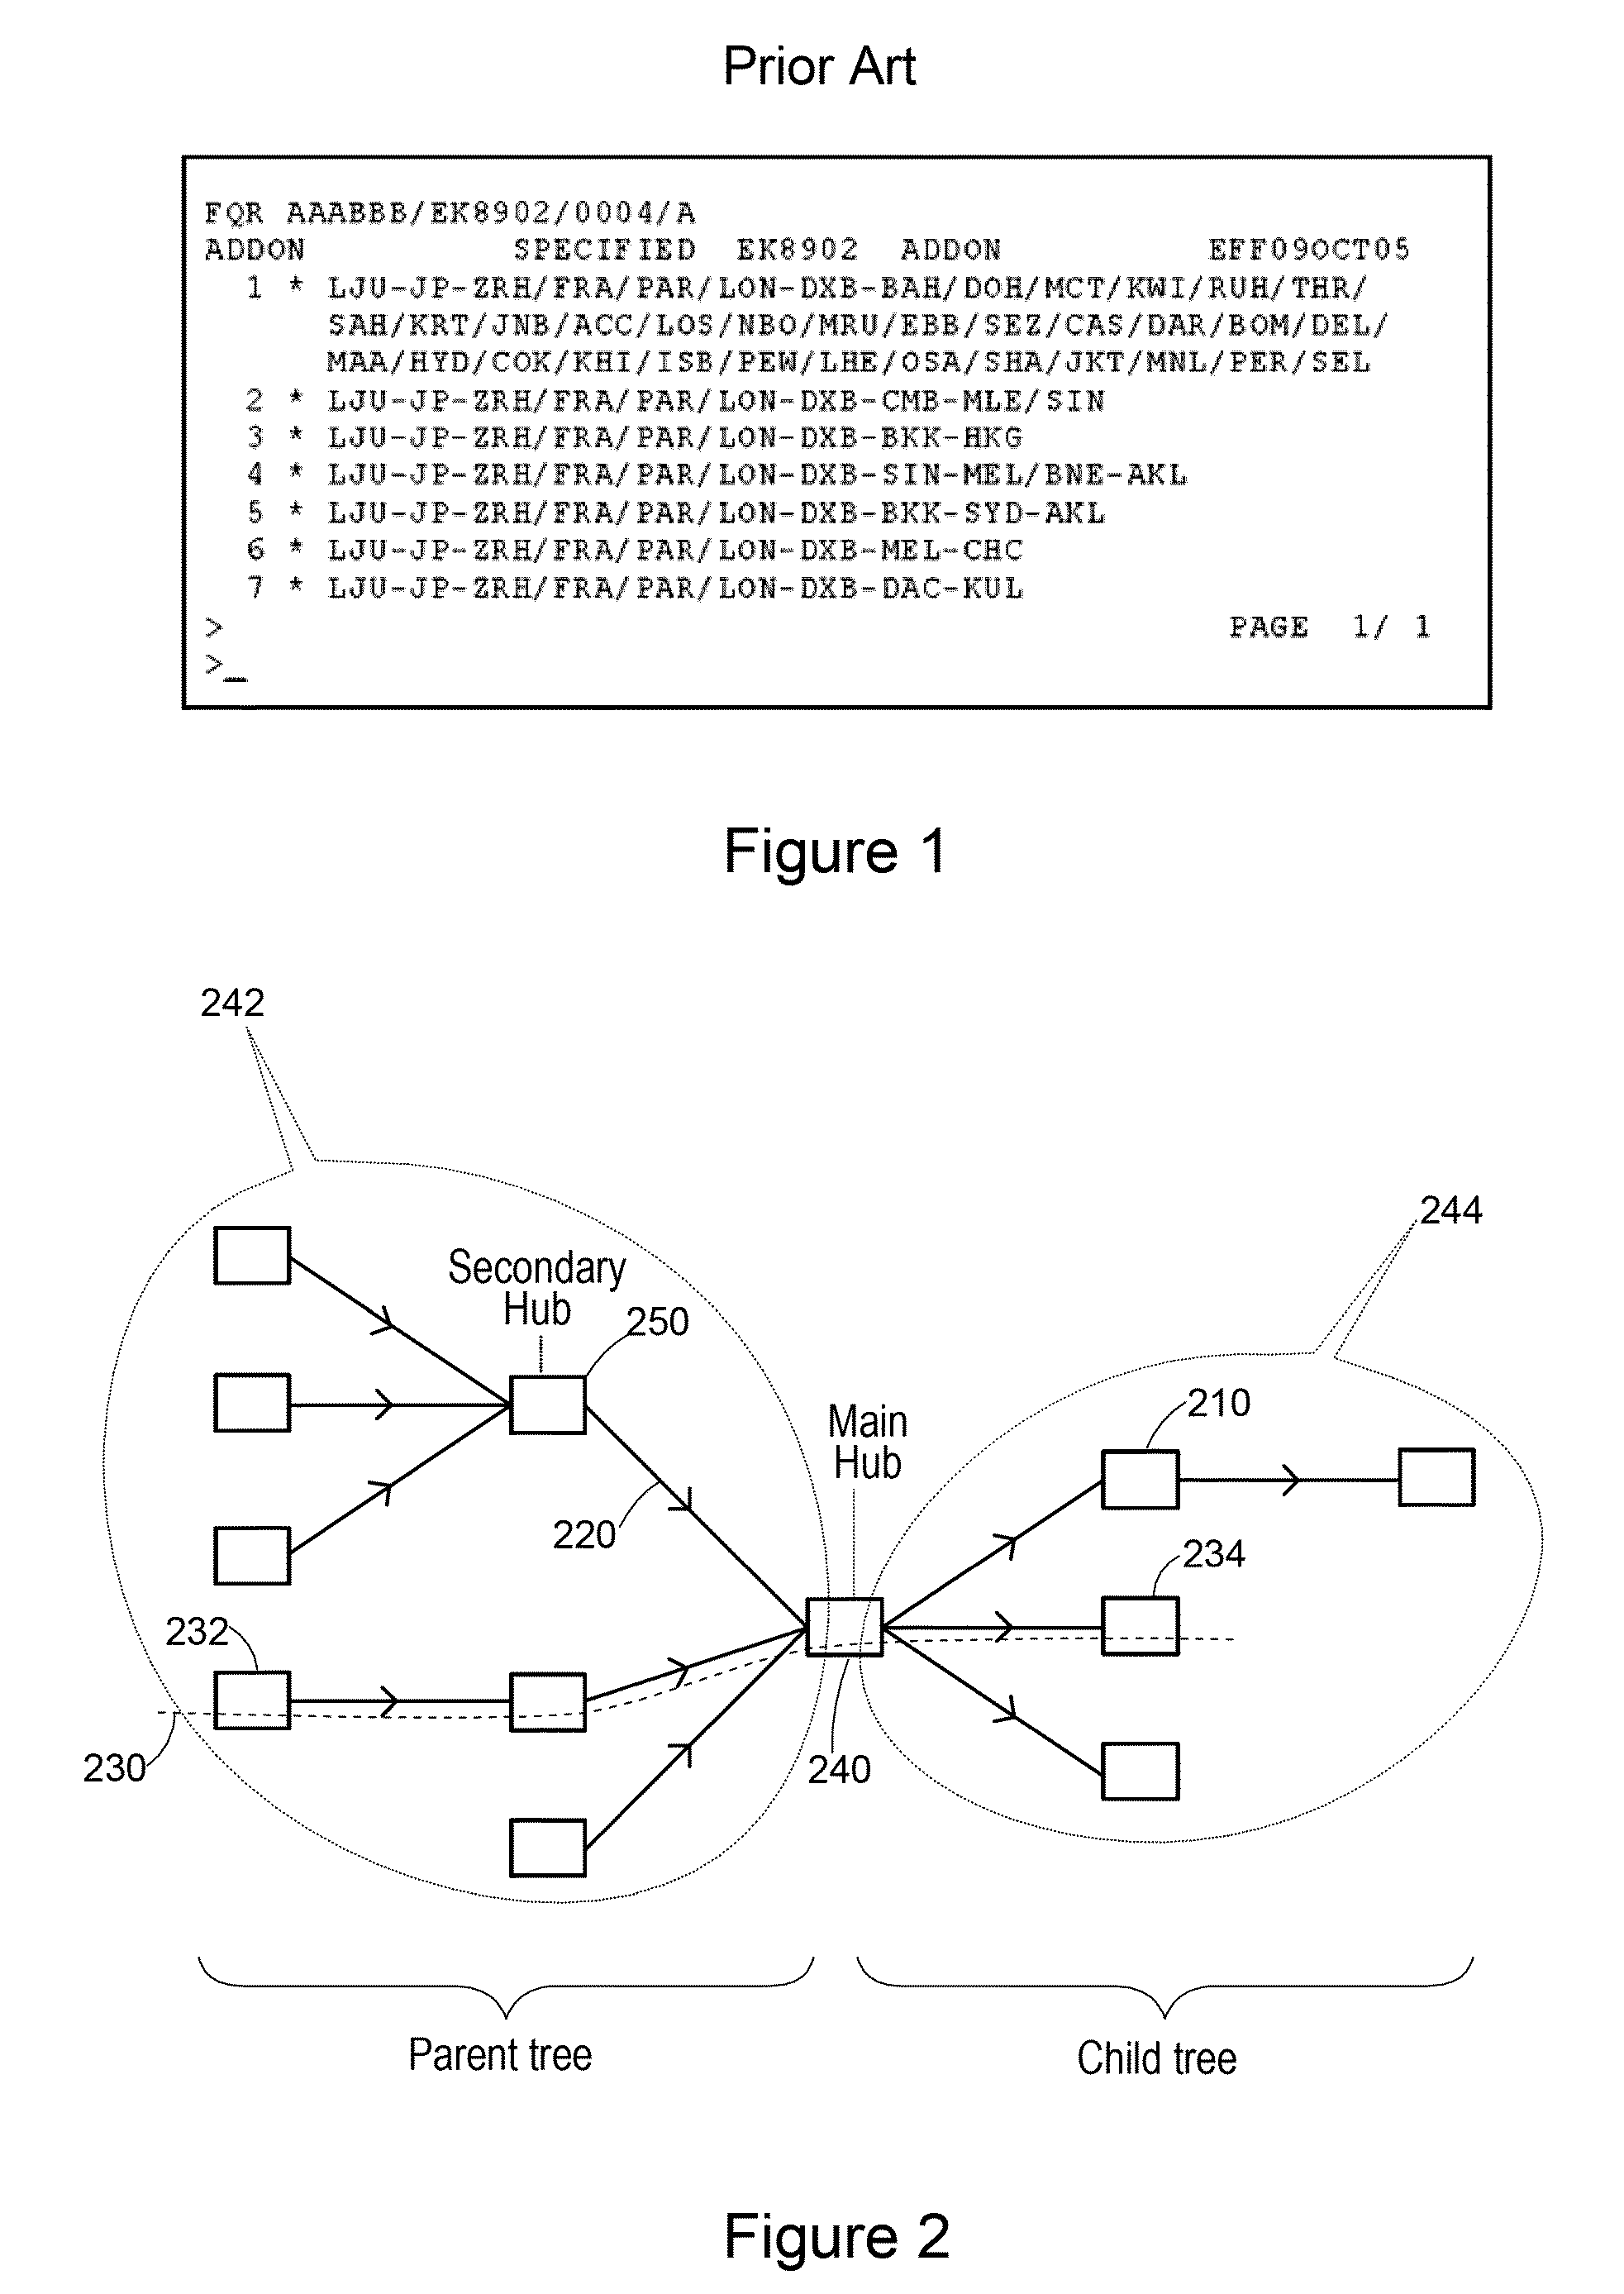
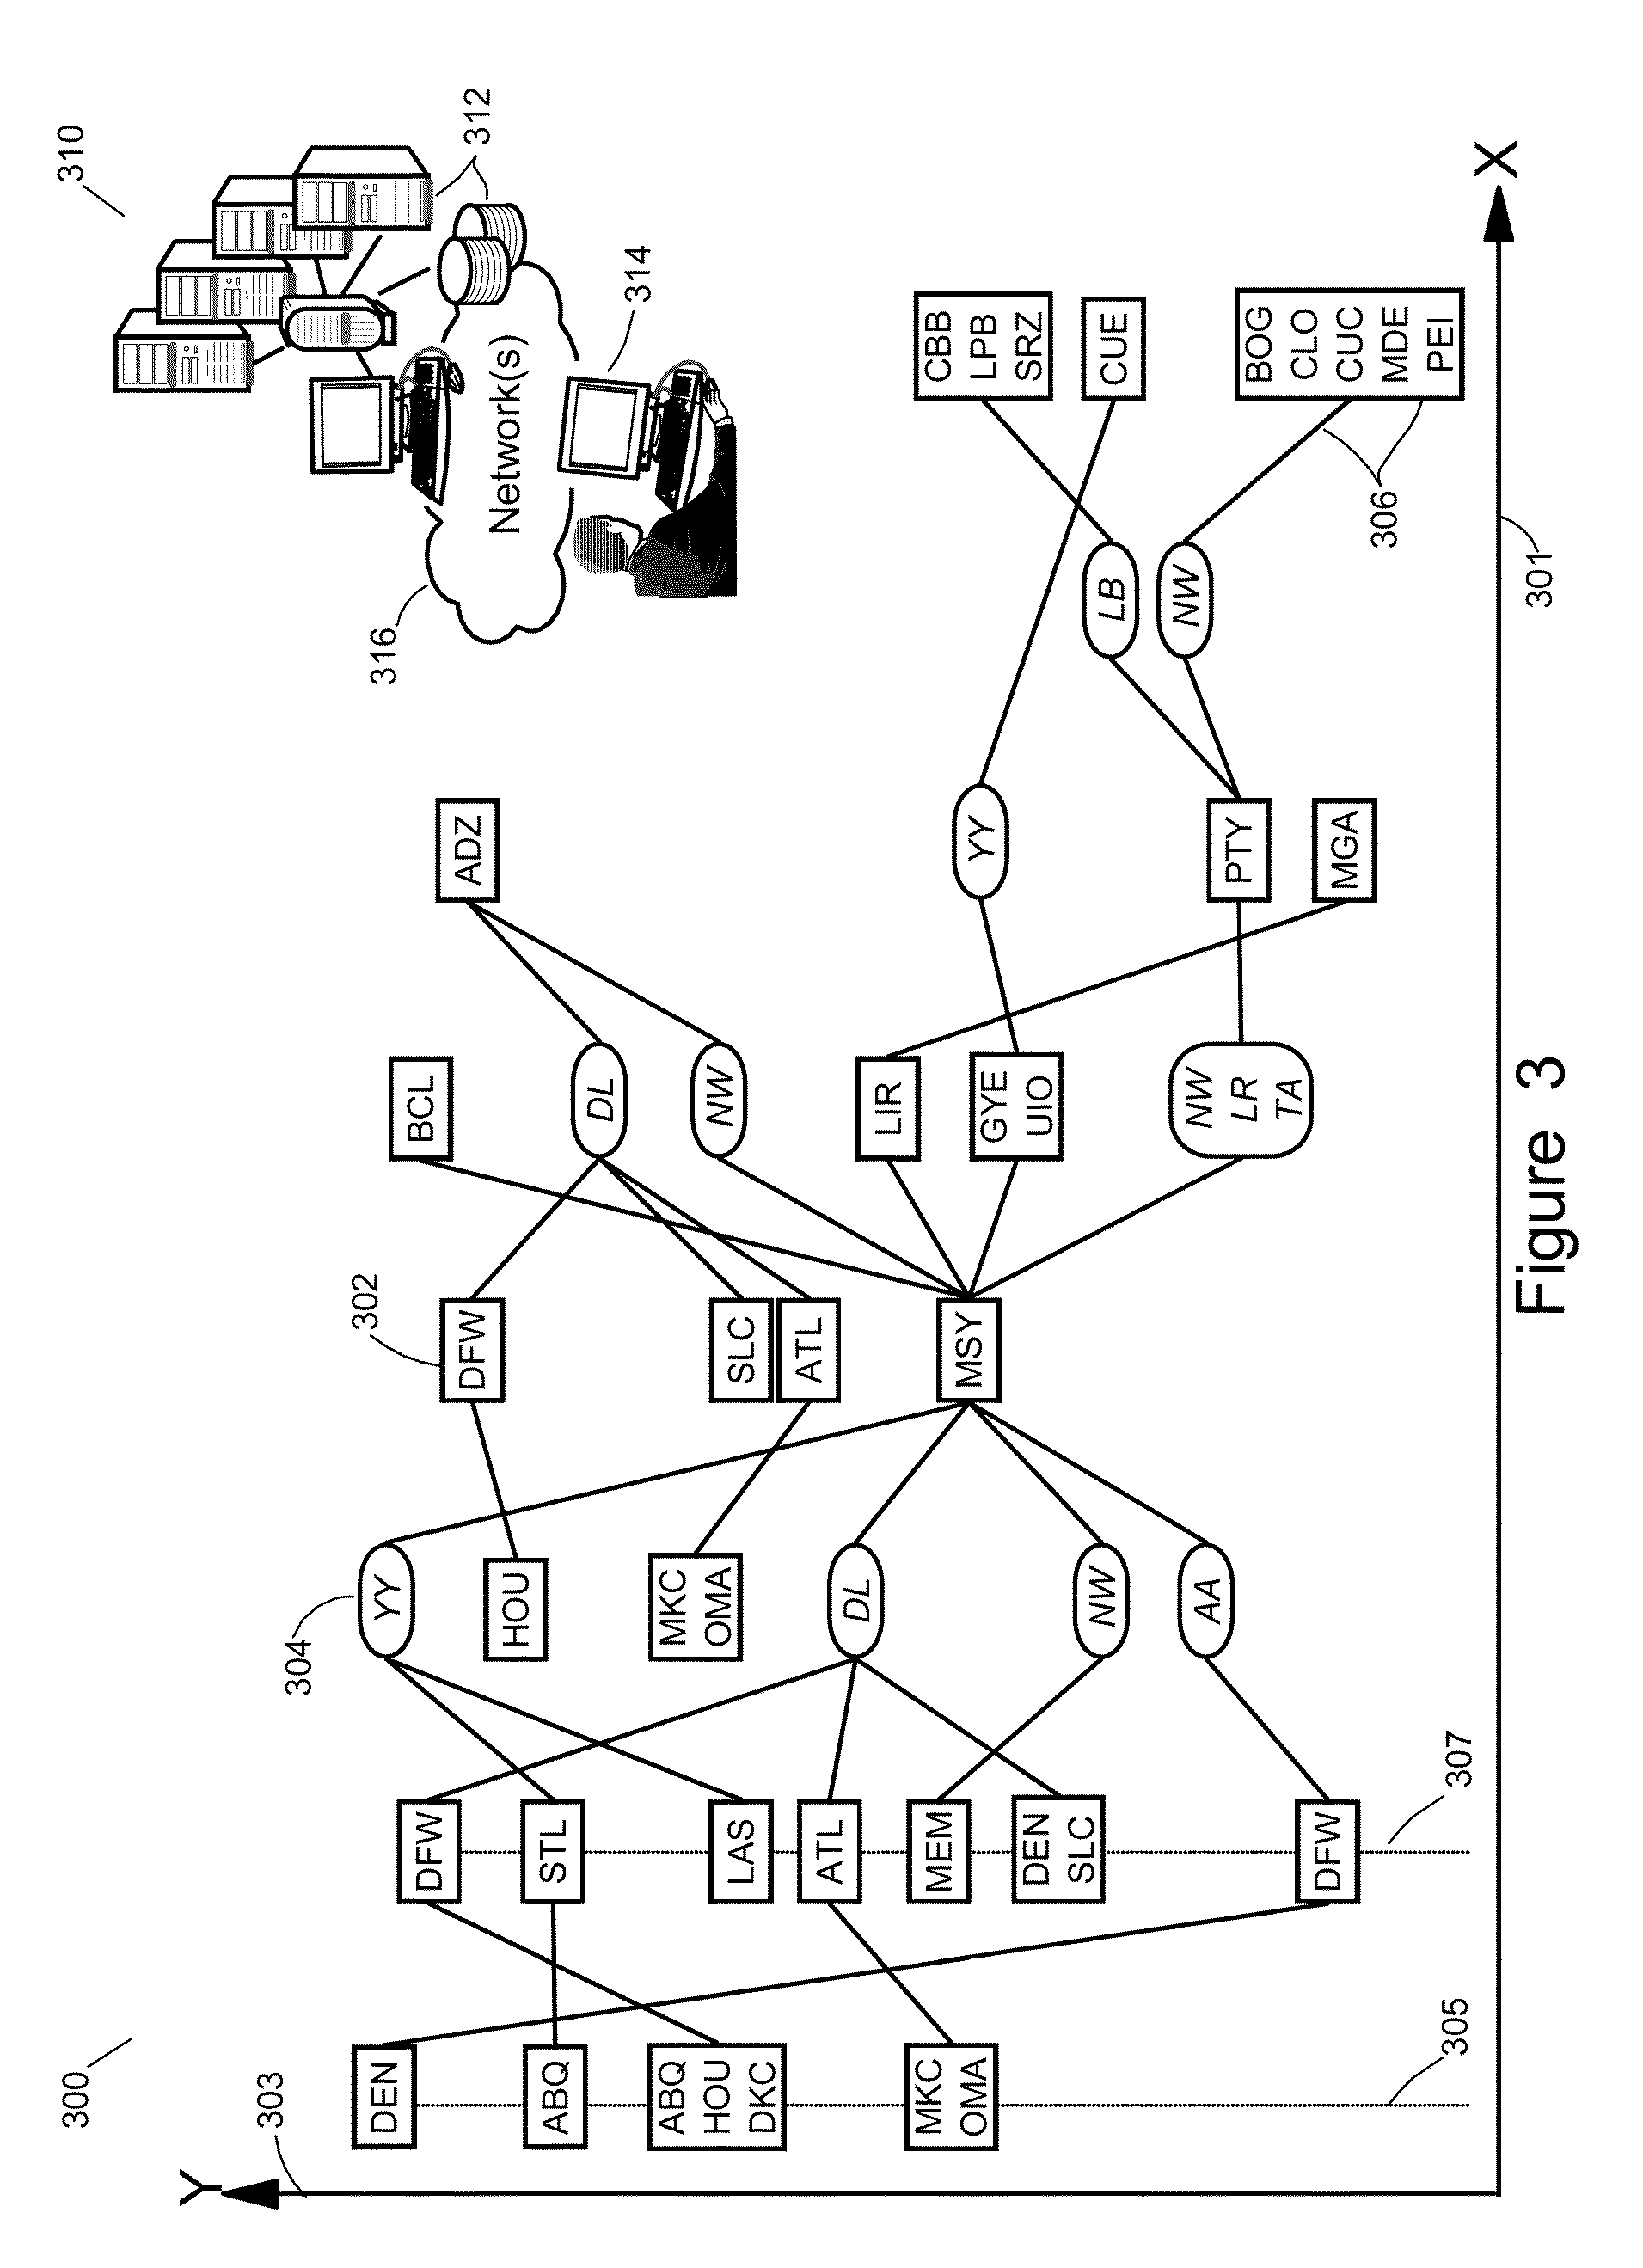
[0035]FIG. 2 shows a graph of airline routes typical of what the invention is aimed at displaying.

[0036]A routing graph is a directed graph, in which nodes are cities, e.g.: 210. The graph edges, i.e., the lines between the nodes, e.g.: 220, indicate which cities are actually connected by scheduled airline flights. A path in the graph, e.g.: 230, includes any combination of connected nodes from any of the entry points on the left, e.g.: 232, to any of the exit points on the right, e.g.: 234. Such a routing graph is assumed to be acyclic, i.e., there is no possible looping path in it. Two kinds of nodes are actually considered for the drawing of the graph: the city nodes mentioned above, and ai...


PUM


Abstract

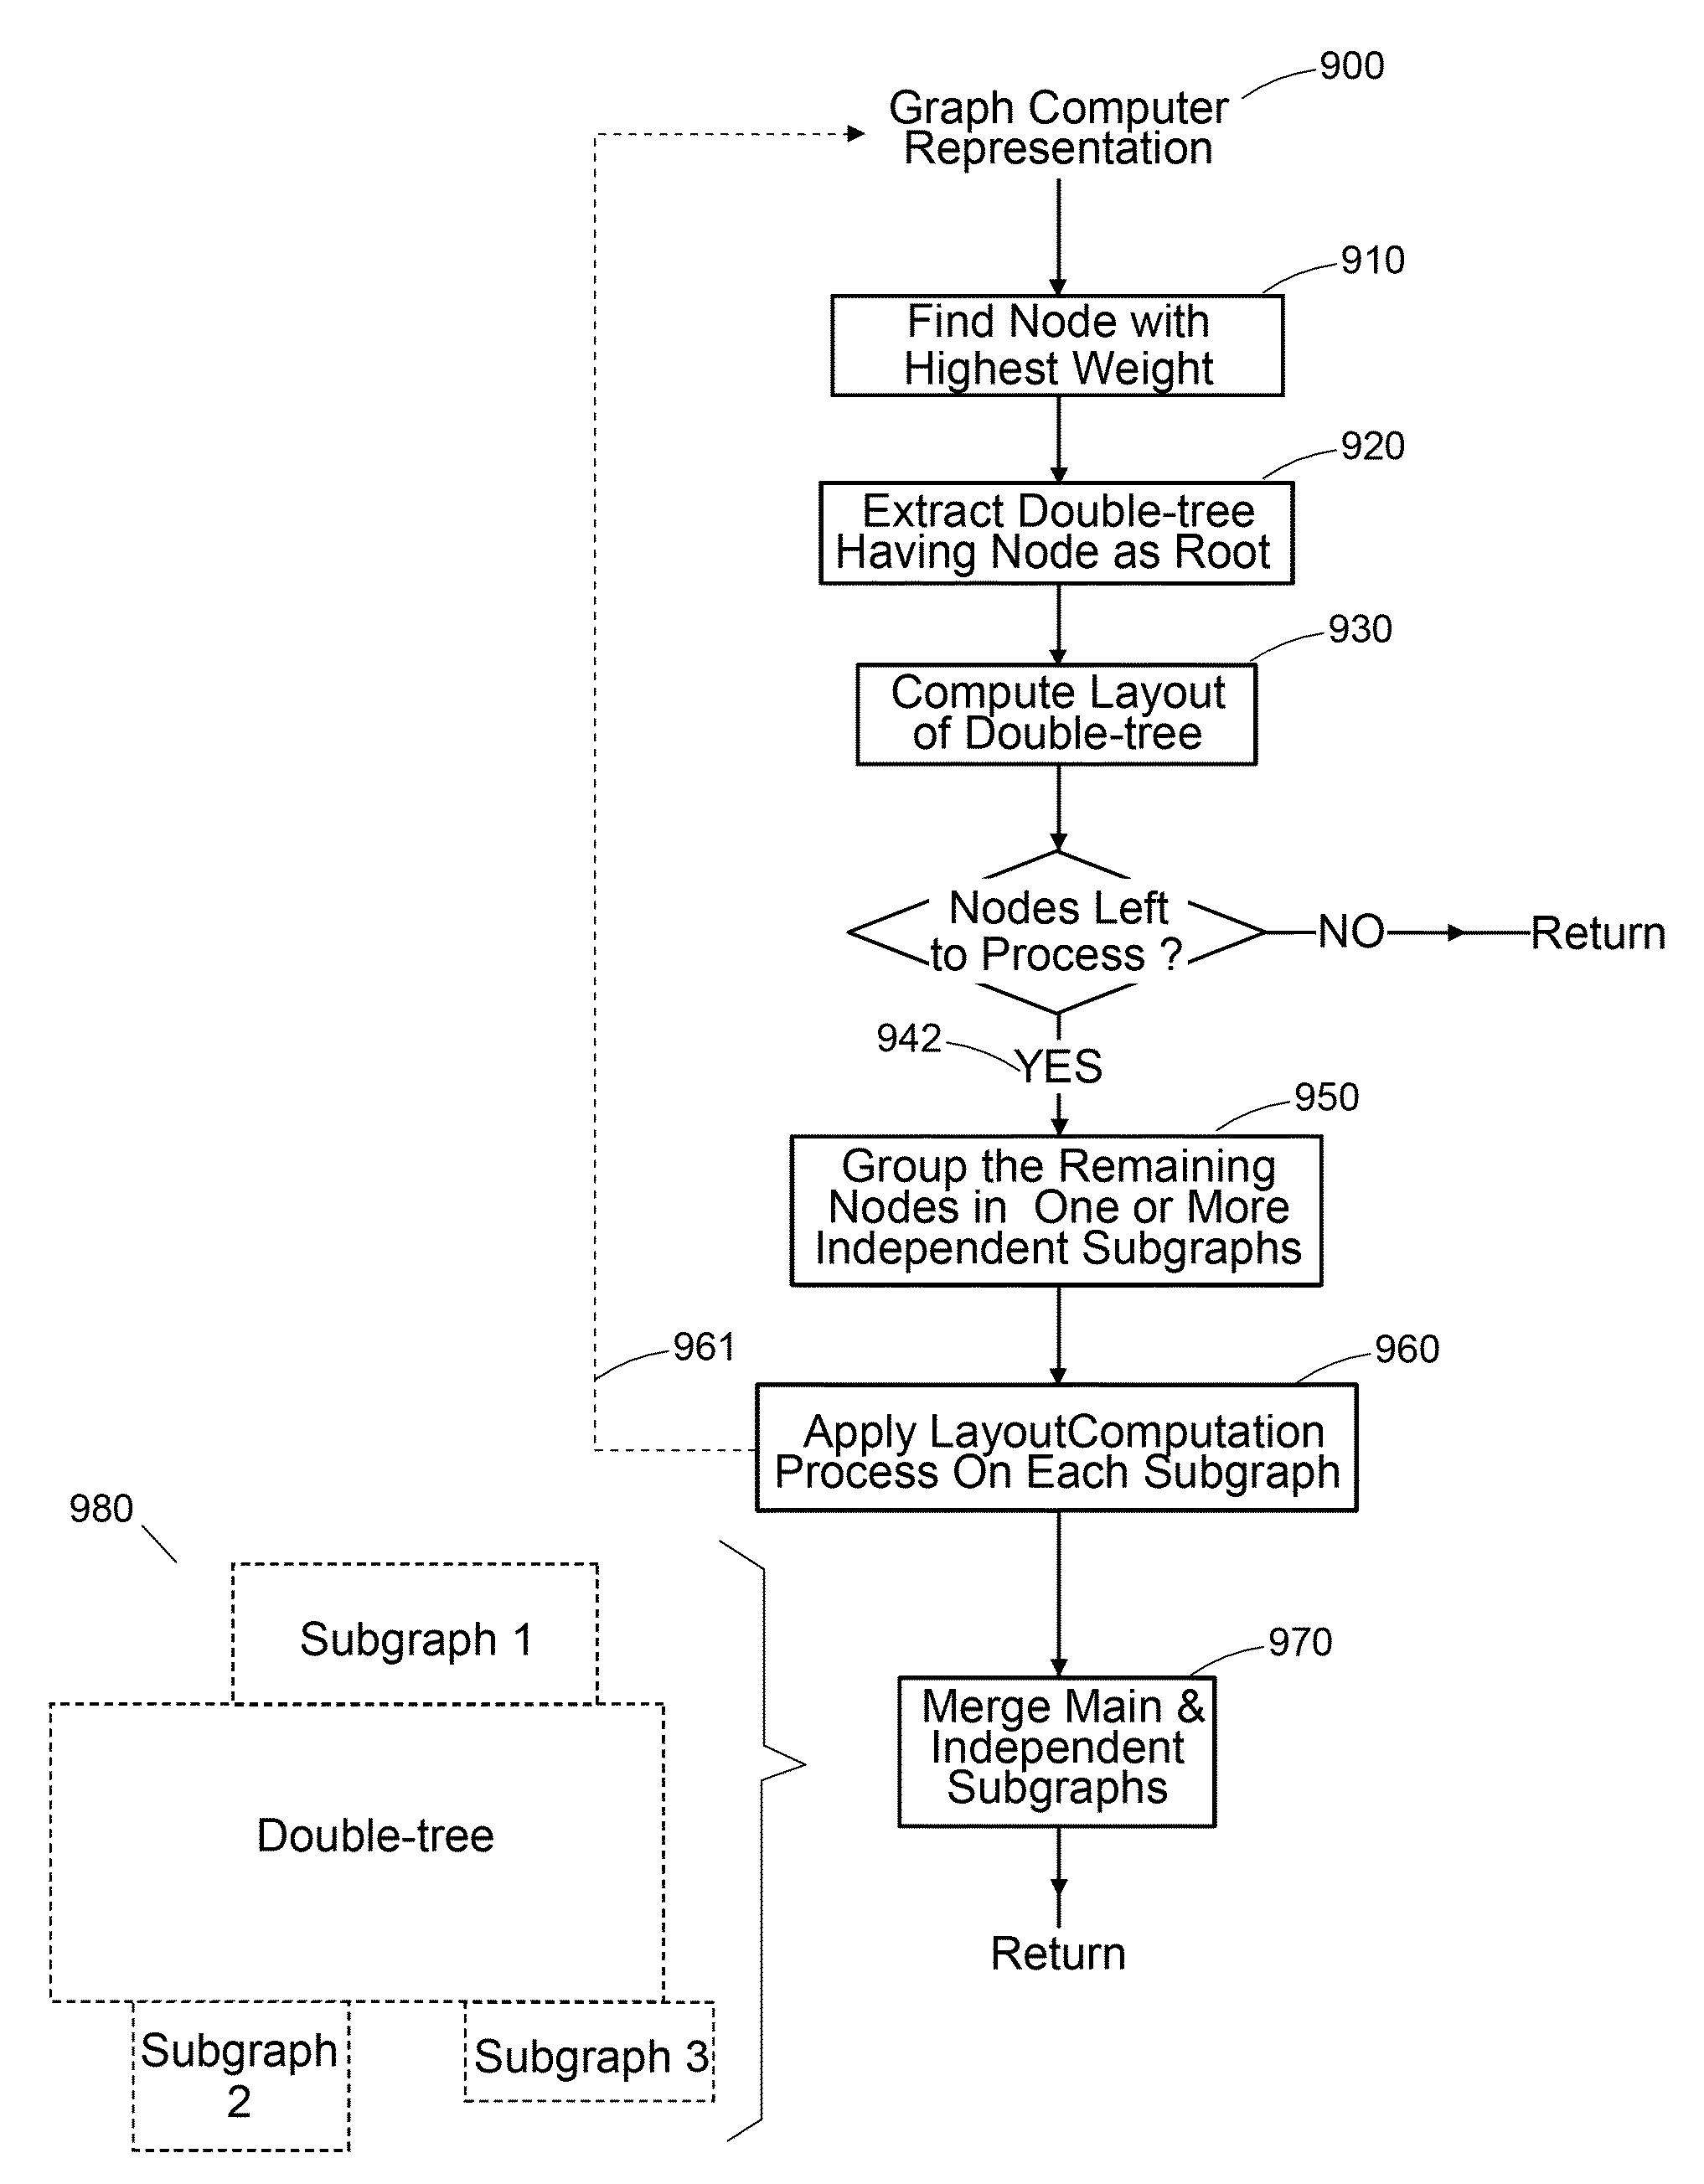
A method of displaying a graph of nodes adapted to the display of travel routes is described. The method includes the steps of finding a node of highest weight among all nodes of the graph after each node is attributed a weight based on a number of nodes pertaining to a double-tree structure of nodes of which each node is assumed to be the root. Then, the double-tree structure of nodes having the node of highest weight as root is extracted and a layout is computed. If there are remaining nodes left, they are grouped in one or more sub-graphs and a layout of the one or more sub-graphs is iteratively computed. The one or more sub-graphs are then merged with the double-tree structure of nodes to be displayed.

Description

FIELD OF THE INVENTION[0001]The present invention relates generally to the layout of graphs, and more specifically, to an automated method adapted to obtain easy-to-read display of airline routes between cities, method which is not computation intensive.BACKGROUND OF THE INVENTION[0002]Due to its large scope of potential applications the automation of the drawing of two-dimensional graphs has received a considerable attention over the past decades, resulting in the publication of a countless number of papers by the engineering and academic communities describing methods and techniques to draw graphs, often for a particular context. Nevertheless, the drawing of graphs in the general case remains a very hard problem for which a single best solution does not exist. Typical of the publications made on this subject is a paper by Gansner and al. from AT&T Bell Laboratories, untitled: A Technique for Drawing Directed Graphs', published in 1993 in IEEE Transactions on Software Engineering, ...

Claims


Application Information

Patent Timeline
Patent Type & Authority Applications(United States)
IPC IPC(8): G06T11/20G06F3/048G06Q10/00G06Q50/00
CPCG06Q10/047G06Q50/30G06Q50/14G06Q50/40
Inventor PASQUALI, JEANKARPP, ROBERT
Owner AMADEUS S
Learn More