System for managing business performance using industry business architecture models

a business architecture and management system technology, applied in the field of enterprise architectures, can solve the problems that neither technique spans the entire life cycle, and achieve the effect of managing business performance, maintaining the ongoing health and growth of the enterpris

Inactive Publication Date: 2011-06-09
IBM CORP
View PDF65 Cites 11 Cited by
  • Summary
  • Abstract
  • Description
  • Claims
  • Application Information

AI Technical Summary

Benefits of technology

[0008]Managing the business performance of a large enterprise is important to maintaining the ongoing health and growth of the enterprise. The management must be performed over an entire life cycle of a typical enterprise in an industry. The balanced scorecard and benchmarking are known techniques used in this area but both have known drawbacks. The balanced scorecard teaches how to select performance measures. Benchmarking helps identify what performance measures can be improved based on peer performance. However, neither technique spans the entire life cycle of selecting performance indicators, to monitoring, to identifying opportunities, to developing solutions, and feedback to selecting new performance indicators. The present invention overcomes this limitation by providing a system and dashboard for managing business performance throughout this life cycle in the manner as will be described below.

Problems solved by technology

However, neither technique spans the entire life cycle of selecting performance indicators, to monitoring, to identifying opportunities, to developing solutions, and feedback to selecting new performance indicators.

Method used


Image

  • System for managing business performance using industry business architecture models
  • System for managing business performance using industry business architecture models
  • System for managing business performance using industry business architecture models

Examples


Embodiment Construction

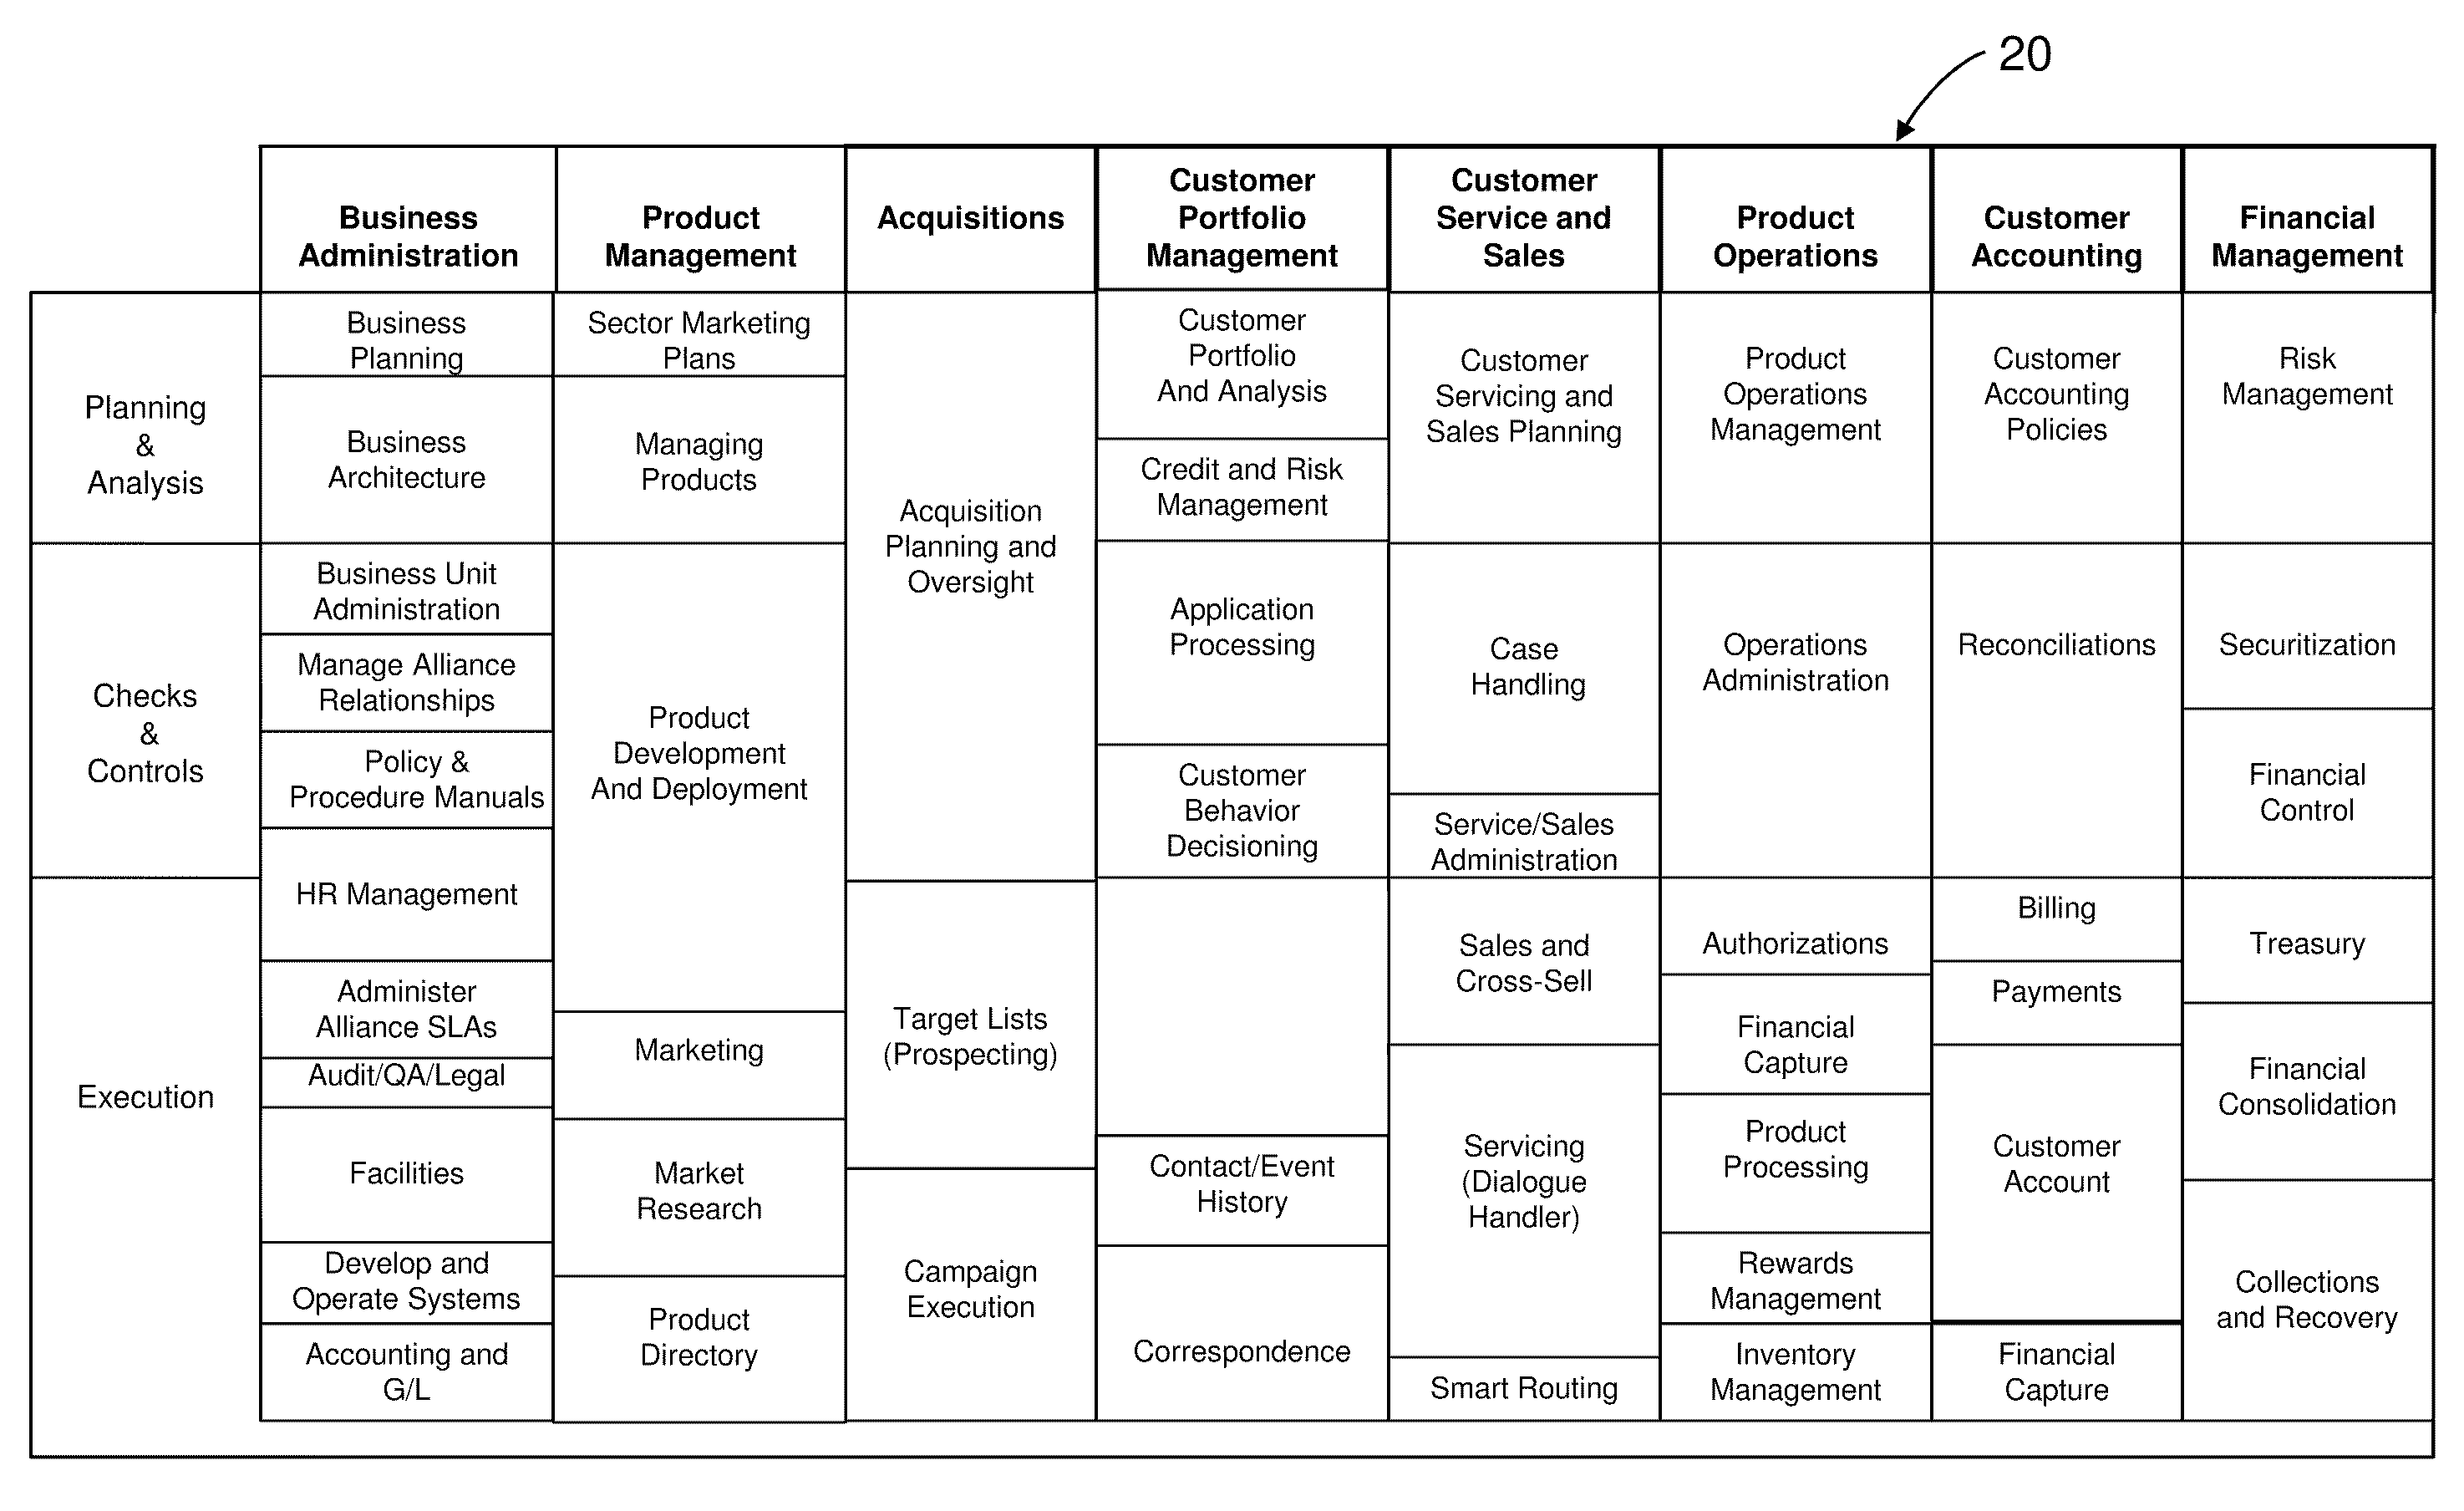
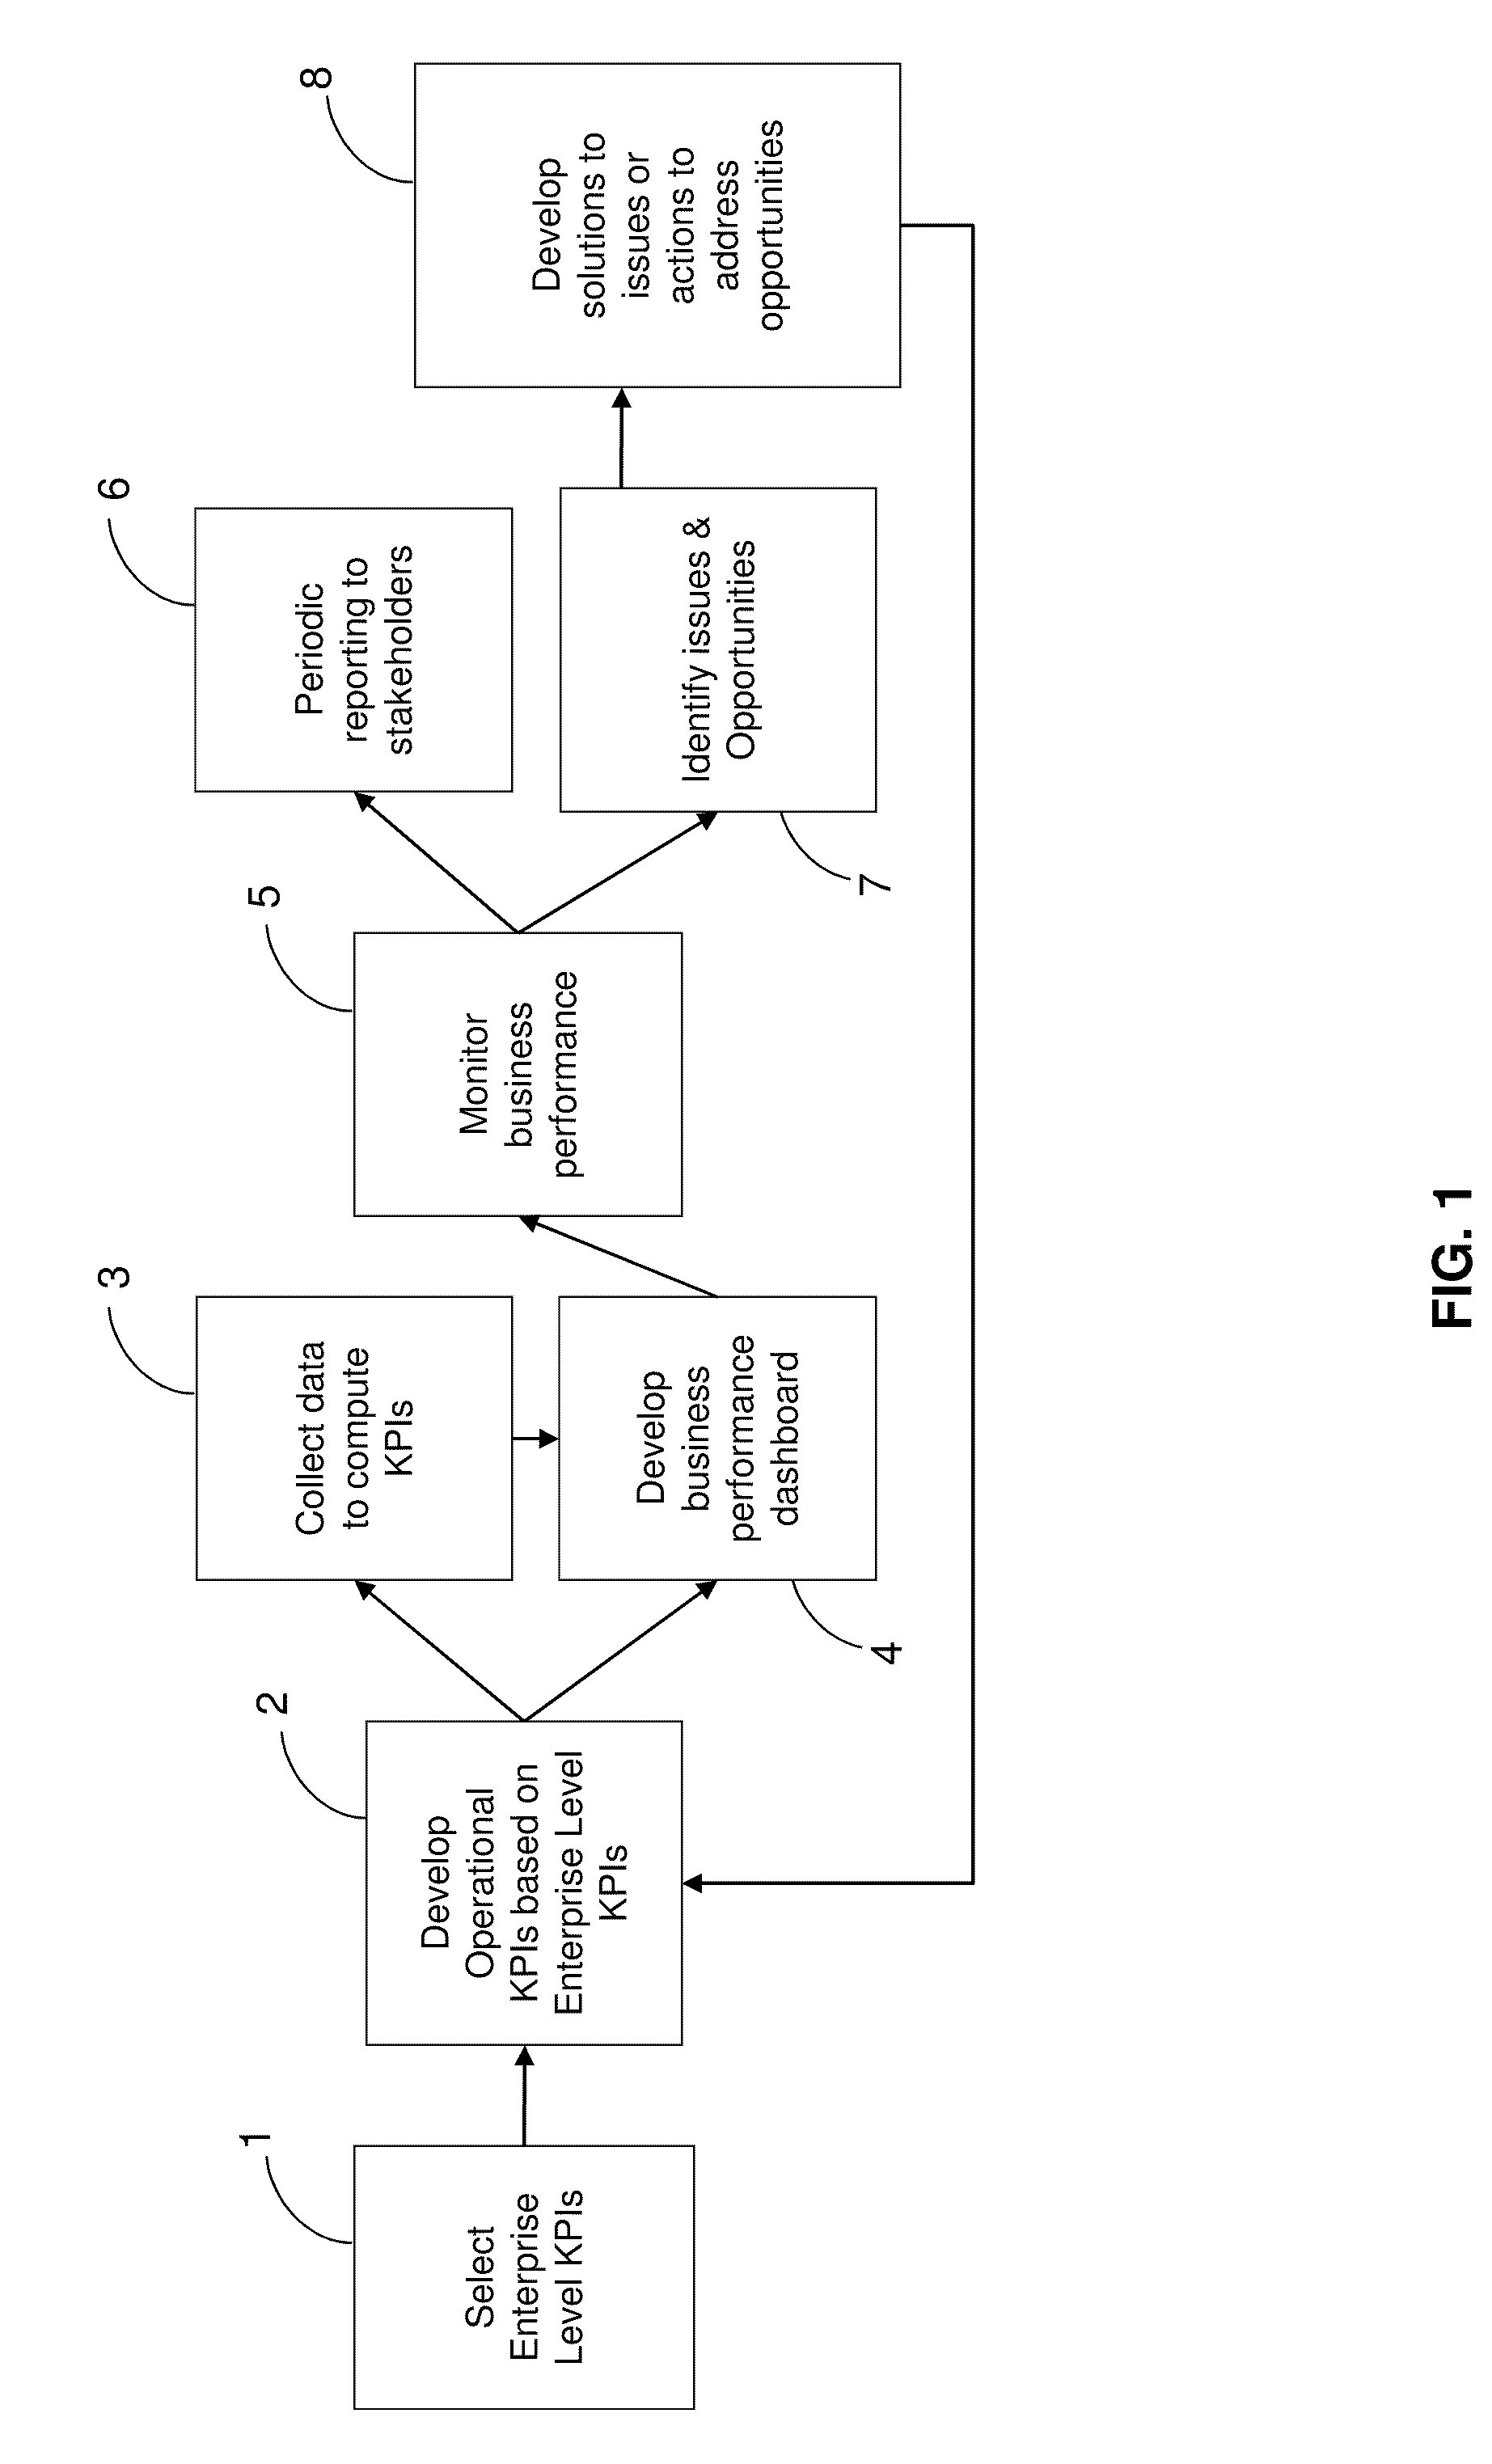
[0013]In FIG. 1 there is shown a lifecycle flowchart of business performance management in accordance with the present invention. A component business model map such as described below and shown in FIG. 3 has been previously generated. The techniques of generation are described in application Ser. No. 10 / 796,367. In step 1 of FIG. 1, Enterprise level key performance indicators (KPIs) are selected.

[0014]Key performance indicators, also known as key success indicators or key business indicators are used by businesses to define and measure progress toward their goals. As used herein, KPIs represent quantifiable, measurable objectives, agreed to beforehand, that reflect the critical success factors of an organization. KPIs differ depending on an industry or organization. A sales organization may use the percentage of its sales that come from return customers. A customer service organization may measure the number of customer service calls answered in less than one minute. To determine i...


PUM


Abstract

A system and dashboard are provided for managing business performance. Key performance indicators developed for a component business model map are computed and displayed along with the map in real time. A user may select a corresponding key performance indicator to display a heat map of components on the dashboard.

Description

CROSS REFERENCE TO RELATED APPLICATIONS[0001]The present invention is related to U.S. application Ser. No. 10 / 796,367 filed Mar. 9, 2004 titled SERVICES COMPONENT BUSINESS OPERATION METHOD which is incorporated herein in its entirety. This application is also related to U.S. application Ser. No. ______ filed ______ entitled TOOL FOR CREATING AN INDUSTRY BUSINESS ARCHITECTURE MODEL, and U.S. application Ser. No. ______ filed ______ entitled ASSESSING THE MATURITY OF AN INDUSTRY ARCHITECTURE MODEL which are incorporated herein by reference in its entirety.BACKGROUND OF THE INVENTION[0002]1. Field of the Invention[0003]The invention relates generally to enterprise architectures. More particularly, the invention relates to a system for managing business performance using an industry business architecture model including but not limited to a component business model.[0004]2. Description of Related Art[0005]Rackham in U.S. application Ser. No. 10 / 796,367 describes the component business m...

Claims


Application Information

Patent Timeline
Patent Type & Authority Applications(United States)
IPC IPC(8): G06Q10/00
CPCG06Q10/00G06Q10/067G06Q10/06393
Inventor BHANDARI, MUTHULAKSHMIBOTROS, ALLISON BAINESGIESEN, EDWARD H BHARISHANKAR, RAMANLEUNG, YING TATMUNGI, ASHISHPUROHIT, SIDDHARTH N.SANZ, JORGE L. C.
Owner IBM CORP
Why Eureka
Try Eureka