
Displaying a visualization of event instances and common event sequences

a visualization and event technology, applied in the field of display of a visualization of an event log, can solve the problem of difficult understanding of the logs

Inactive Publication Date: 2011-09-22
IBM CORP
View PDF7 Cites 50 Cited by
  • Summary
  • Abstract
  • Description
  • Claims
  • Application Information

AI Technical Summary

Benefits of technology

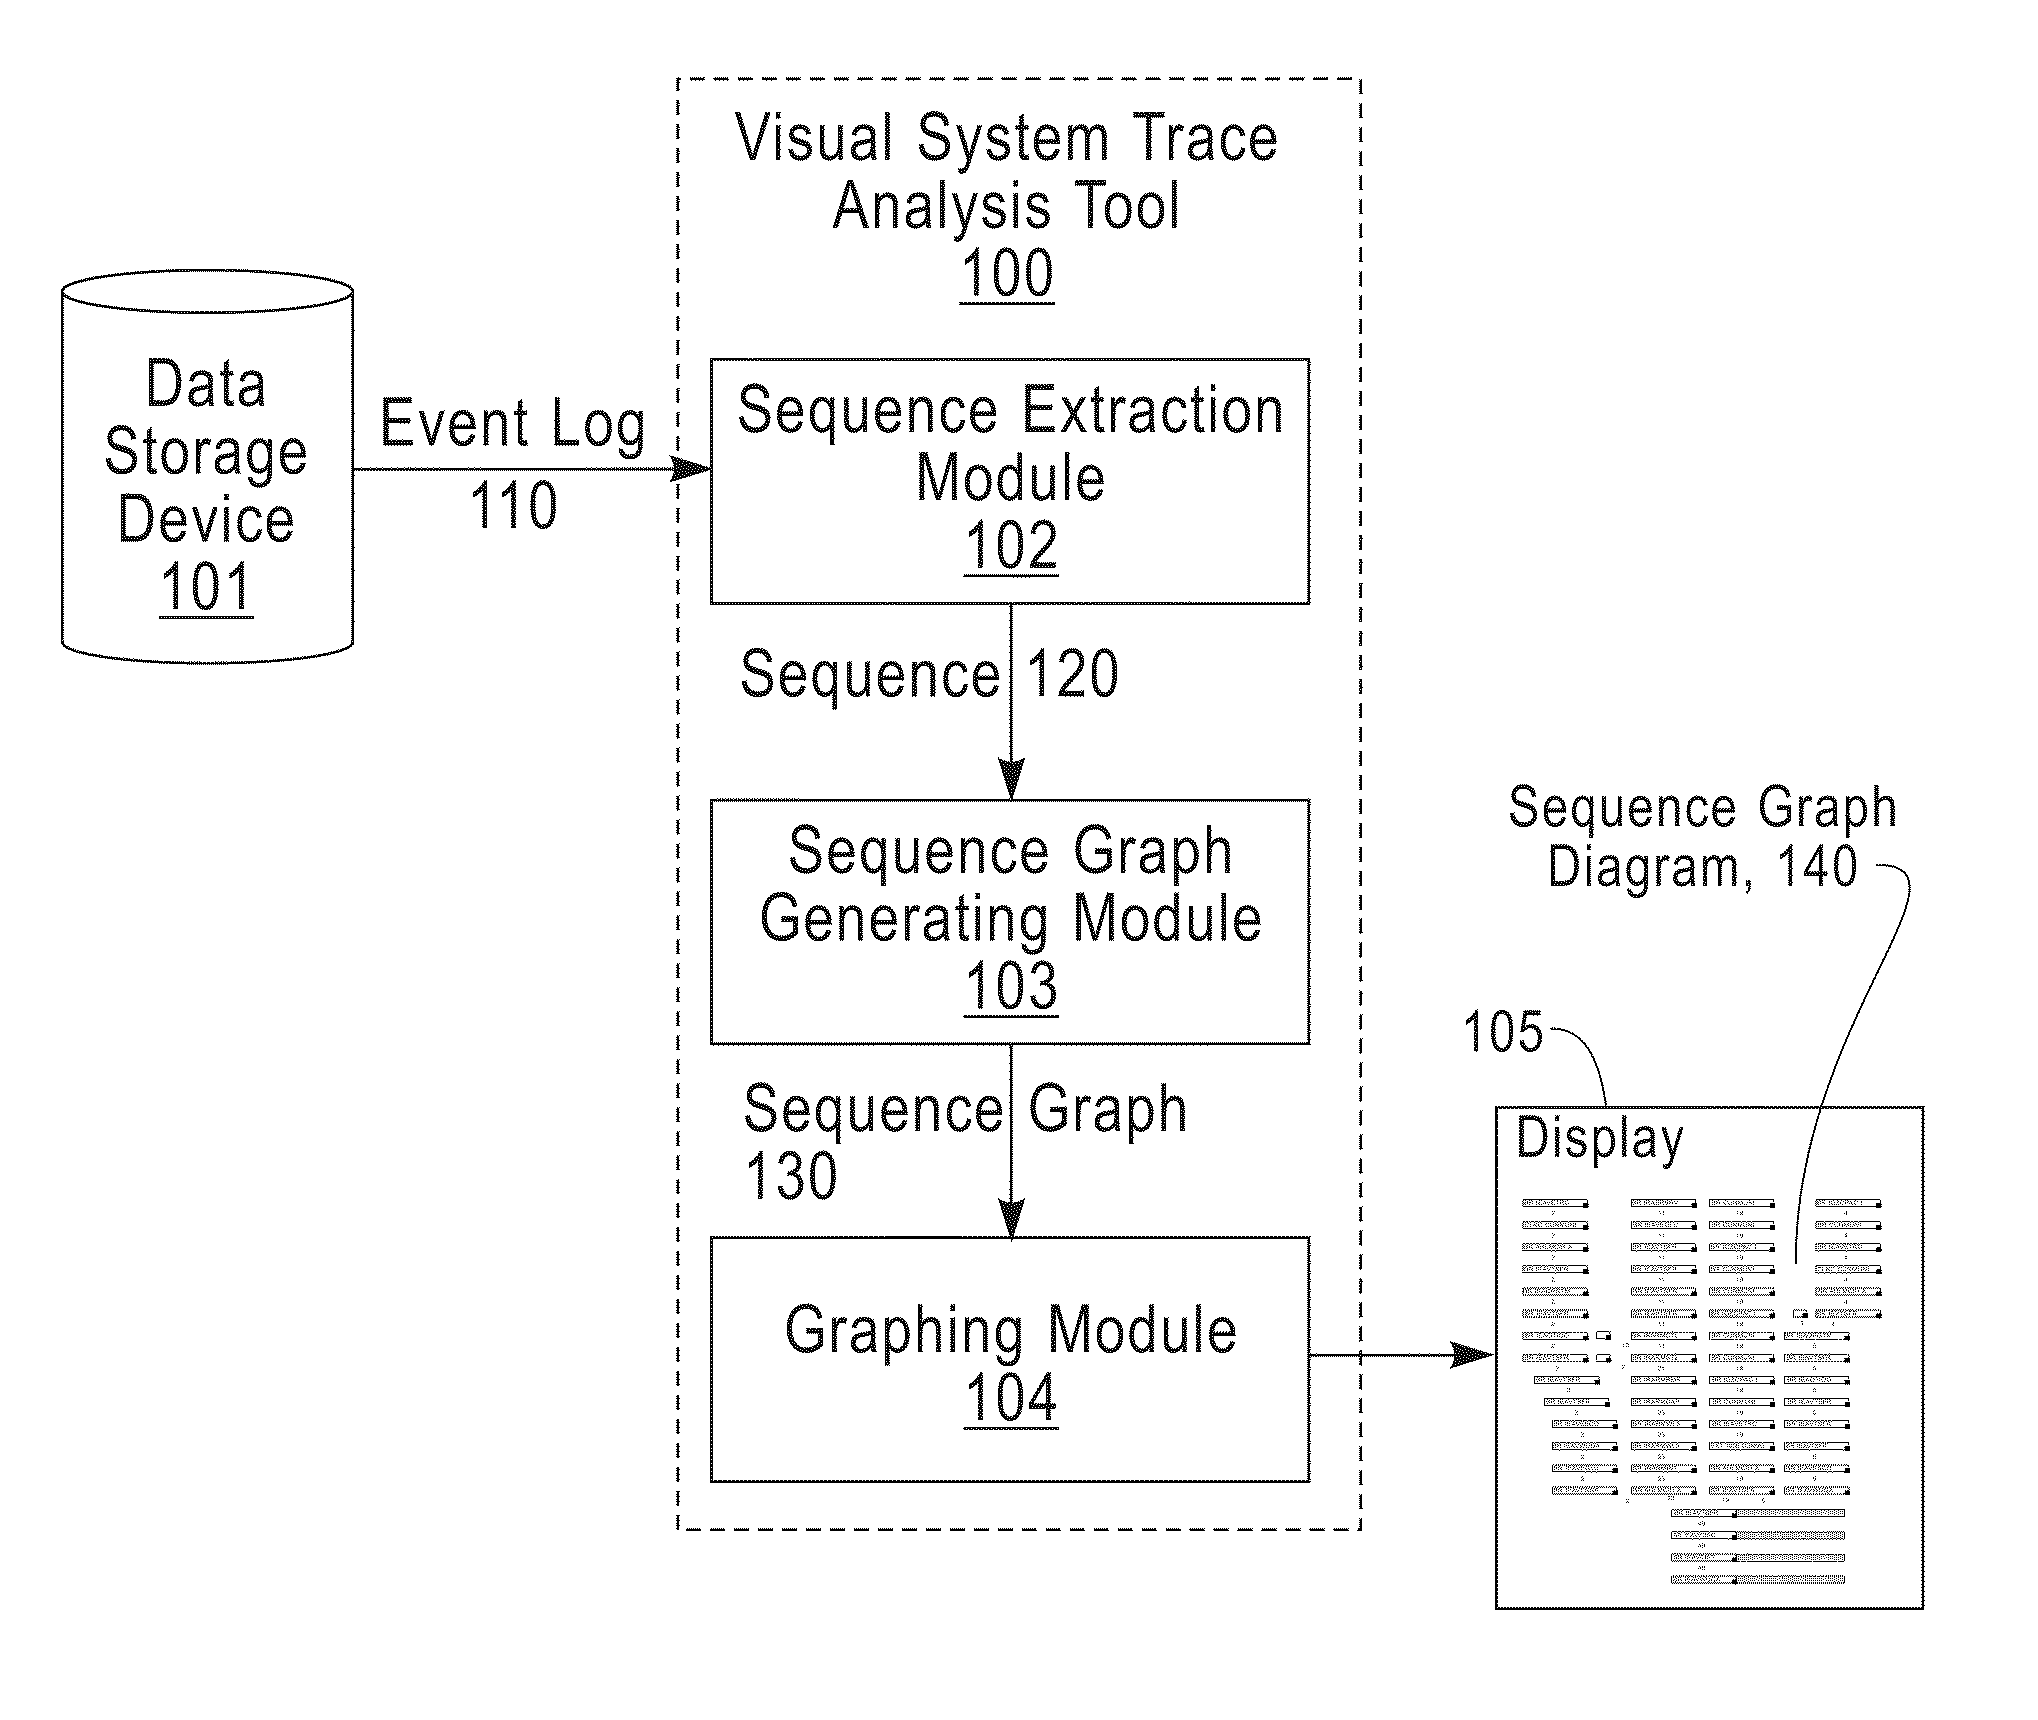
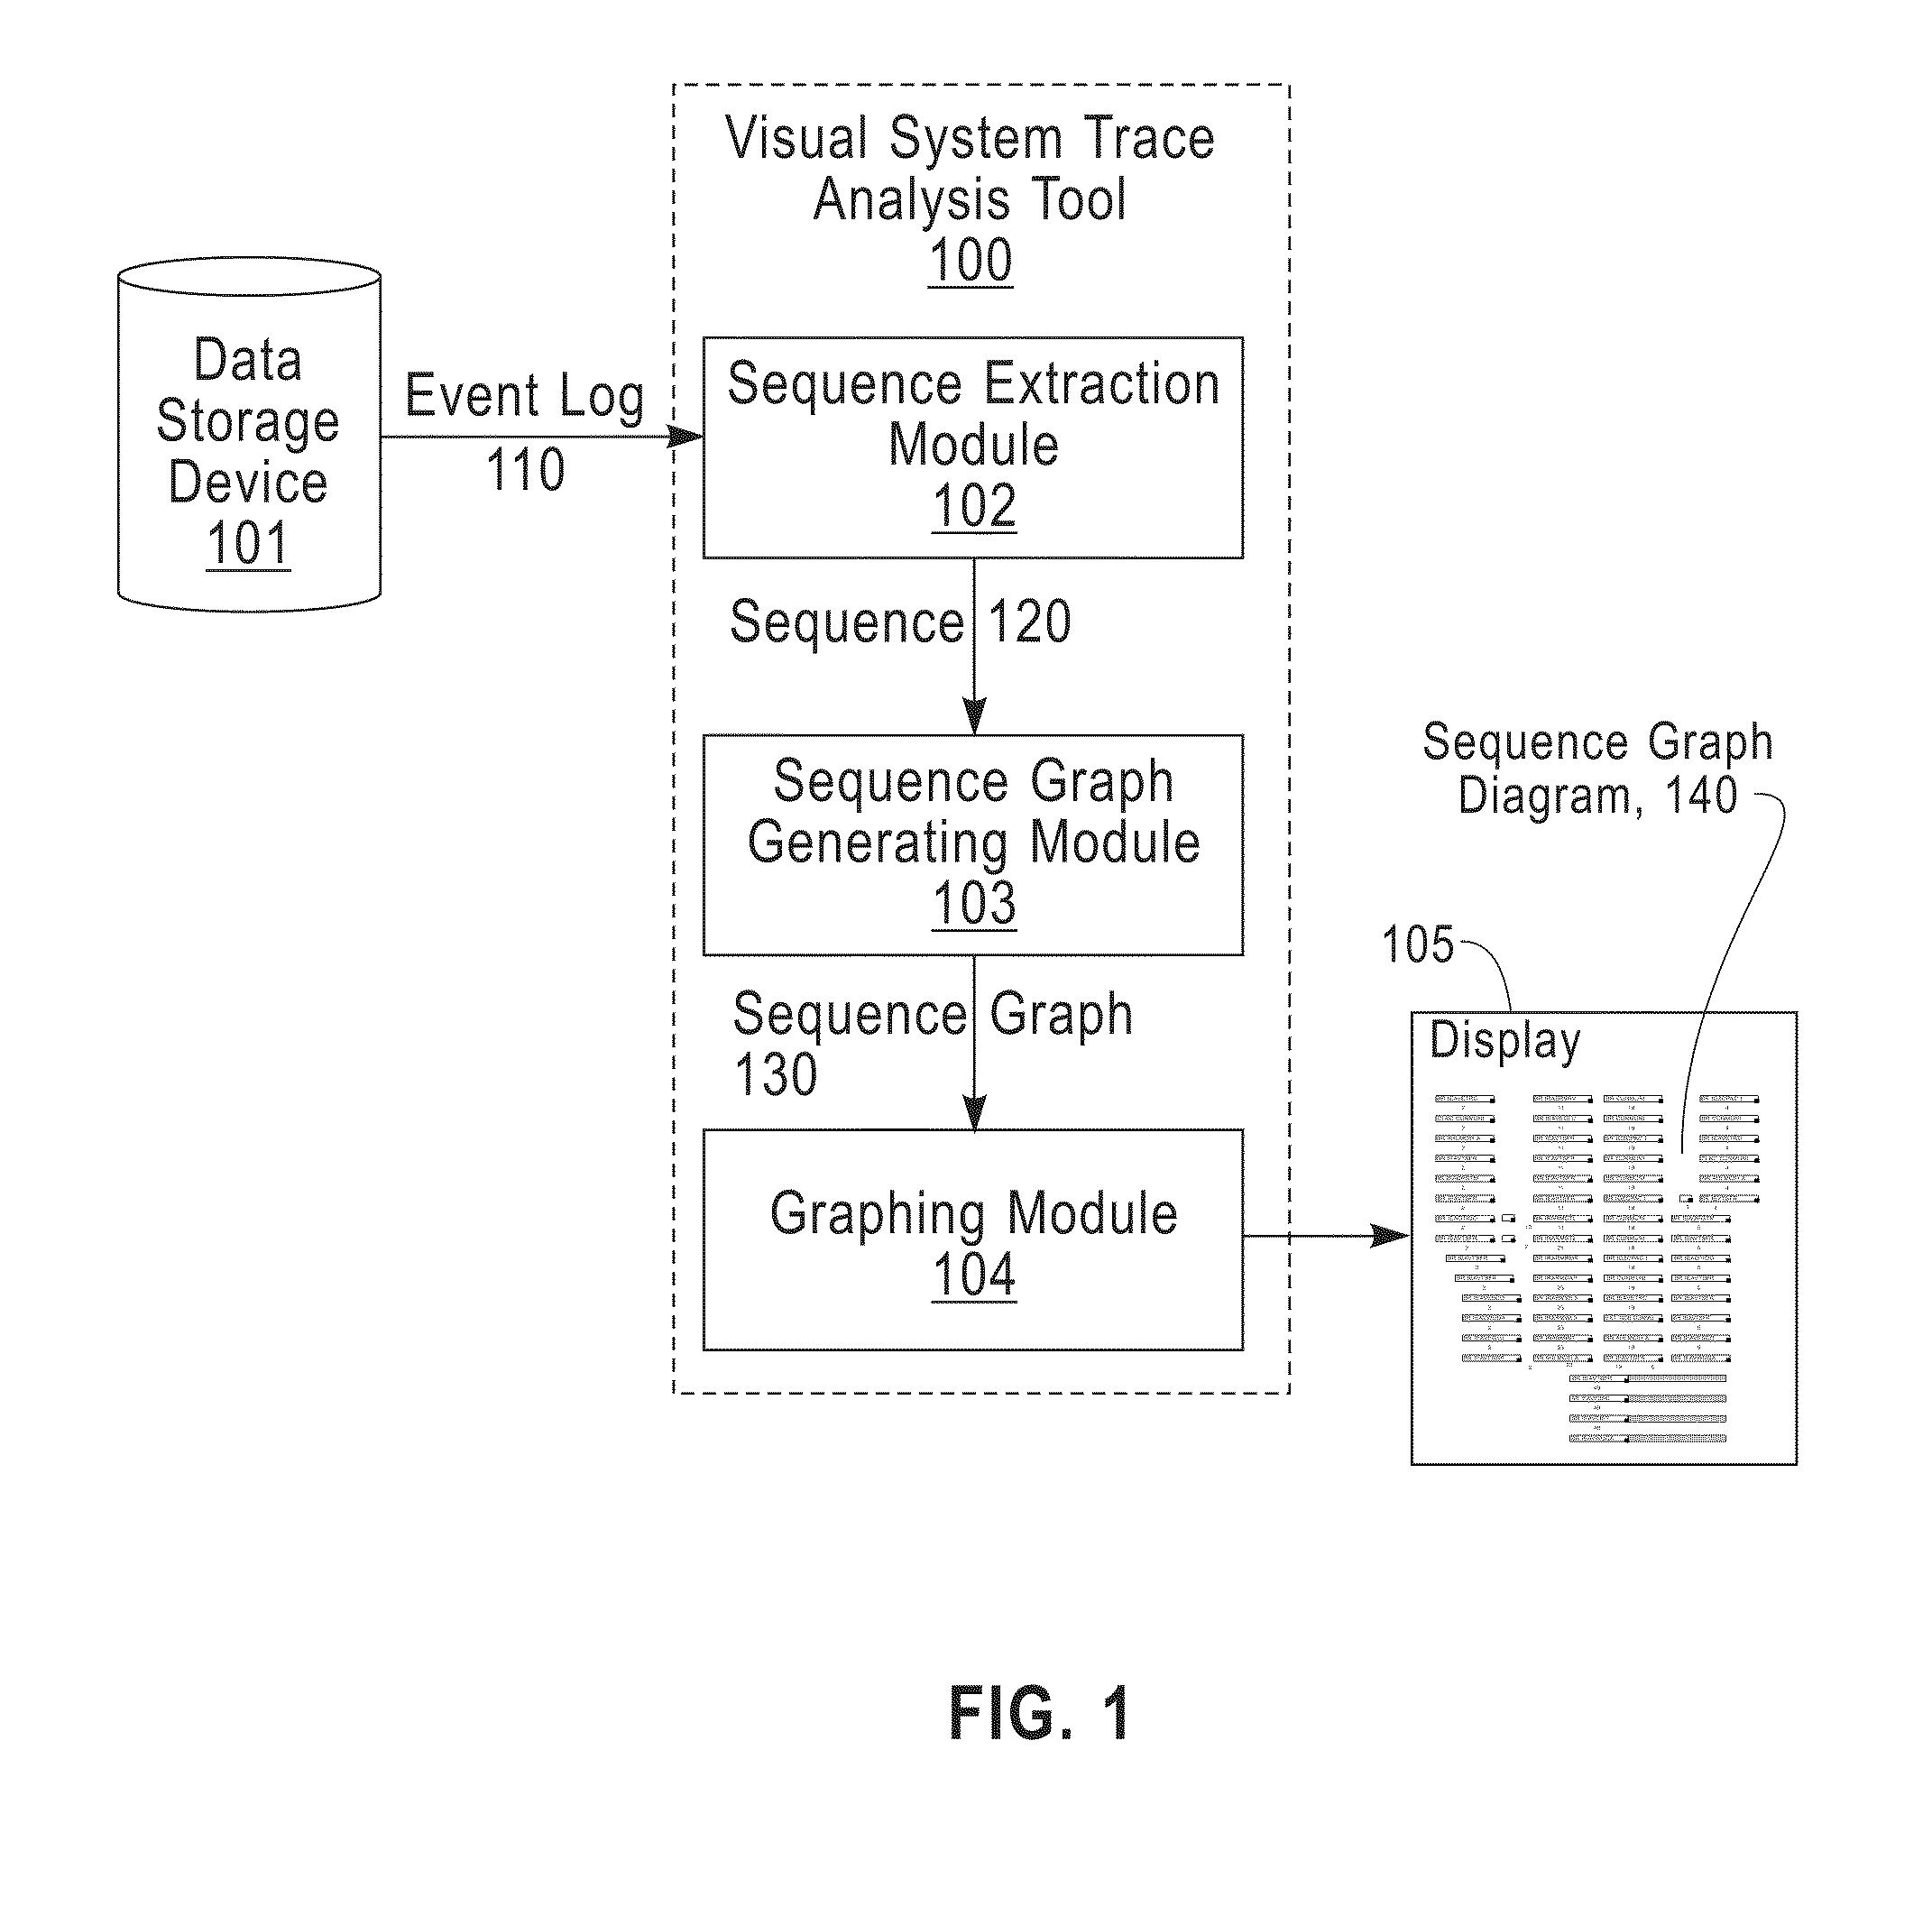
[0005]In another embodiment, the present invention provides a system for displaying a visualization from an event log. A data storage device may store the event log, wherein the event log is a record of a plurality of events that occurred in a system. A sequence extraction processing module may extract sequences from the event log. A sequence graph generating module may generate a sequence graph from the sequences, based on common features of the sequences, wherein the sequence graph includes nodes representing one or more of the events of the event log. A graphing module may create a sequence graph visualization from the sequence graph, wherein the sequence graph visualization includes (i) node icons representing the nodes of the sequence graph, (ii) node transition icons representing transitions between nodes, and (iii) for at least one of the nodes, an event icon associated with that node for each of the one or more events that are represented by that node. A displaying device may display the sequence graph visualization.

Problems solved by technology

These “event logs” or “trace logs” can become so large that understanding the logs becomes very difficult.

Method used


Image

  • Displaying a visualization of event instances and common event sequences
  • Displaying a visualization of event instances and common event sequences
  • Displaying a visualization of event instances and common event sequences

Examples


Embodiment Construction

[0015]Embodiments of the present invention may be used to display a visualization from an event log showing common patterns, instances of events, and transitions between events. A visualization is a visual representation of information or data, such as a diagram that is output to a computer display relating to a system being monitored, to a simulated system, to historical data about events, etc.

[0016]An event log is a record of events that occurred in a system. The system may be a software application running on hardware, but is not limited to only software applications. The system may be anything having a logical sequence between events, such as an automobile traffic network, a weather system, a manufacturing plant, etc. For example, in an automobile network, a car passing a particular sensor may be an event, and at a given time 5 cars might be passing sensors on Main Street, in which case these events all have as a feature in common that they occurred on Main Street. In the exampl...


PUM


Abstract

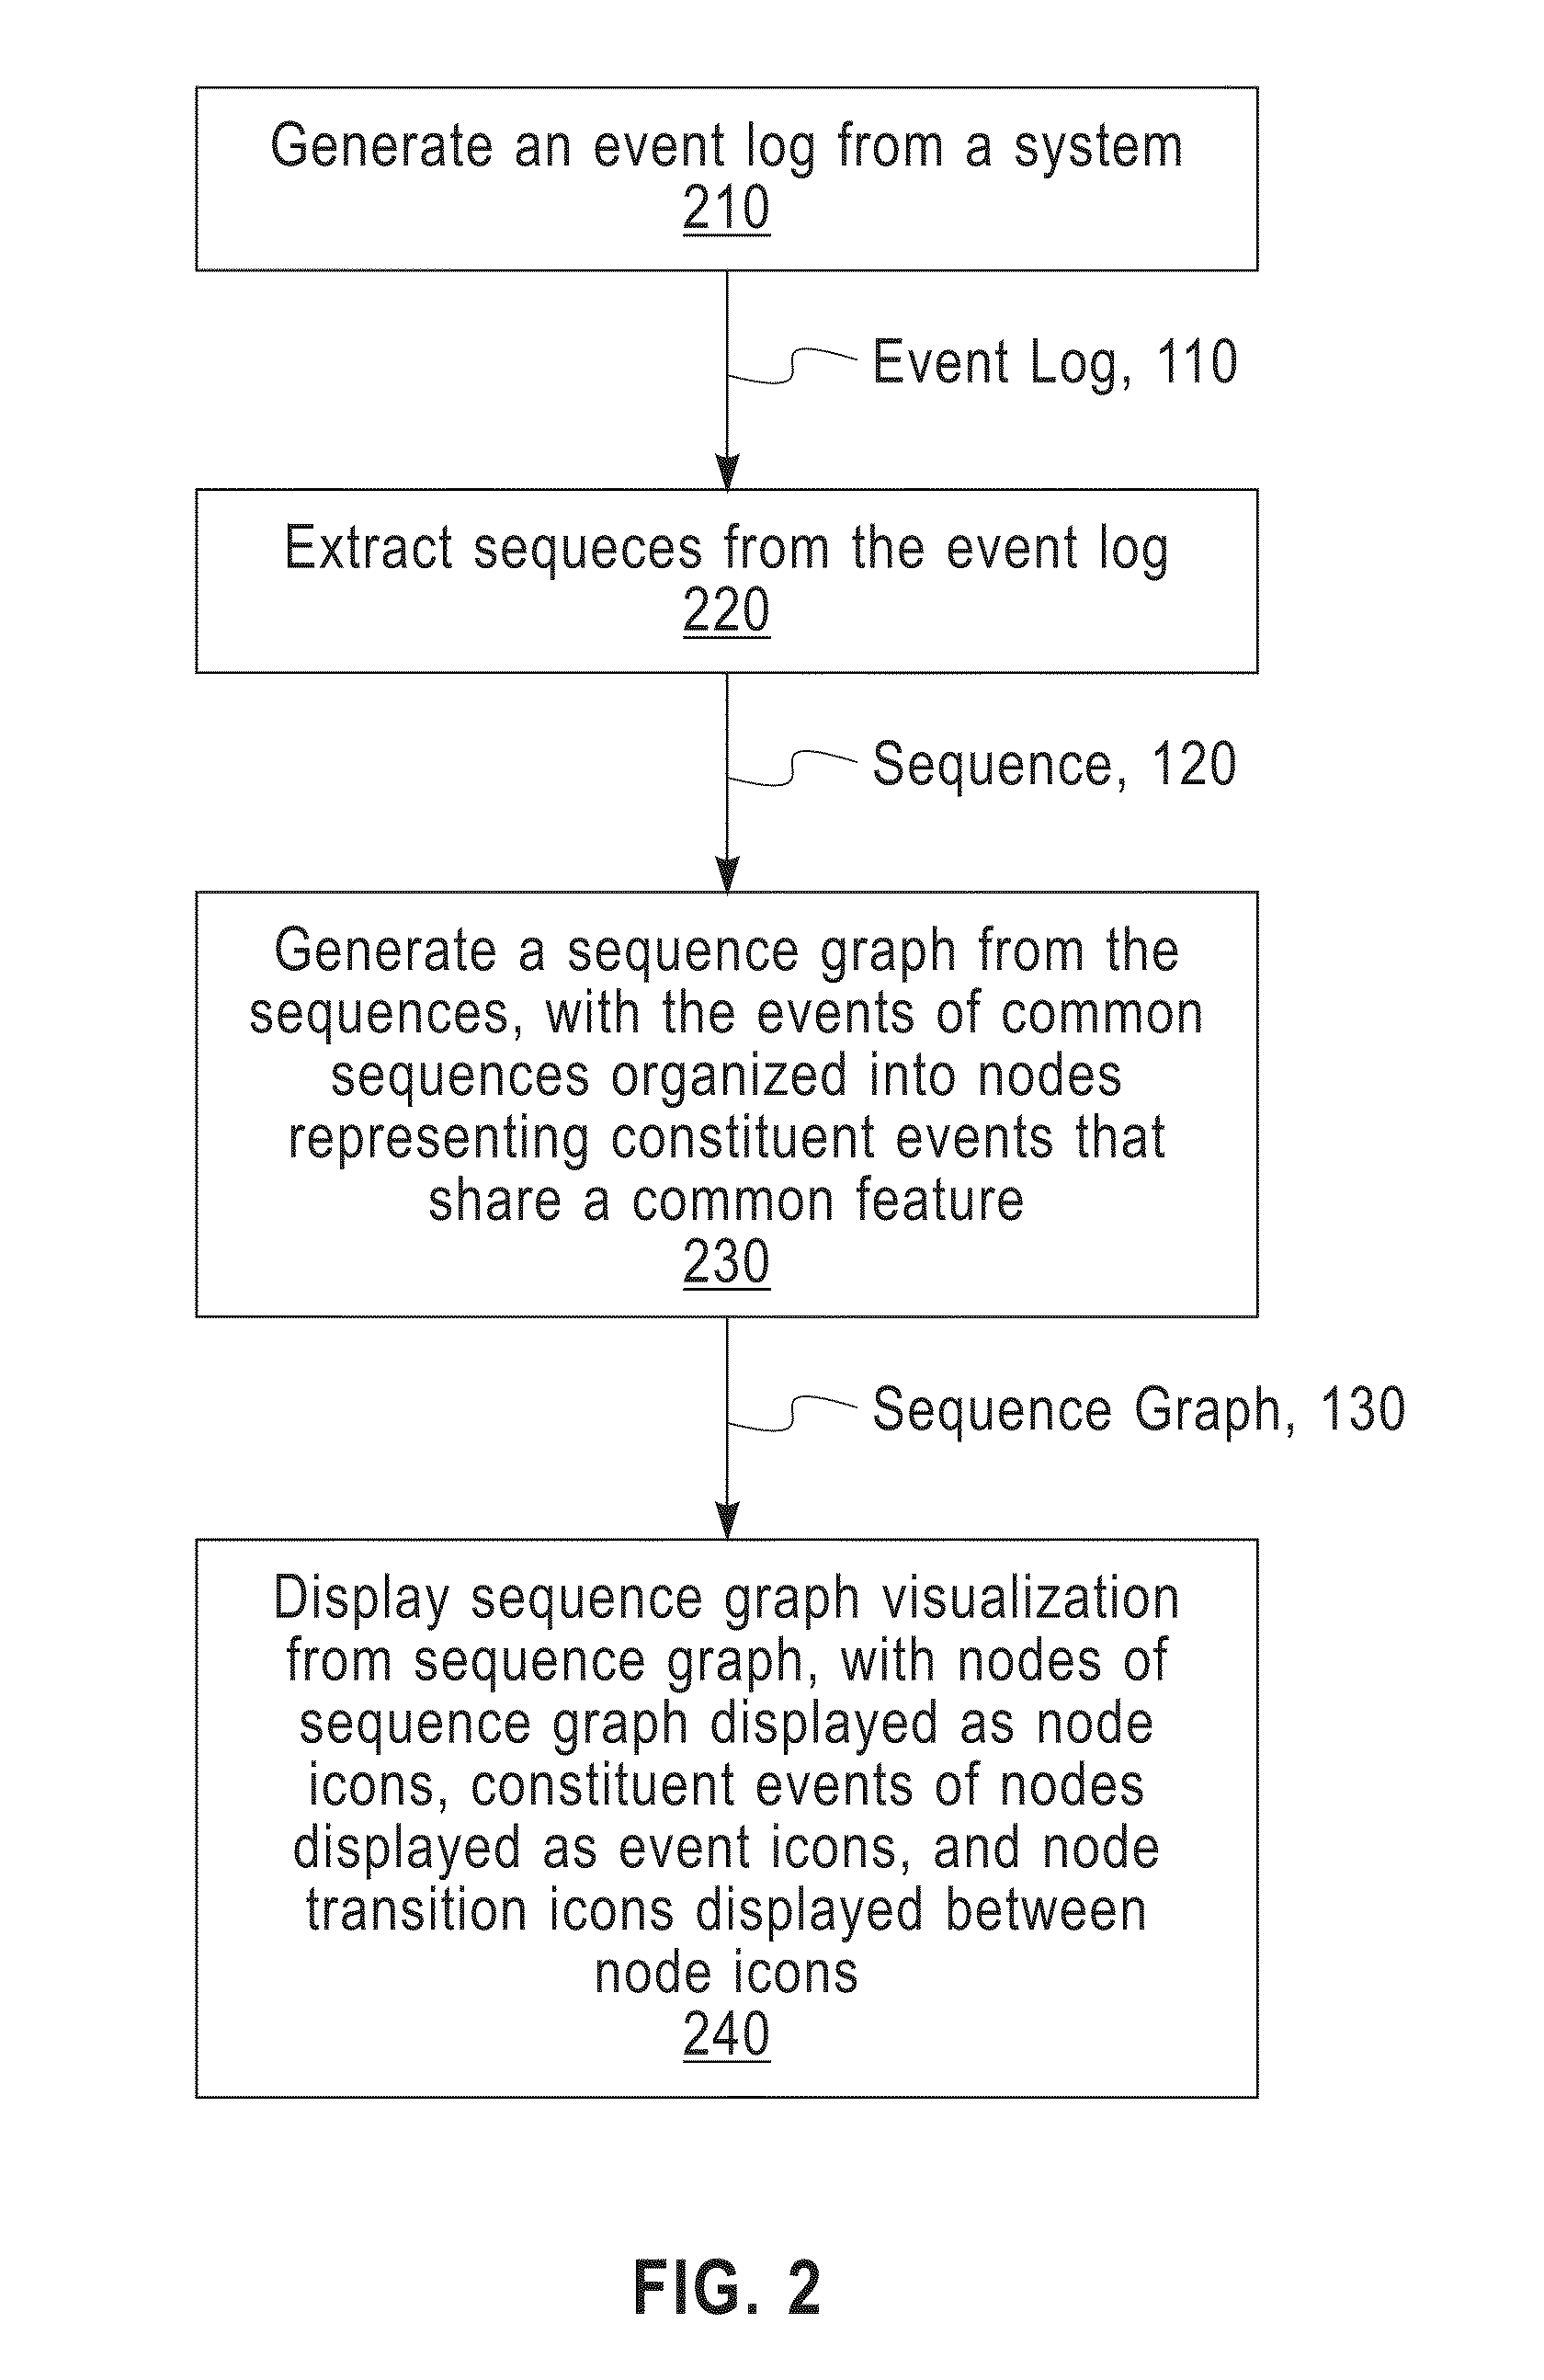
A method, system and computer readable article of manufacture for displaying visualization from an event log. According to the method, sequences are extracted from the event log. The event log is a record of a plurality of events that occurred. A sequence graph is generated from the sequences. The sequence graph includes nodes representing the events of the event log and the events of each node have a common property. A sequence graph visualization is displayed from the sequence graph. The sequence graph visualization includes (i) node icons representing the nodes of the sequence graph, (ii) node transition icons representing relationships between nodes, and (iii) an event icon for each of the one or more events of a corresponding node.

Description

BACKGROUND[0001]The present invention relates to a method, system and computer readable article of manufacture for displaying a visualization from an event log. More specifically, the present invention relates to displaying a visualization from an event log showing common sequences and instances of events and transitions between events.[0002]An event is something that has happened in a system, such as an automobile traffic network, a weather system, a manufacturing plant, etc. An event log is a record of events that have occurred. As another example, the development of a complex software or hardware system often benefits from tracing the system to create a log of information about the system's execution, where the execution of each instruction by a processor may be an event; the logs are typically used for debugging and profiling a system. These “event logs” or “trace logs” can become so large that understanding the logs becomes very difficult. Analysis tools may be used to display ...

Claims


Application Information

Patent Timeline
Patent Type & Authority Applications(United States)
IPC IPC(8): G06T11/20G06F3/048
CPCG06F11/323G06F11/3476G06T11/206G06F2201/86G06F11/3664
Inventor DE PAUW, WIMMALKIN, PETER KENNETH
Owner IBM CORP
Learn More