Eureka AIR delivers breakthrough ideas for toughest innovation challenges, trusted by R&D personnel around the world.

Determining a Critical Path in Statistical Project Management

a critical path and statistical project technology, applied in the field of determining a critical path in statistical project management, can solve the problems of requiring either expert advice or historical data, engineering development projects typically entail a great deal of unknowns, and techniques that take time and some expertise to apply, so as to optimize the project's performan

Inactive Publication Date: 2011-12-08
TELEFON AB LM ERICSSON (PUBL)
View PDF11 Cites 45 Cited by
  • Summary
  • Abstract
  • Description
  • Claims
  • Application Information

AI Technical Summary

Benefits of technology

The present invention is about an apparatus and method for creating a Gantt chart for a project. The apparatus includes a processing unit that determines the range of dates for completing a task, which is shown on a display. The method involves comparing tags of resources and tasks in a database and using a suitability module to determine which tasks should be performed by which resources to optimize the project's performance. The technical effects of this invention include improved project management and better resource allocation.

Problems solved by technology

The main problem with using traditional project planning tools is that Engineering Development projects typically encompass a great deal of unknowns.
Unfortunately, since traditional project management tools use only fixed durations for tasks, these estimated ranges are discarded, and some fixed value within the range is used instead.
However, these techniques require either expert advice or historical data.
The techniques however take time and some expertise to apply, while still avoiding the inherent uncertainty in developing projects that are unique or have some unique aspect requiring engineering to investigate unknown areas.
Therefore, the uncertainty in the task, which is represented by the range estimate, is lost.
As a consequence, the overall project plan created with this approach does not contain any measure or indication of these uncertainties.
The main problem in selecting arbitrary durations from initial range estimates is that this causes both a loss of information (the original estimates) as well as a project schedule with no corresponding confidence factor.
Therefore, it is not known by project planners or managers what degree of risk should be attributed to the resulting plan.
In addition, since project planners will often use a ‘rule of thumb’ to pick a value (such as taking the mid-point between minimum and maximum estimates), and the compound risk associated with inter-task dependencies is never accounted for, the resulting schedule usually has a much lower (yet unknown) risk associated with it, than would generally be considered acceptable.
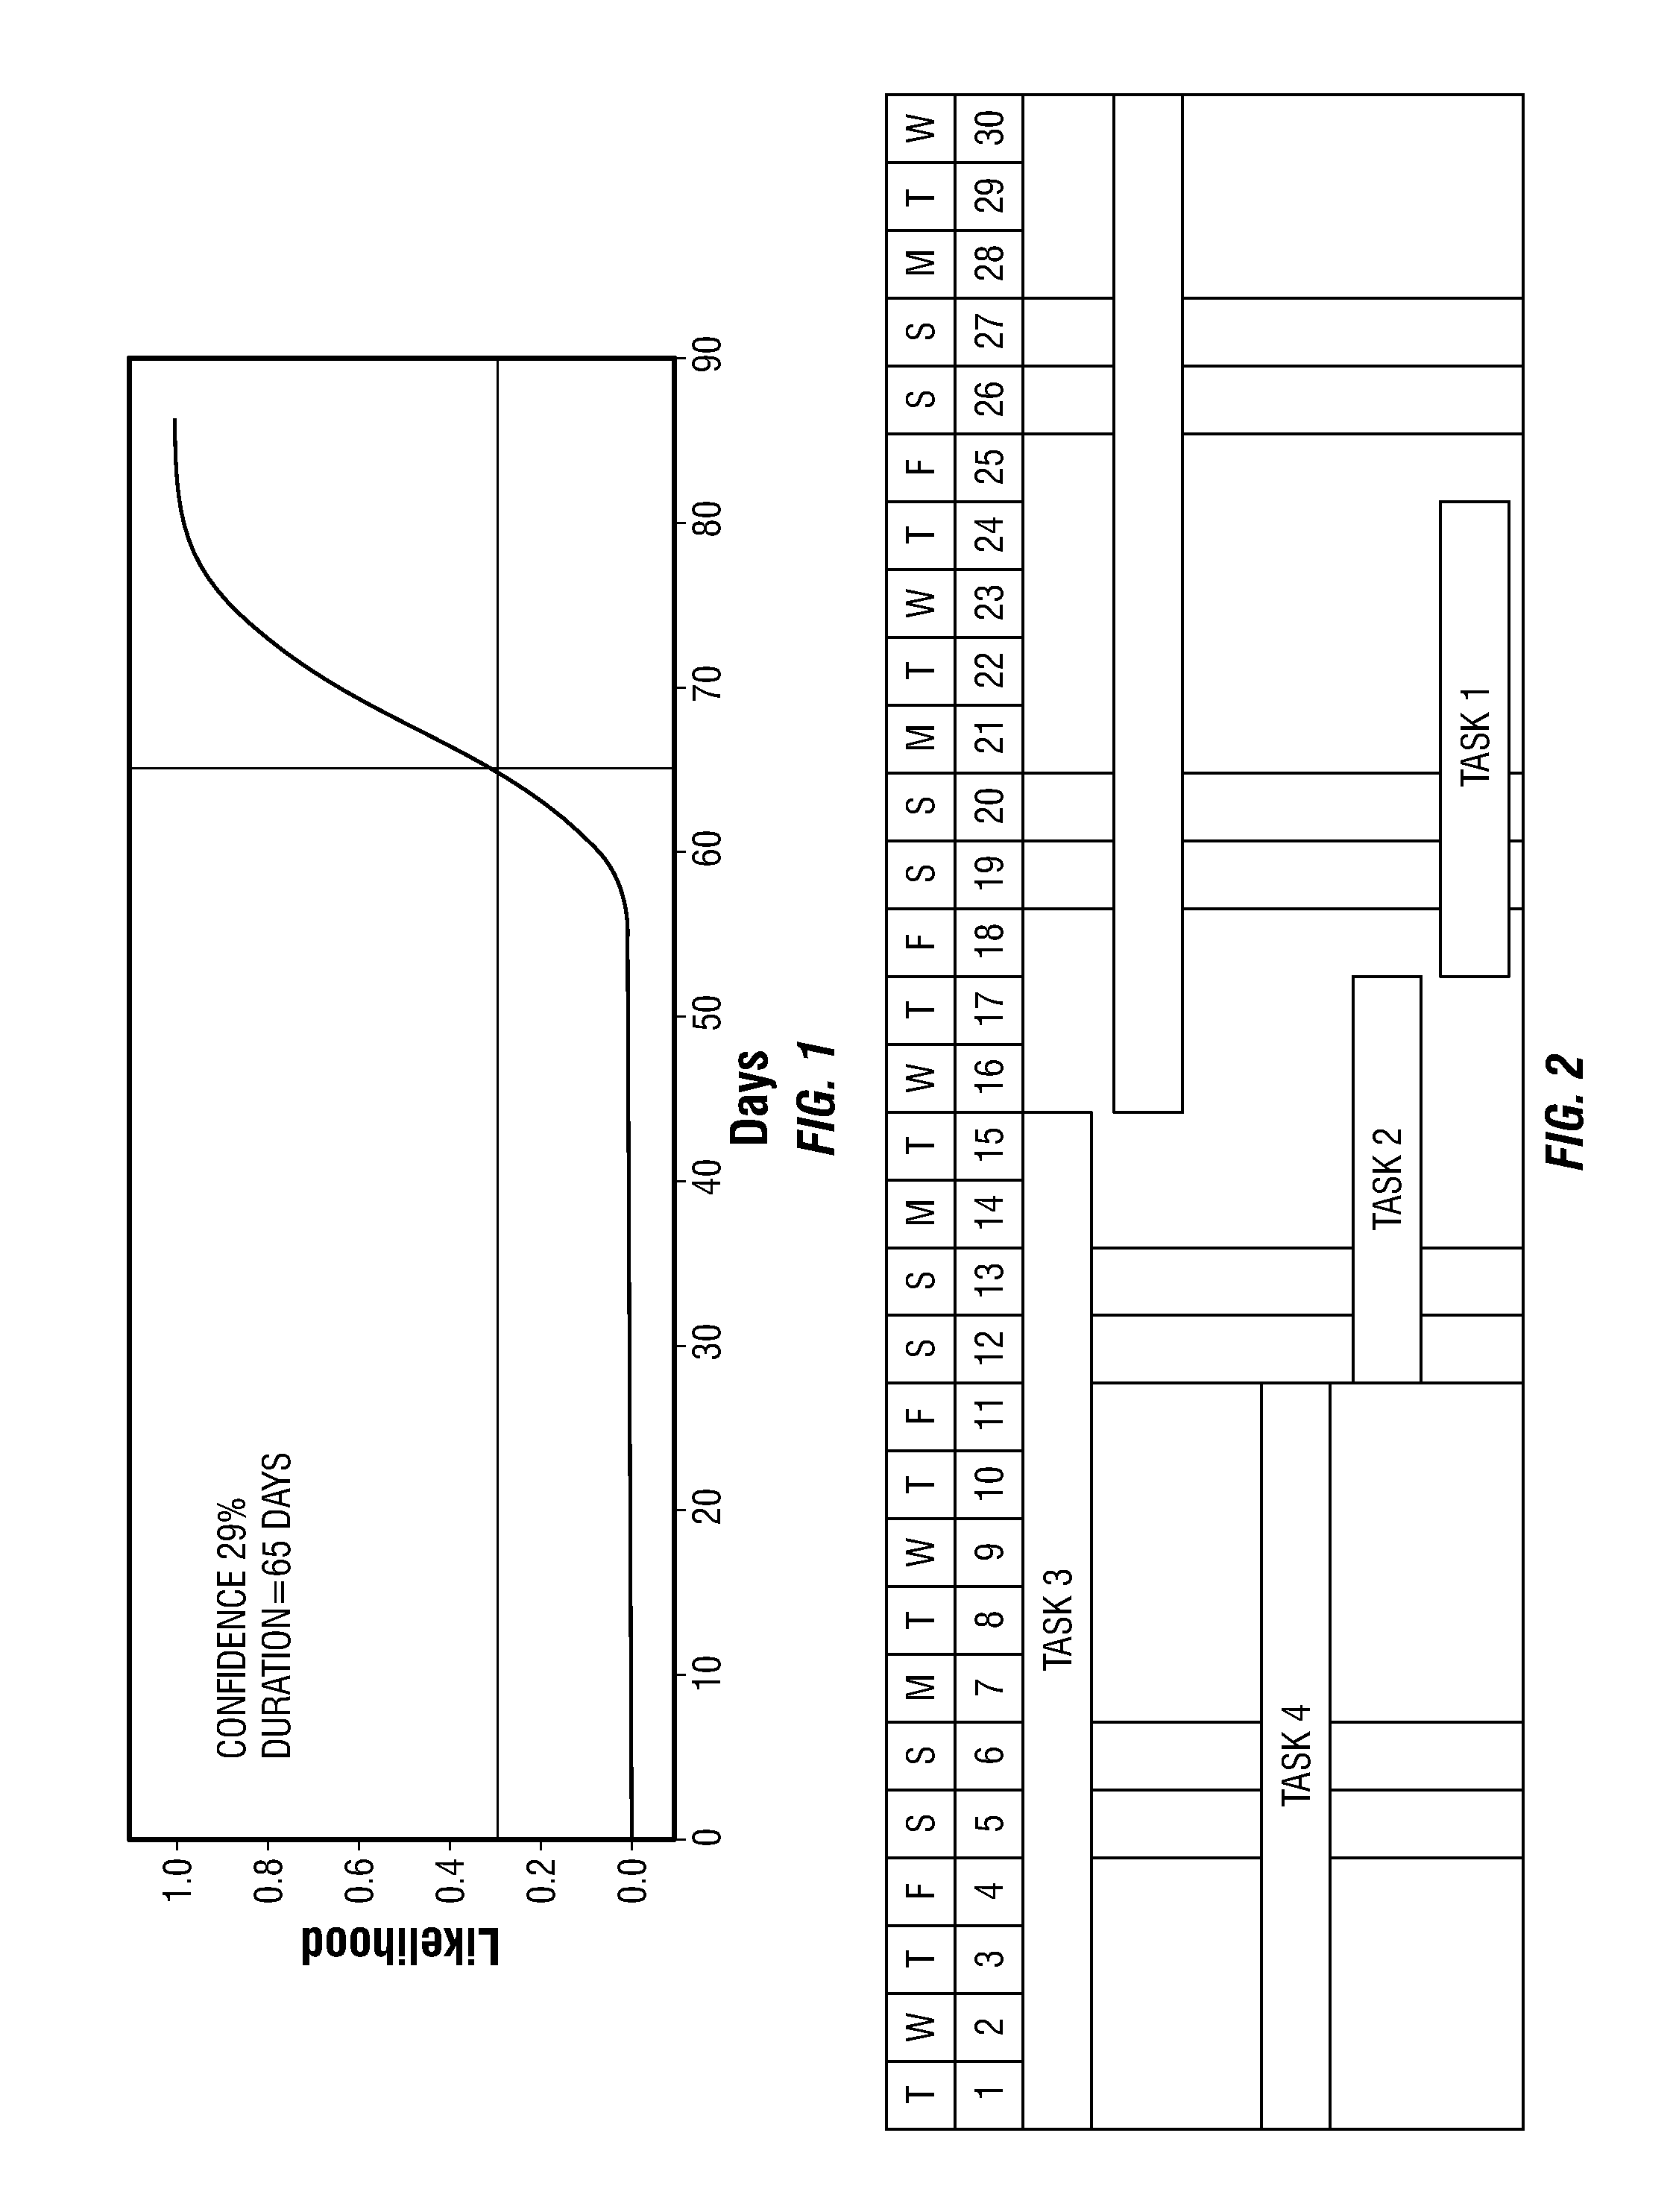
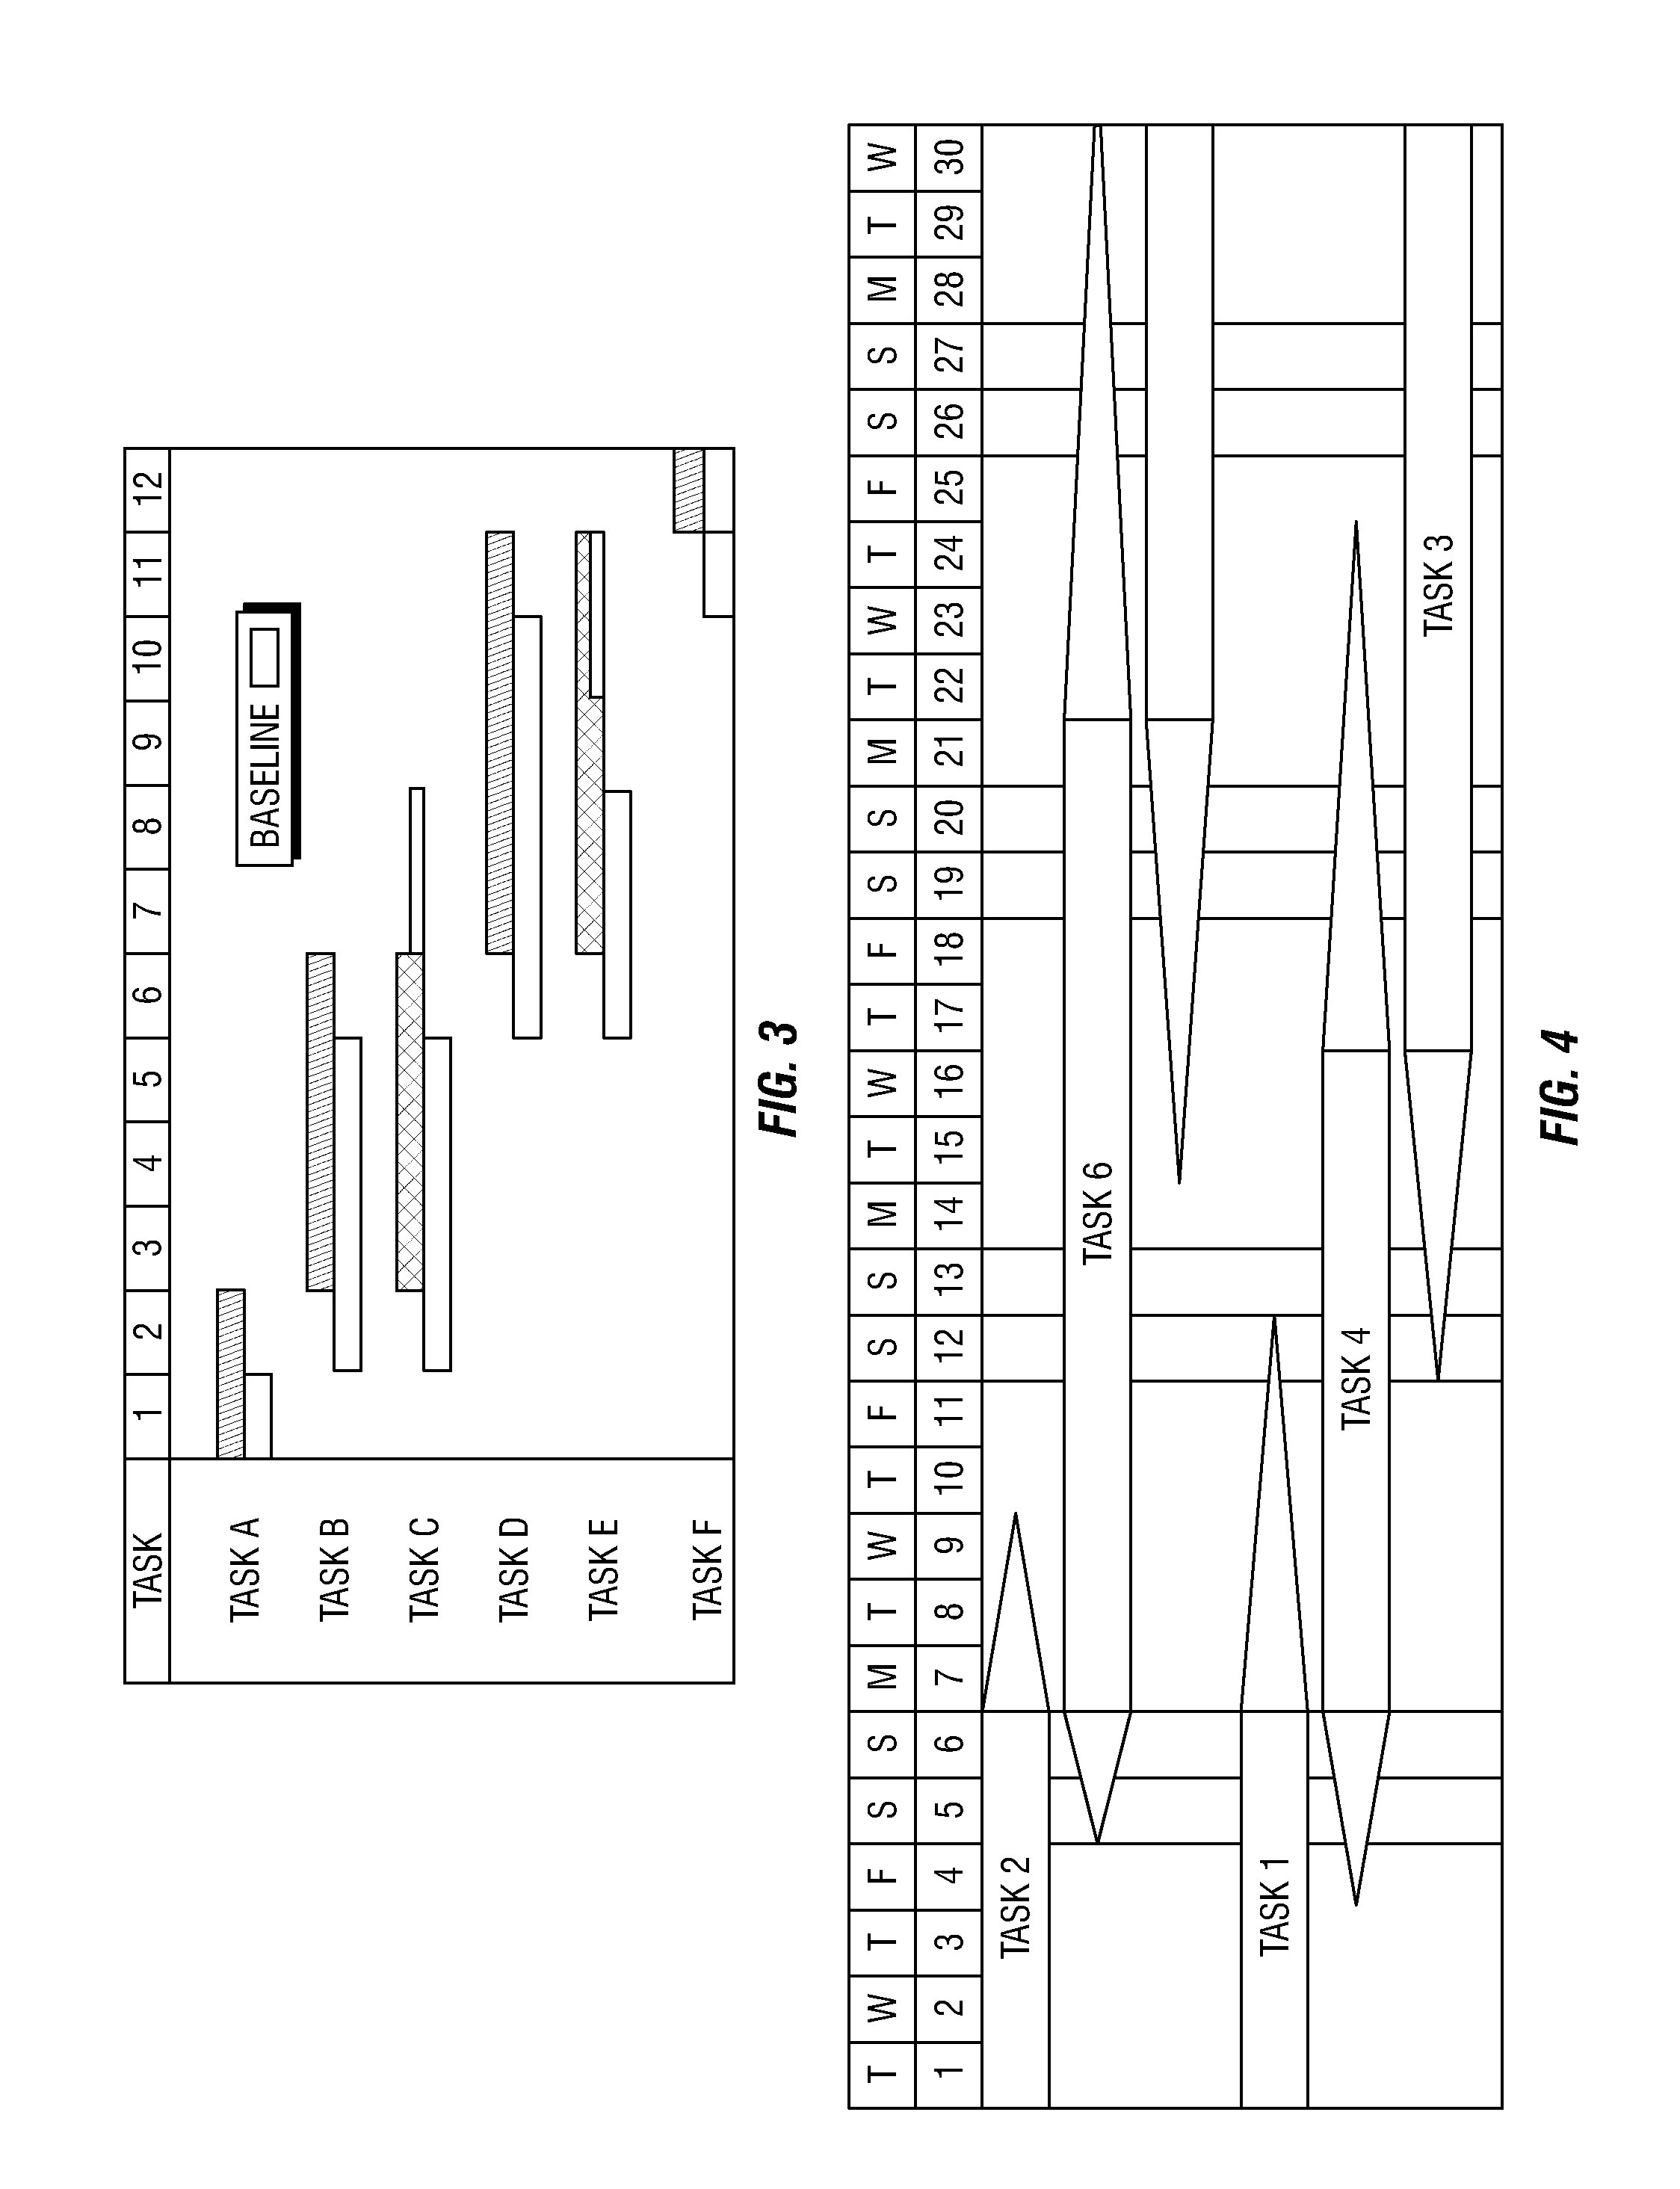
Since the Gantt Chart displays subtasks as rectangle diagrams with fixed start and end dates, it cannot represent the statistical nature of the task completion functions defined by Statistical Project Management.
One well-known problem with managing to a critical path is that since the critical path defines a single chain of subtasks, it can often cause other tasks of similar importance to be overlooked.
Another problem with traditional Critical Path management is that it is not directly applicable for use with Statistical Project Management.
If techniques are used to derive a fixed duration project plan, a traditional critical path can be identified, however, identification of this critical path ignores the contribution to the overall project duration function that non-critical path tasks do have.
When managing ongoing Engineering development projects, it is common for uncertainties to cause deviation from plan for various parts of the project.
It has been observed and postulated elsewhere that as a project progresses, the unknown information decreases, resulting in a decreasing amount of uncertainty.
Knowing that the uncertainty of a project is decreasing as the project nears completion doesn't provide much usable information with respect to managing the project.
This ‘gut feel’ can be difficult to quantify in real terms of uncertainty or confidence, and with traditional project management, even more difficult to continually assess the impact of ongoing deviations in individual subtasks.
Analyzing CC curves can be a bit time-consuming, especially if there are many intermediate ‘checkpoints’ in a project that a manager wants to monitor.
Typically, there is no systematic way to measure or observe the projected project cost as a function of task / resource assignments, meaning that the selection of resources is done either arbitrarily, or by ‘gut feel’ based on experience with the resources and / or the tasks in the project.

Method used


Image

  • Determining a Critical Path in Statistical Project Management
  • Determining a Critical Path in Statistical Project Management
  • Determining a Critical Path in Statistical Project Management

Examples


Embodiment Construction

[0040]Referring now to the drawings wherein like reference numerals refer to similar or identical parts throughout the several views, and more specifically to FIG. 7 thereof, there is shown an apparatus 10 for a Gantt chart. The apparatus 10 comprises a processing unit 12 which determines a range of dates for an end date for completing a task. The range comprises a first date and a final date. The apparatus 10 comprises a display 14 which shows the range of dates for the task completion. The display 14 may be an electronic display, such as a terminal screen, or piece of paper which has the range of dates on it.

[0041]The processing unit 12 may determine a range of a project end date from a range of end dates for all tasks of the project. The processing unit 12 may establish dates for each task end date based on a completion date for the project. The processing unit 12 may produce a strip for the display 14 that shows the range in which the task can occur, the strip having a head and ...


PUM


Abstract

An apparatus for a Gantt chart includes a processing unit which determines a range of dates for an end date for completing a task. The range comprises a first date and a final date. The apparatus includes a display which shows the range of dates for the task completion. A method for a Gantt chart includes the steps of determining a range of dates for an end date for completing a task with a processing unit. The range comprises a first date and a final date. There is the step of showing on a display the range of dates for the task completion. There is the step of showing on a display the range of the end date. An apparatus for establishing a project's performance. A method for establishing a project's performance.

Description

TECHNICAL FIELD[0001]The present invention is related to determining a range for an end date of a task. (As used herein, references to the “present invention” or “invention” relate to exemplary embodiments and not necessarily to every embodiment encompassed by the appended claims.) More specifically, the present invention is related to determining a range for an end date of a task and a range of a project end date from a range of end dates for all tasks of the project, including establishing dates for each task end date based on a completion date for the project.BACKGROUND OF THE INVENTION[0002]This section is intended to introduce the reader to various aspects of the art that may be related to various aspects of the present invention. The following discussion is intended to provide information to facilitate a better understanding of the present invention. Accordingly, it should be understood that statements in the following discussion are to be read in this light, and not as admiss...

Claims


Application Information

Patent Timeline
Patent Type & Authority Applications(United States)
IPC IPC(8): G06Q10/00
CPCG06Q10/06G06Q10/103G06Q10/067
Inventor NEWPOL, RICHARDDITMORE, ROBERT
Owner TELEFON AB LM ERICSSON (PUBL)
Why Eureka
Eureka Blog
Learn More