
Speed test throughput distribution

Active Publication Date: 2014-11-20
VERIZON PATENT & LICENSING INC
View PDF4 Cites 6 Cited by
  • Summary
  • Abstract
  • Description
  • Claims
  • Application Information

AI Technical Summary

Benefits of technology

The patent describes a system and method for measuring the speed at which data is downloaded from a service provider's network to a customer's computer. This speed test is important for advertising and ensuring consistent service. The system uses a simulation device to mimic the data demand on the network and measures the throughput of the network during a speed test. The system can also predict the likely speed of the test based on the data demand distribution model. The technical effect of the patent is to provide a reliable and consistent way to measure data speed and ensure good service performance for data services.

Problems solved by technology

This may be a result of congestion on a link that the customer shares with other traffic.

Method used


Image

  • Speed test throughput distribution
  • Speed test throughput distribution
  • Speed test throughput distribution

Examples


Embodiment Construction

[0011]The following detailed description refers to the accompanying drawings. The same reference numbers in different drawings may identify the same or similar elements. Also, the following detailed description does not limit the invention.

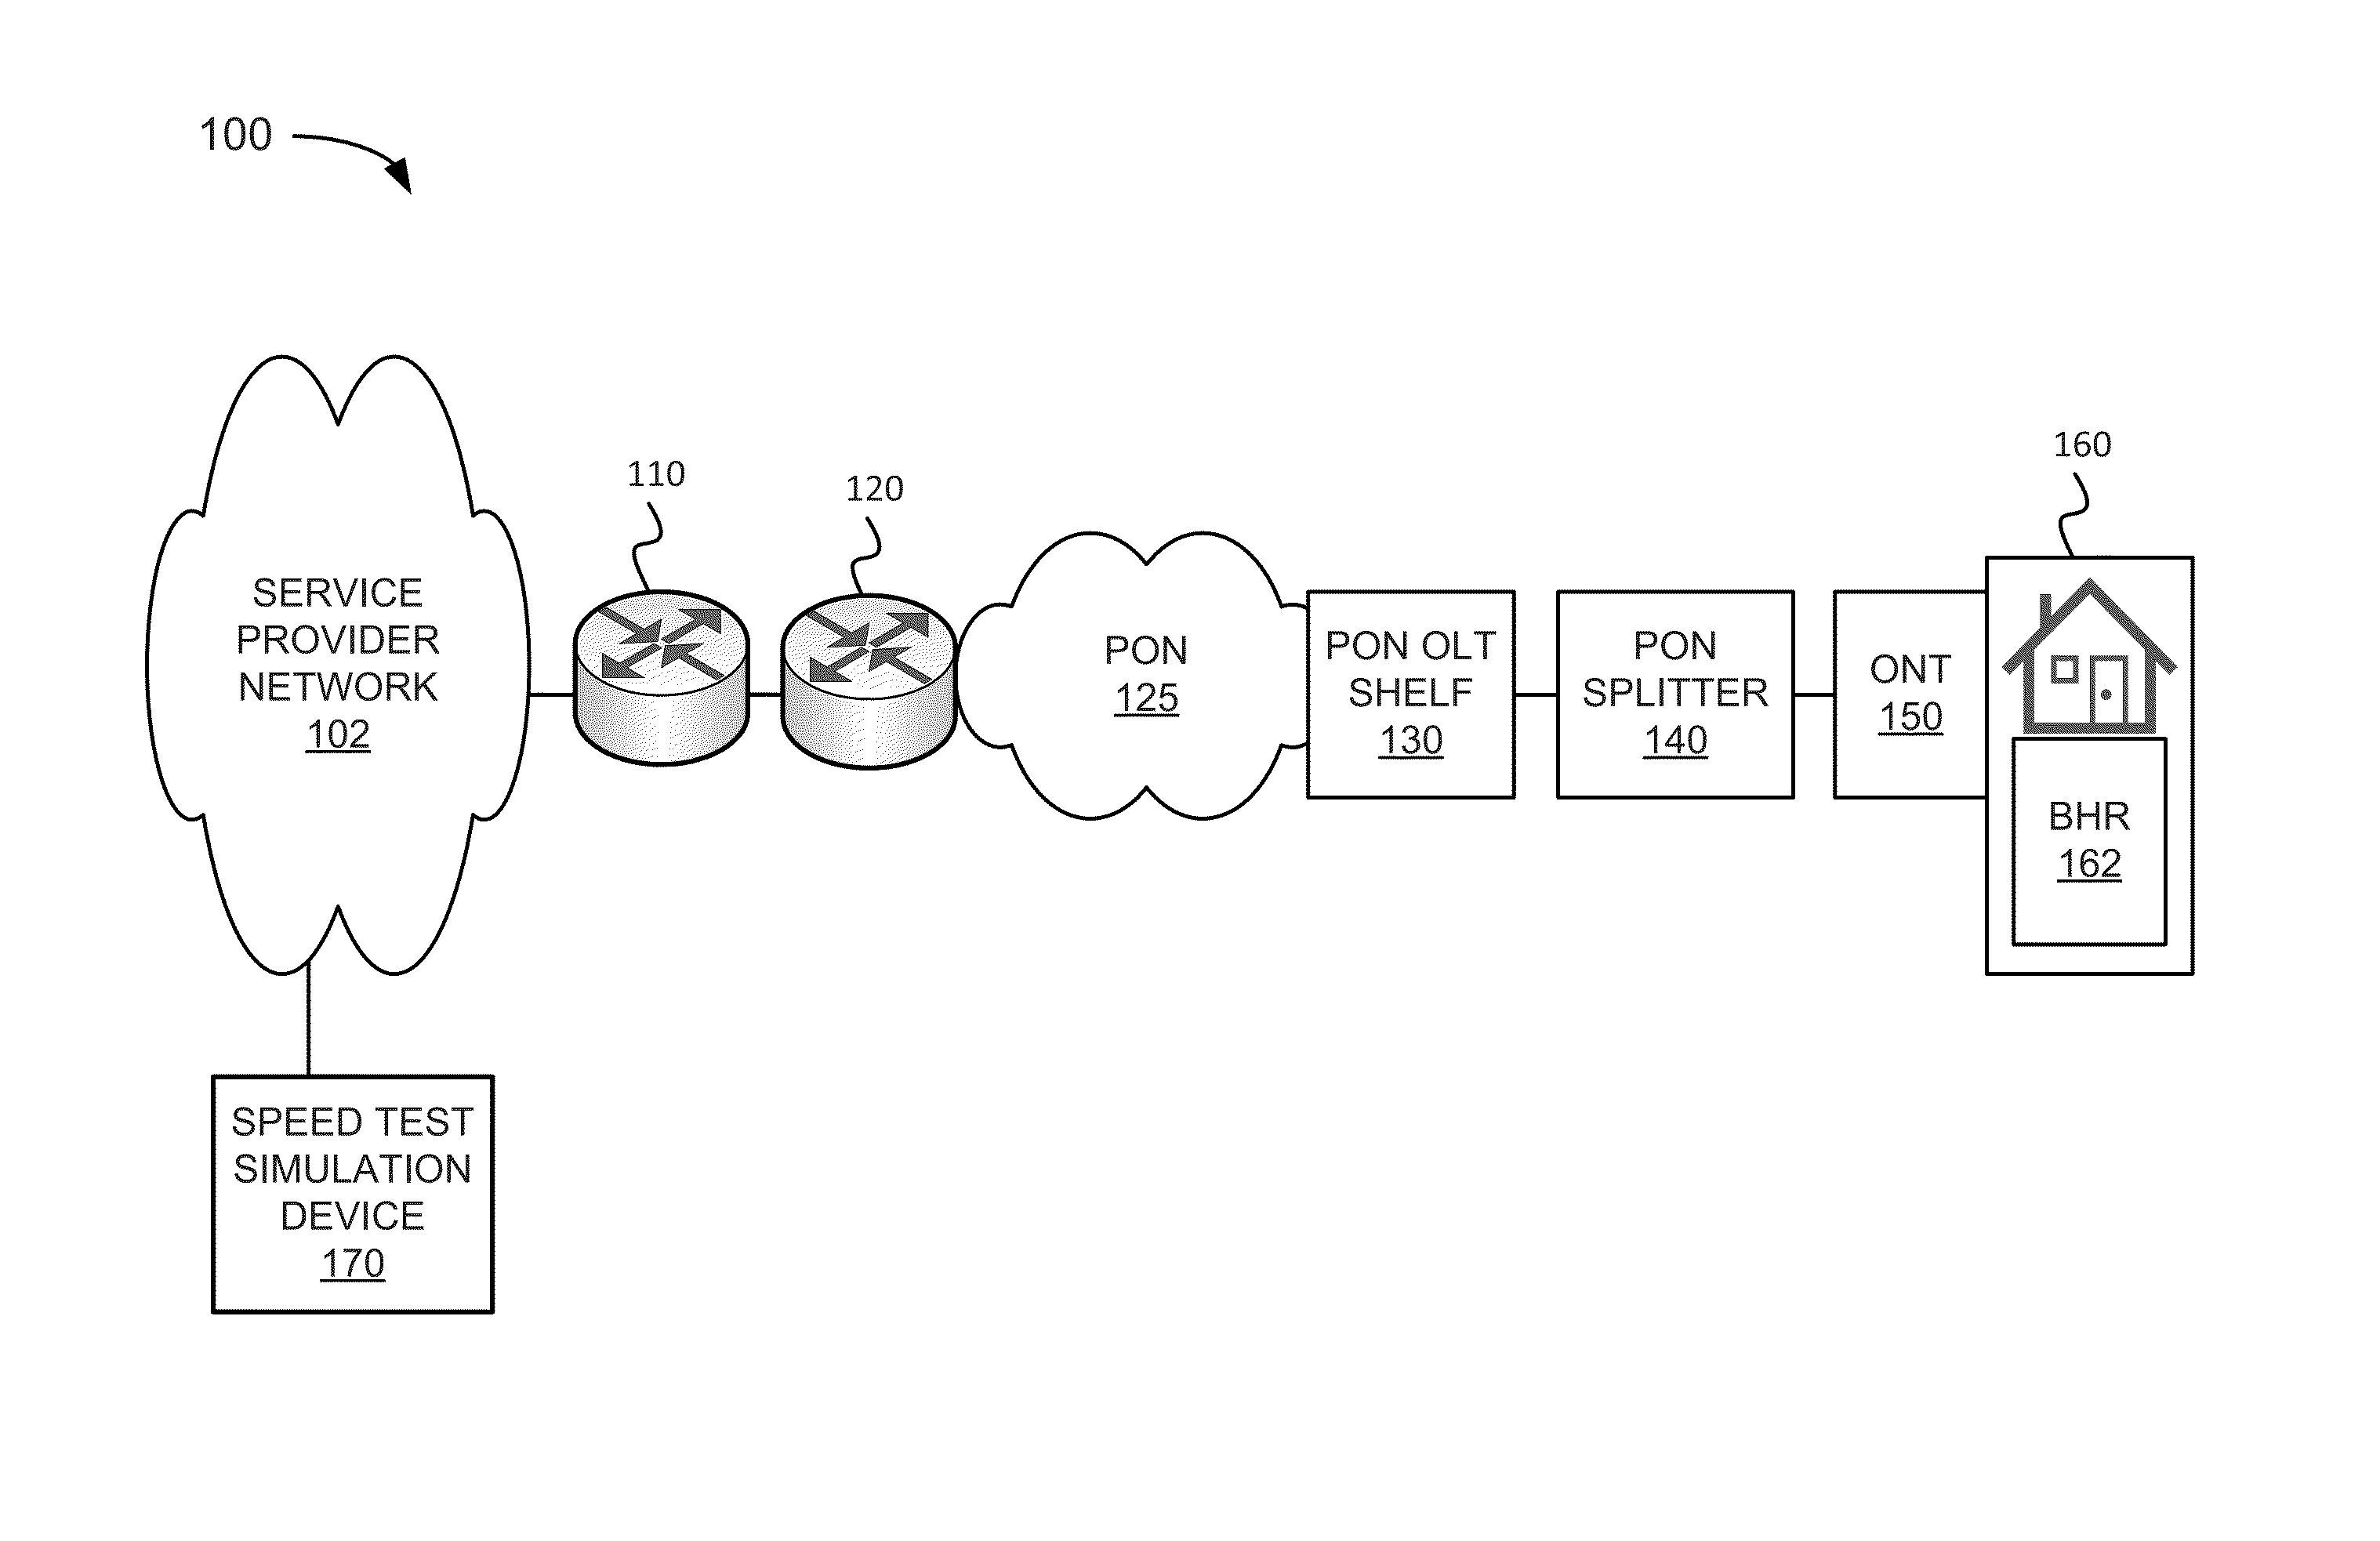
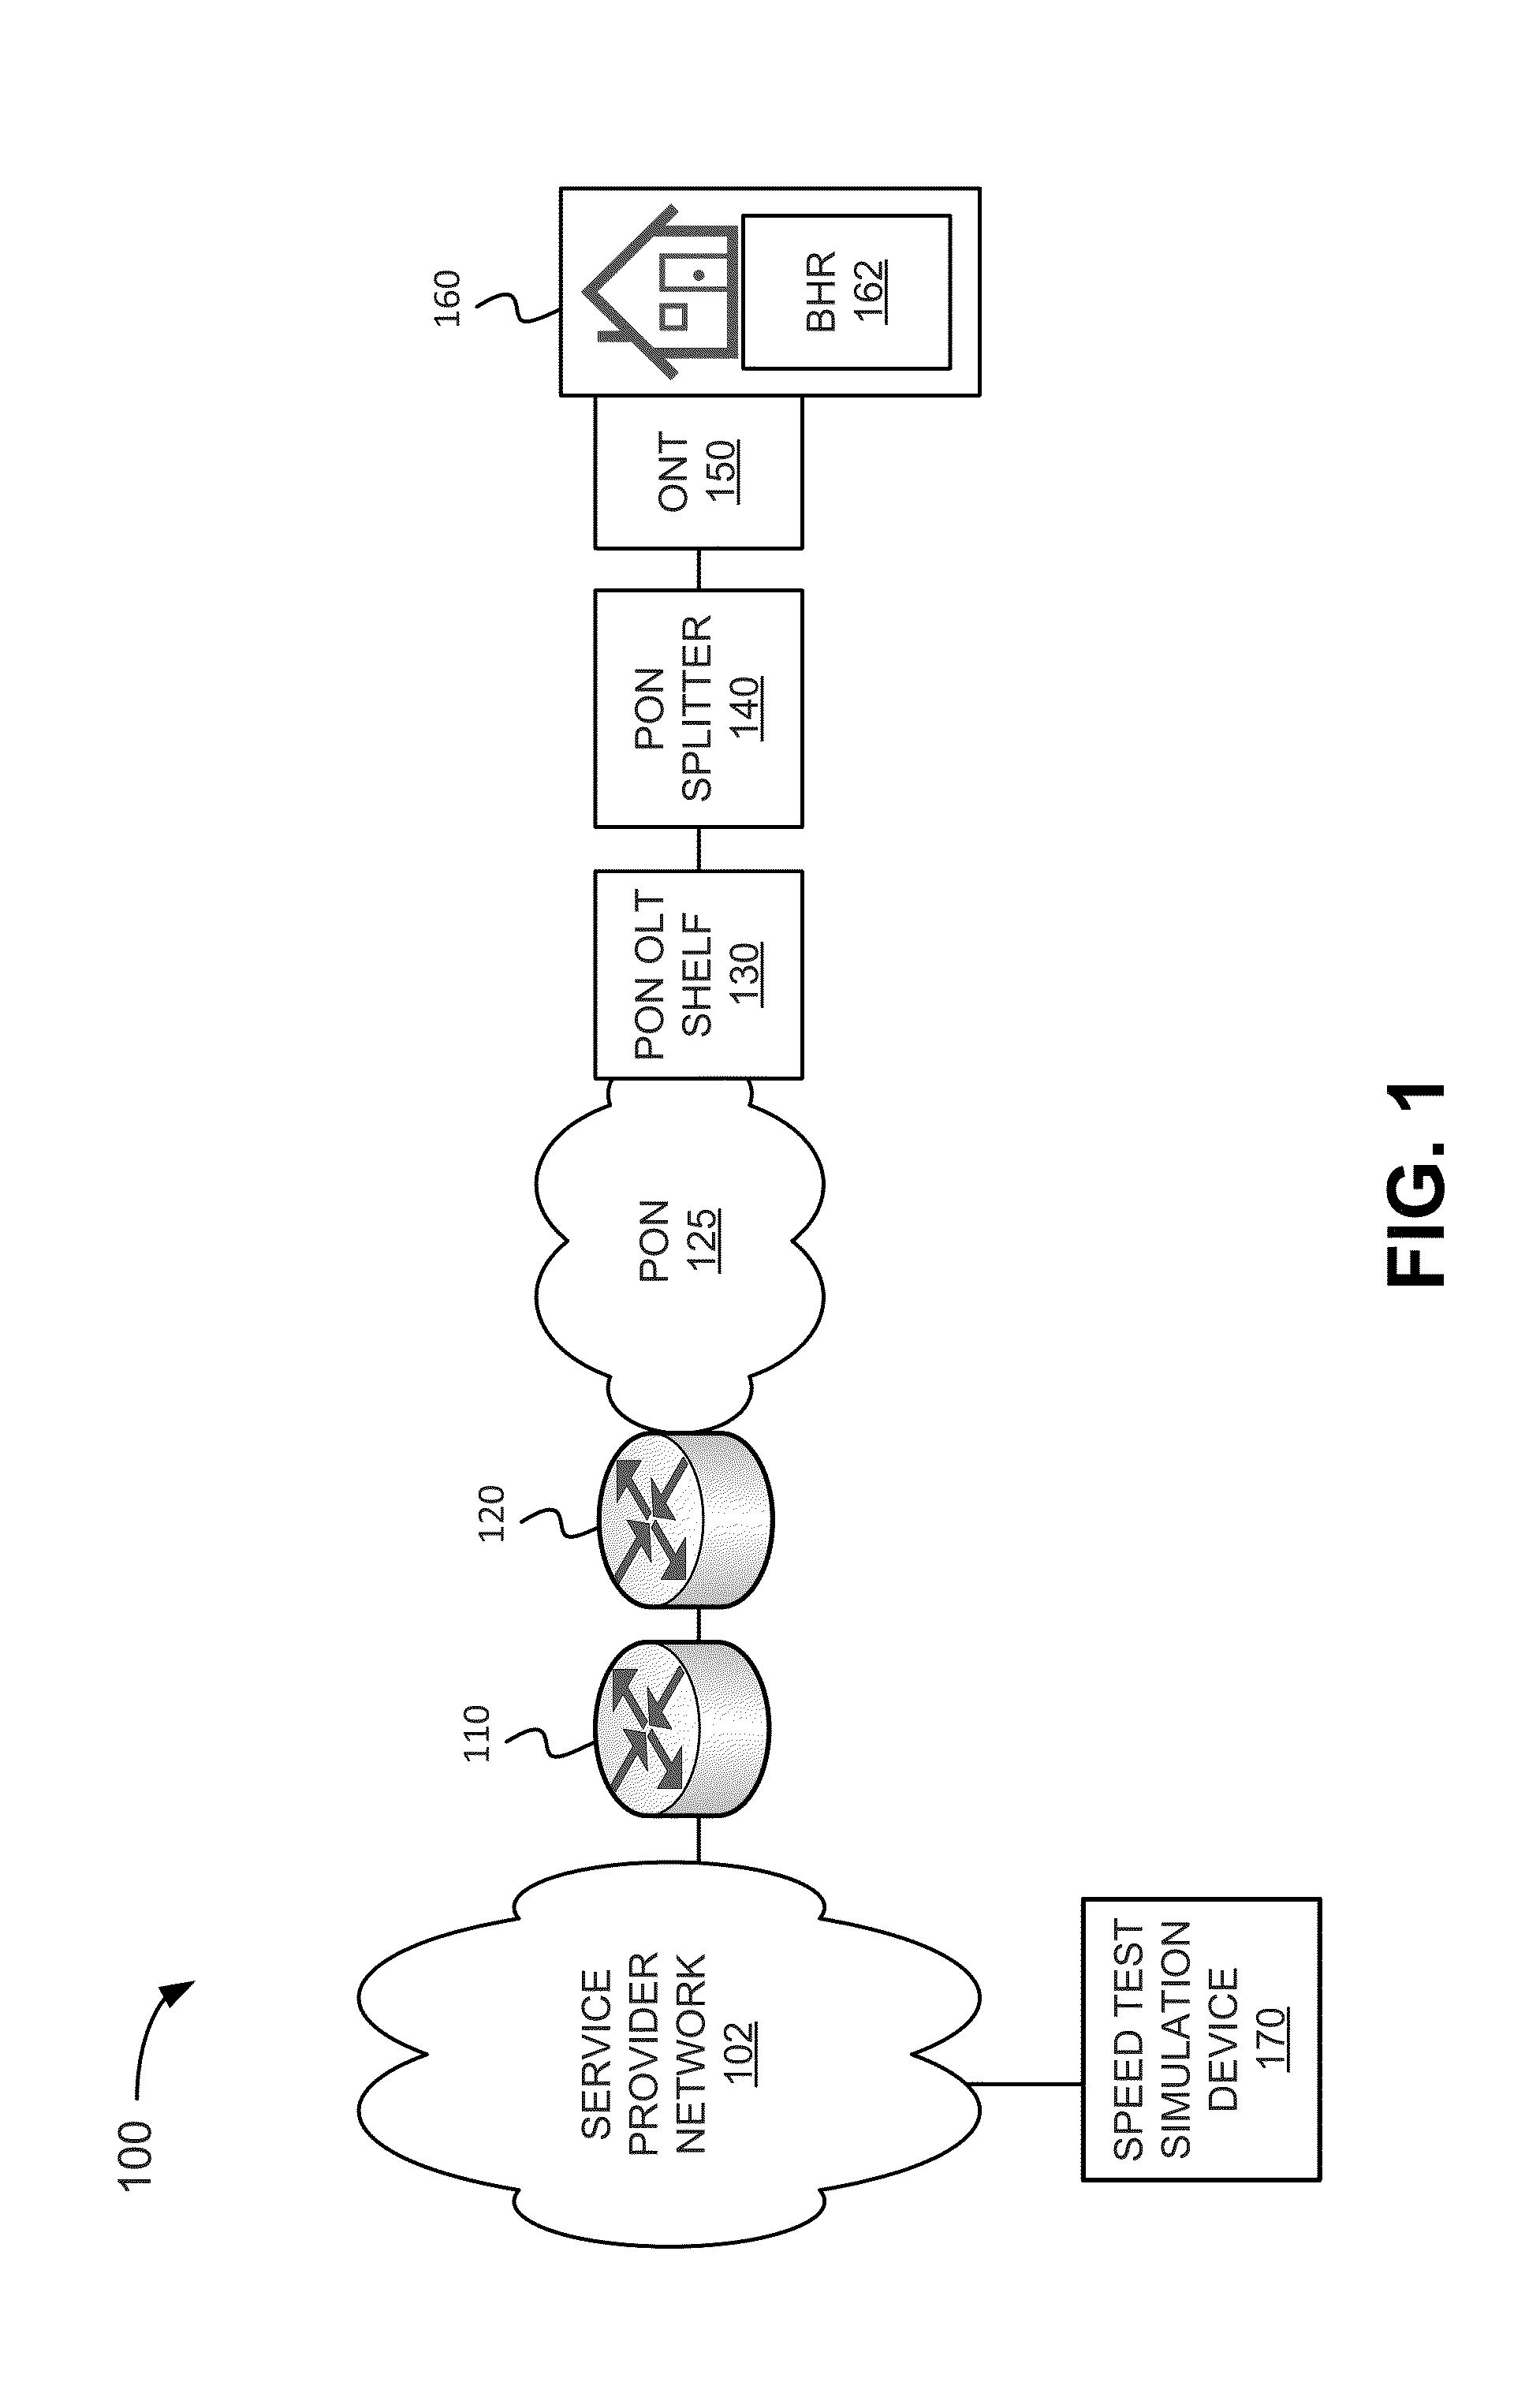
[0012]Systems and / or methods described herein may determine a data demand distribution model of data demand traffic on a link (e.g., a gigabit Ethernet link) from a gateway router (GWR) in a service provider's network to a service provider's central office (e.g., an optical line terminator (OLT)). The data demand distribution model generates a probability distribution, which indicates a probability during a particular interval (e.g., a busy evening hour) that demand is at a given level. For example, the data demand probability distribution might indicate that demand exceeds 950 Mbps with a probability of 2%.

[0013]A speed test simulation model may indicate a speed test throughput when a speed test runs while the total data demand on the link is at ...


PUM


Abstract

A method may include determining a total data demand distribution for a plurality of subscribers associated with a link between a gateway router (GWR) and an optical line terminal (OLT) in a network. The method also includes identifying a maximum link capacity of the link between the GWR and the OLT. The method further includes identifying a speed tier for which a speed test is to be executed, and determining a speed test throughput distribution based on the speed tier, the total data demand distribution and the maximum link capacity in an identified time interval.

Description

BACKGROUND INFORMATION[0001]Telecommunications service providers and their customers monitor the speeds at which their customers can download data. These speeds are often a key part of advertising. The Federal Communications Commission (FCC) is similarly concerned with data speeds and has established a process to measure achievable data speeds for selected users. The process entails running a speed test on a customer's computer.[0002]In the speed test, an agent on the customer's computer downloads a large file from a server for a predetermined time (e.g., a 20 second interval). During an interval after the connection has become stable (e.g., five seconds beginning from 10-15 seconds in the 20 second interval) the agent measures how many bytes arrived from the server and divides by the download time to get the download throughput in megabits per second (Mbps). The throughput should match the customer's provisioned data rate. For example, a customer provisioned at 25 Mbps should be ab...

Claims


Application Information

Patent Timeline
IPC IPC(8): H04B10/077
CPCH04B10/0775
Inventor SMITH, DONALD E.
Owner VERIZON PATENT & LICENSING INC
Features
  • Generate Ideas
  • Intellectual Property
  • Life Sciences
  • Materials
  • Tech Scout
  • Unparalleled Data Quality
  • Higher Quality Content
  • 60% Fewer Hallucinations
Learn More