System and method for computing and overwriting the appearance of project tasks and milestones

a project task and milestone technology, applied in computing, instruments, data processing applications, etc., can solve the problems of inability to effectively communicate the big picture to stakeholders or executives, lack of stylistic control of project managers, and inability to apply meaningful data-driven shapes and colors in reporting out of these project management software applications. to achieve the effect of conveying consistent meaning, project managers are and the project manager is unable to achieve consistent meaning.

Active Publication Date: 2014-12-11
CHRONICLE GRAPHICS
View PDF4 Cites 48 Cited by
  • Summary
  • Abstract
  • Description
  • Claims
  • Application Information

AI Technical Summary

Problems solved by technology

Project management is as much about communication as it is execution, but projects by their very nature are complex, which makes it difficult to effectively communicate the big picture to stakeholders or executives.
Reporting out of these project management software applications has little ability to apply meaningful sets of data-driven shapes, colors, border formats, sizes, and fonts that would improve the quality of project communications.
Lack of such stylistic control impairs the project manager's ability to convey consistent meaning to project stakeholders.
These charts are often rich in graphical formatting and therefore easier to understand, but they are created by manually editing shapes and therefore lack the capability to apply a style or set of styles to a project report in an automated fashion.
Furthermore, projects change with time, and manually-created formatting affords no way to automatically update the task dates and progress while preserving the formatting.
Finally, projects often exist in the context of a portfolio of related projects and yet manual formatting affords no way to enforce consistency from one project to the next.
As a result, the process of presenting projects effectively is a tedious and time-consuming effort for any project manager who needs to summarize a project in a way that makes good use of colors, shapes, fonts, border styles, and sizes.

Method used


Image

  • System and method for computing and overwriting the appearance of project tasks and milestones
  • System and method for computing and overwriting the appearance of project tasks and milestones
  • System and method for computing and overwriting the appearance of project tasks and milestones

Examples


Embodiment Construction

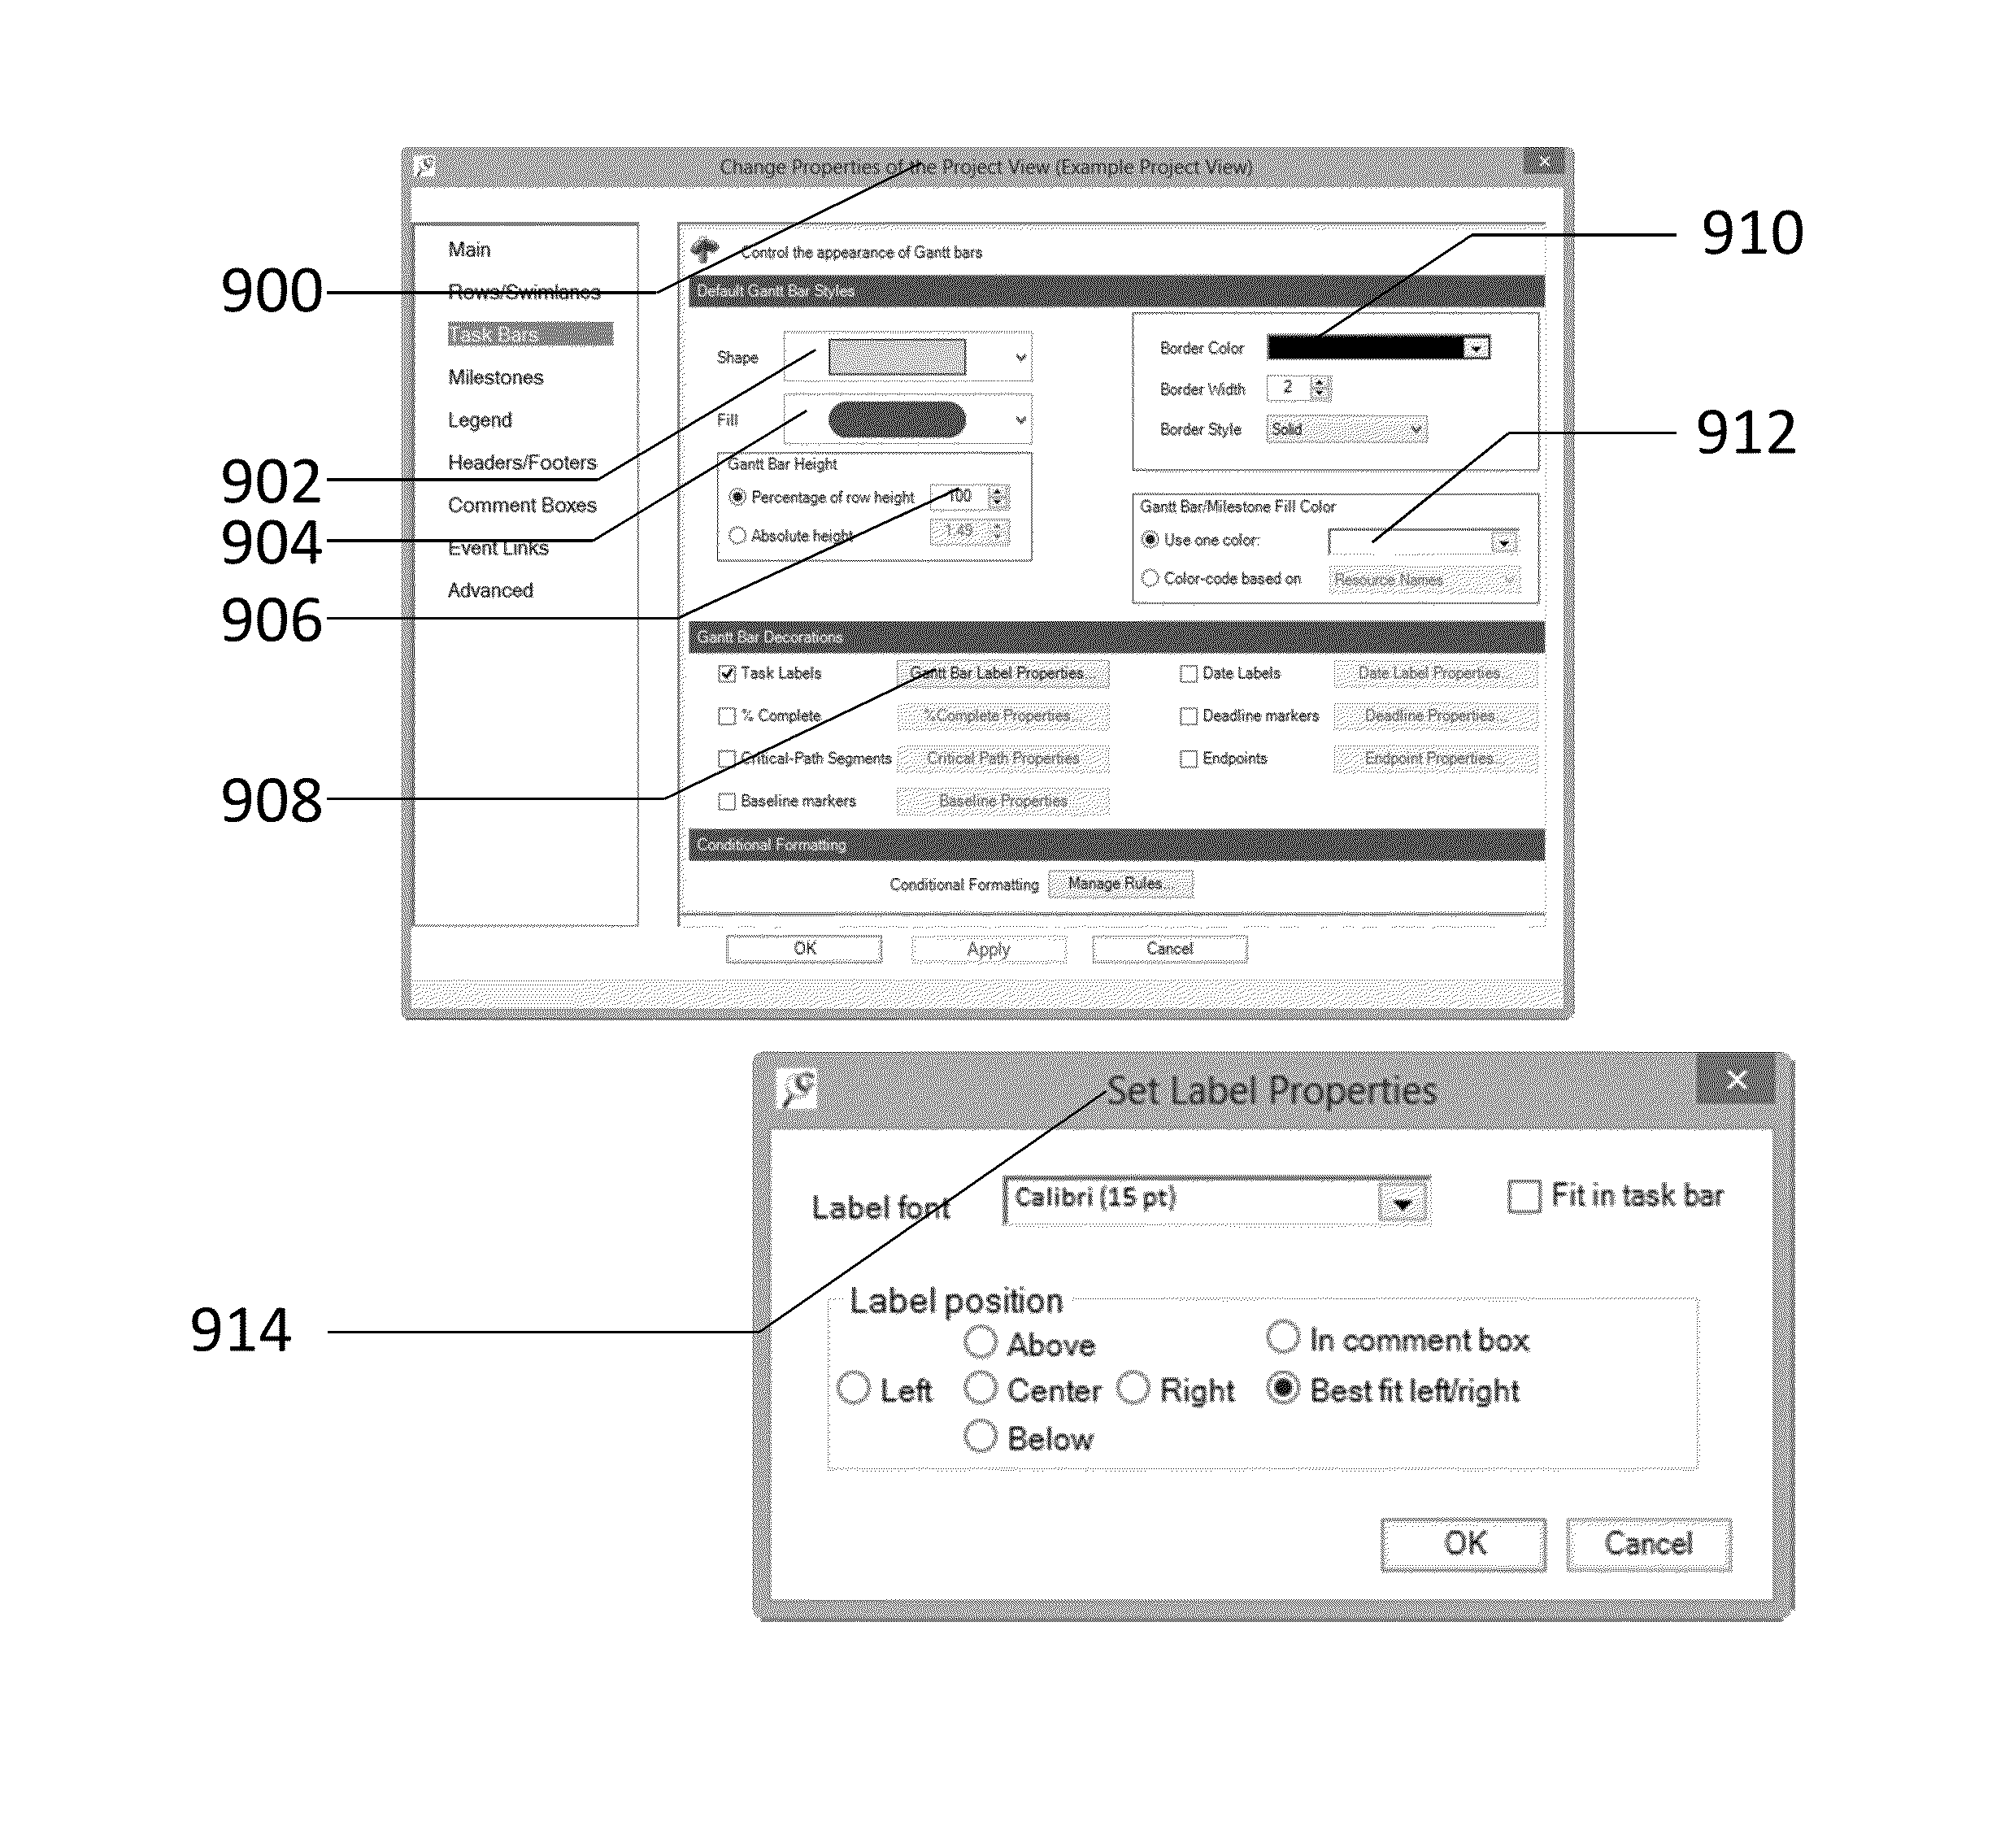
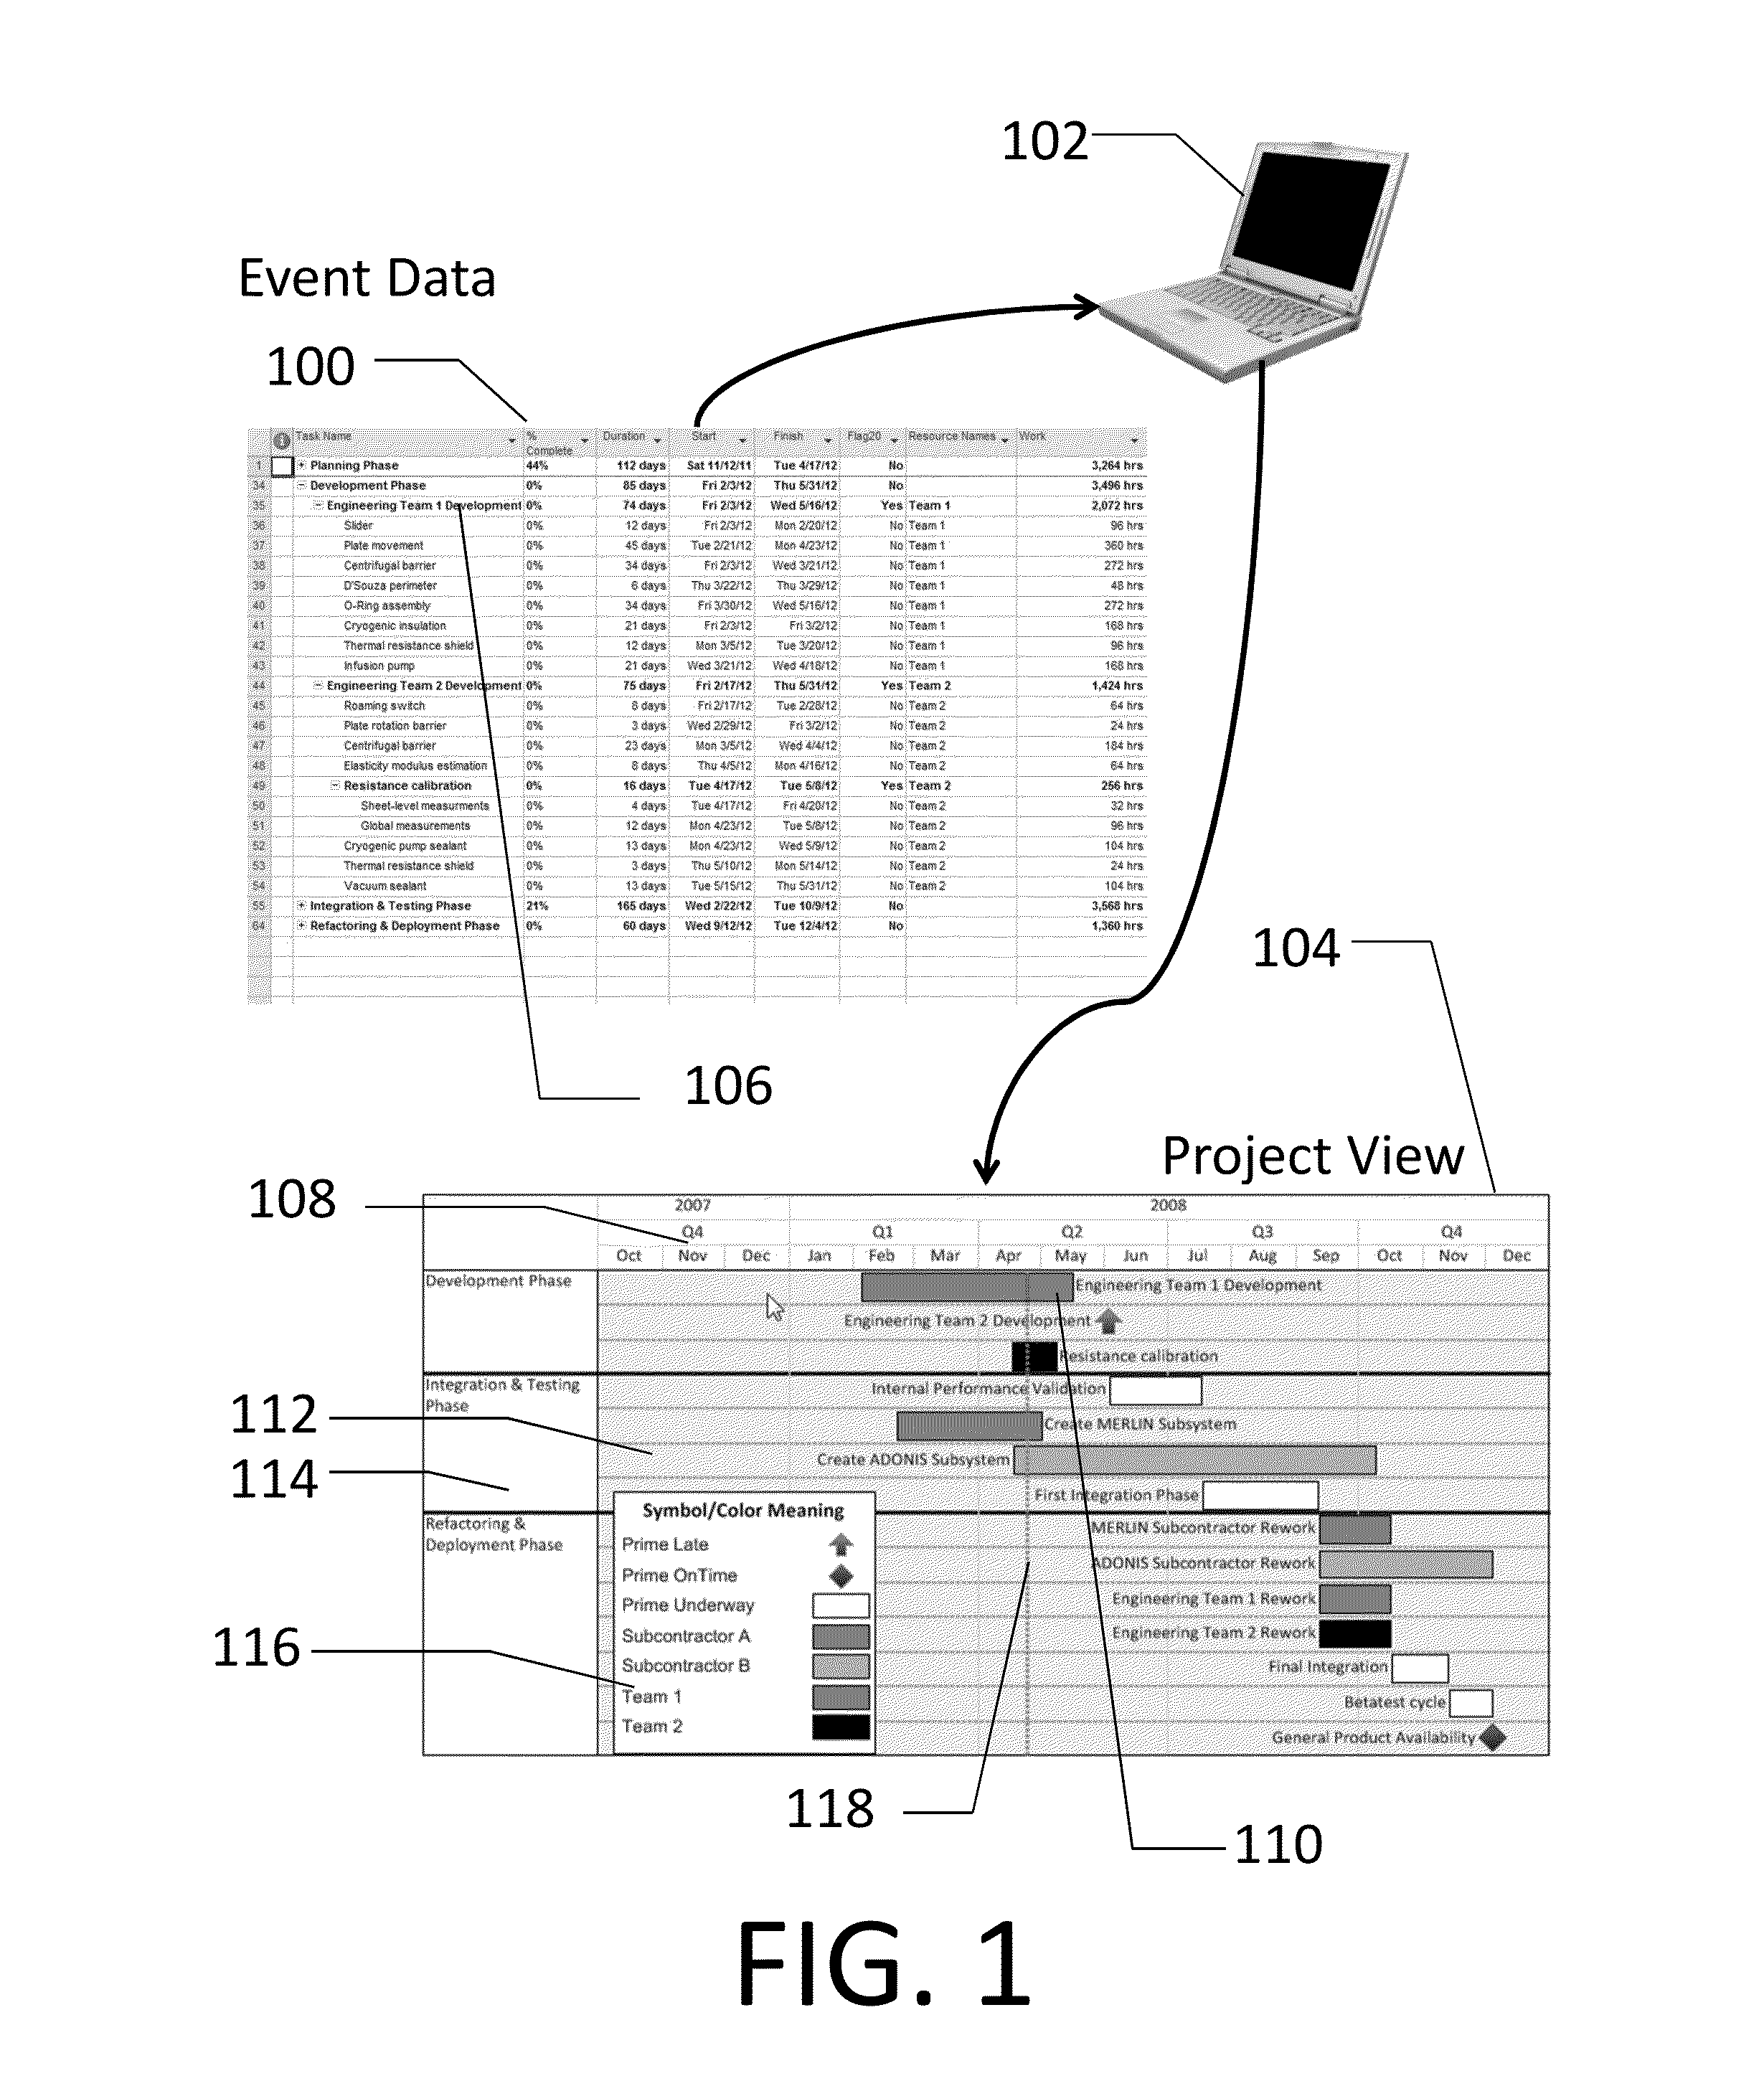
[0033]One embodiment of the invention, which is not intended to limit the scope of the invention, is a computer system that processes Event data from one or more project plans, renders a set of Markers in rows and swimlanes along a timeline based on the start or finish dates for each Event, and applies either a default style, or one or more style rules to each Marker in the graph. Following the initial rendering, users of the system may choose to alter the formatting of the Markers by making manual changes, modifying the default styles, modifying the style rules, updating the project data and re-applying style rules based on any changes to this data, or adding additional snapshots (versions) of the project plan and applying the same rules to the new snapshots.

GLOSSARY OF TERMS

[0034]The terms and phrases defined in this section are intended to have the meaning ascribed to them applied throughout this document including the claims unless clearly indicated otherwise explicitly or in co...


PUM


Abstract

A computer-implemented system that transforms one or more project plans to create a graphical project view. The appearance of the project view is determined by a default style, one or more style rules applied to each task or milestone in the chart, or both. Once the project view has been created, users may alter its appearance by changing the default style settings, modifying the data-driven style rules, or by manually changing the appearance of selected tasks and milestones to deviate from the default style or style rules. As project plans are updated, the project view may be refreshed to create a new snapshot, or to replace an existing snapshot. As data is refreshed, the system will preserve manual style changes, and will also reapply style rules, which may result in a change to the project view's appearance. Snapshots may have different appearances, based on rules and manual changes.

Description

BACKGROUND OF THE INVENTION[0001](a) Field of the Invention[0002]This invention pertains to a computer-implemented system that creates visual project reports where sets of tasks and milestones can be assigned graphical formatting based on default styles, or based on rules that test task or milestone data attributes.[0003](b) Discussion of Prior Art[0004]Project management is as much about communication as it is execution, but projects by their very nature are complex, which makes it difficult to effectively communicate the big picture to stakeholders or executives.[0005]Commercially-available project management software such as MICROSOFT® Project or ORACLE® PRIMAVERA® P6® focus on the management of project details, but do a rudimentary job of creating visual reports that are concise and are easy for laypeople to understand. Reporting out of these project management software applications has little ability to apply meaningful sets of data-driven shapes, colors, border formats, sizes,...

Claims


Application Information

Patent Timeline
Patent Type & Authority Applications(United States)
IPC IPC(8): G06F3/0484
CPCG06F3/0484G06Q10/06316G06F3/0481G06Q10/06G06Q10/0631G06Q10/1097
Inventor BLACK, SAFFORD T.BLACK, JAMES L.
Owner CHRONICLE GRAPHICS
Why Eureka
Try Eureka