System and method of compiling and organizing power consumption data and converting such data into one or more user actionable formats

a power consumption and data technology, applied in the field of granular power monitoring and data analytics, can solve the problems of high cost, difficult to achieve, and difficult to achieve, and achieve the effect of improving the granularity of input data, improving the accuracy of short-term (and long-term) demand projections, and improving the accuracy of short-term demand forecasts

Inactive Publication Date: 2015-01-08
NEURIO TECH
View PDF26 Cites 115 Cited by
  • Summary
  • Abstract
  • Description
  • Claims
  • Application Information

AI Technical Summary

Benefits of technology

[0070]As such the data analytics in accordance with the present invention yield superior demand forecasts by “segmenting” user profiles and modeling their consumption behavior separately using increased input data granularity. With access to real time segmented data, accurate short term (and long term) demand projections are made more accurately which affords significant cost saving to a utility and ultimately to a consumer, whether that consumer be a family, a business or a manufacturing operation.

Problems solved by technology

This is not only onerous but of very limited use in terms of data spread.
The problem is that people do not want to incur the significant expense required to install power sensors on each of their appliances and electric loads.
a) while there is some value to the bulk aggregate data, it is not the definitive picture in energy management, in fact, it barely scratches the surface of what should be possible and available to power consumers; and
b) load disaggregation or cataloguing power usage at a granular level is difficult to currently achieve. Even if power sensors are attached onto every single appliance in a home, there is still the issue of the value of the produced raw data without further enhancements and value added.
Furthermore, there is a growing tendency towards unbundling the power system as different sectors of the industry (generation, transmission, and distribution) are faced with increasing demand on planning management and operations of the networks.

Method used


Image

  • System and method of compiling and organizing power consumption data and converting such data into one or more user actionable formats
  • System and method of compiling and organizing power consumption data and converting such data into one or more user actionable formats
  • System and method of compiling and organizing power consumption data and converting such data into one or more user actionable formats

Examples


case 1

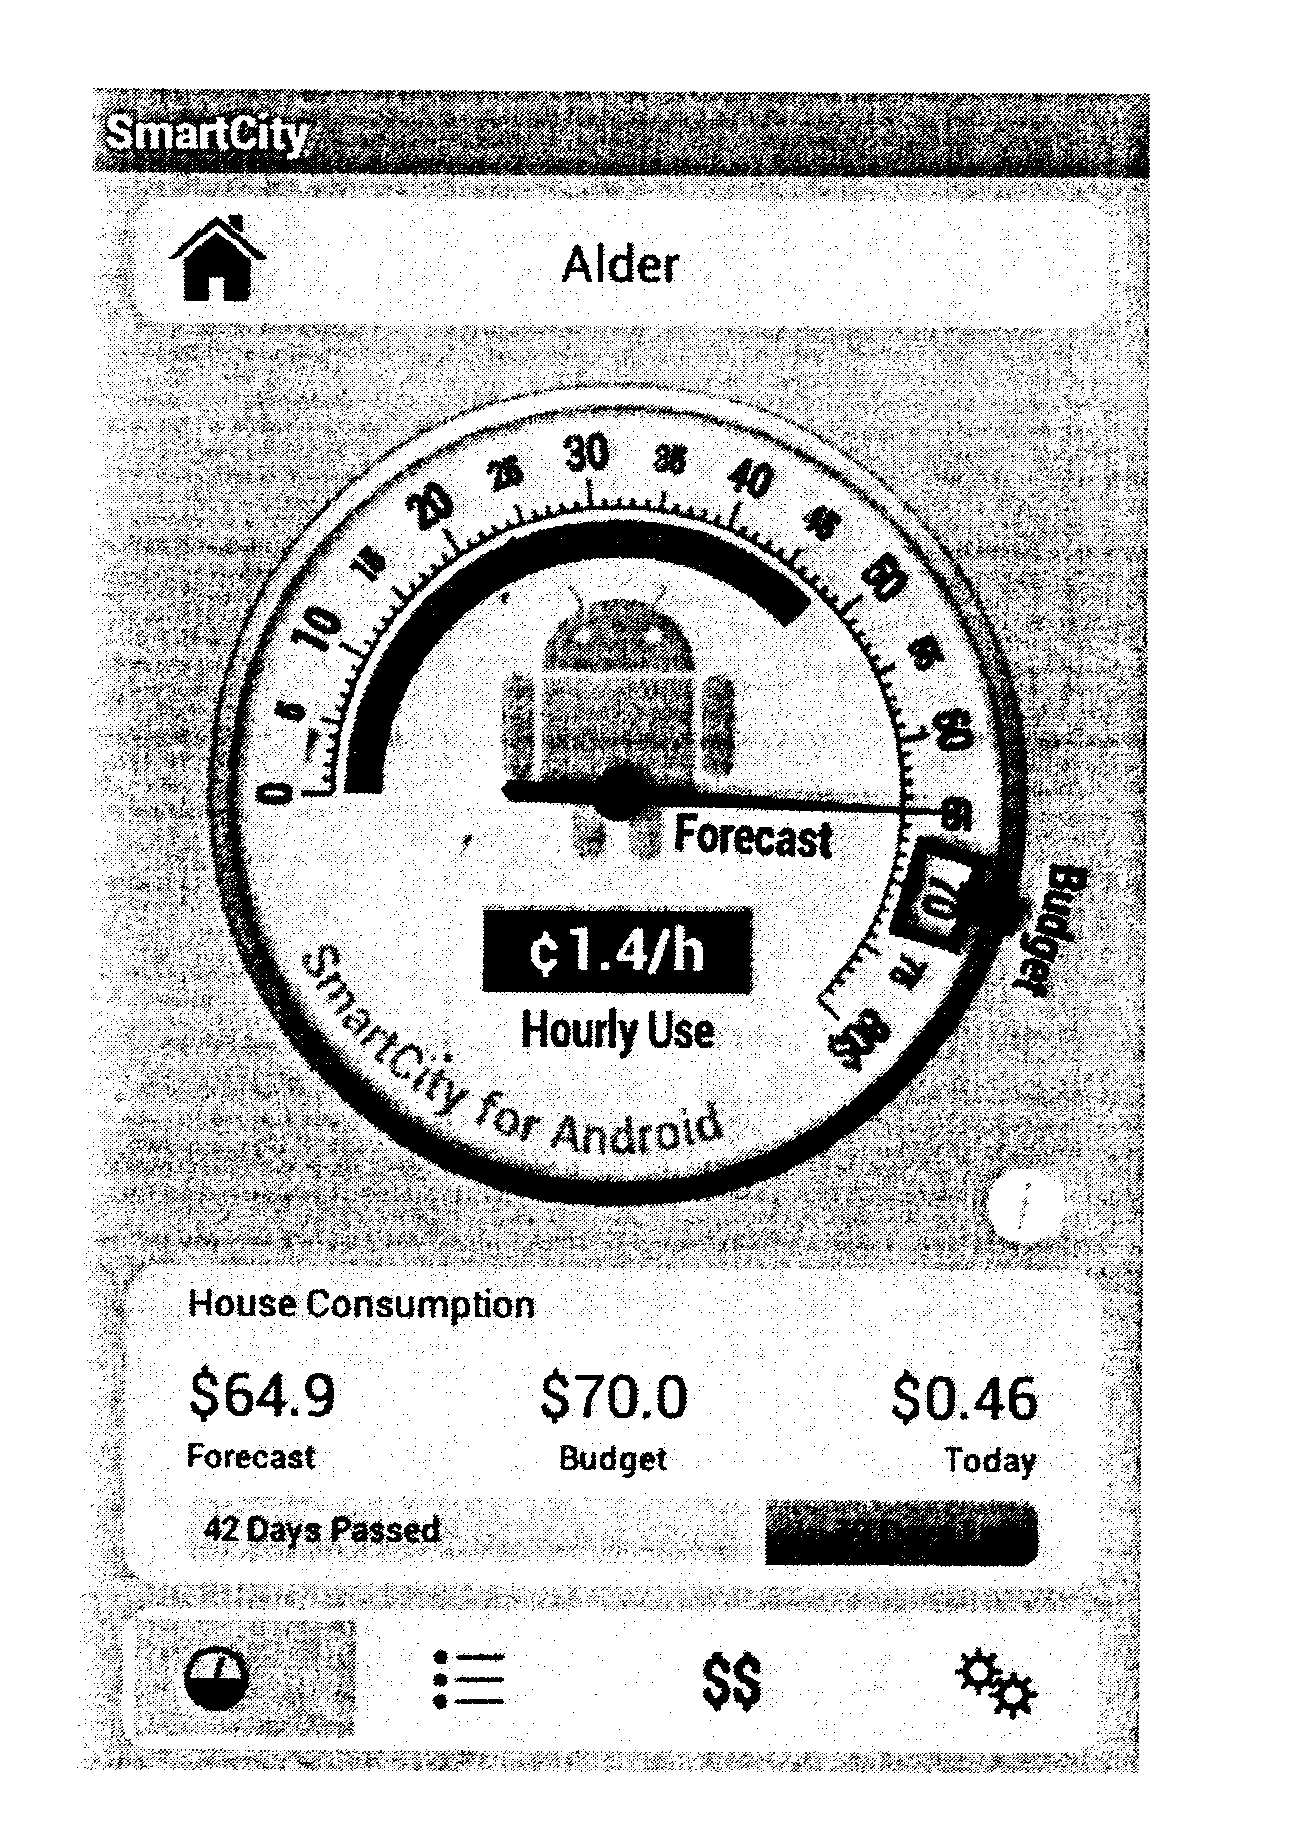
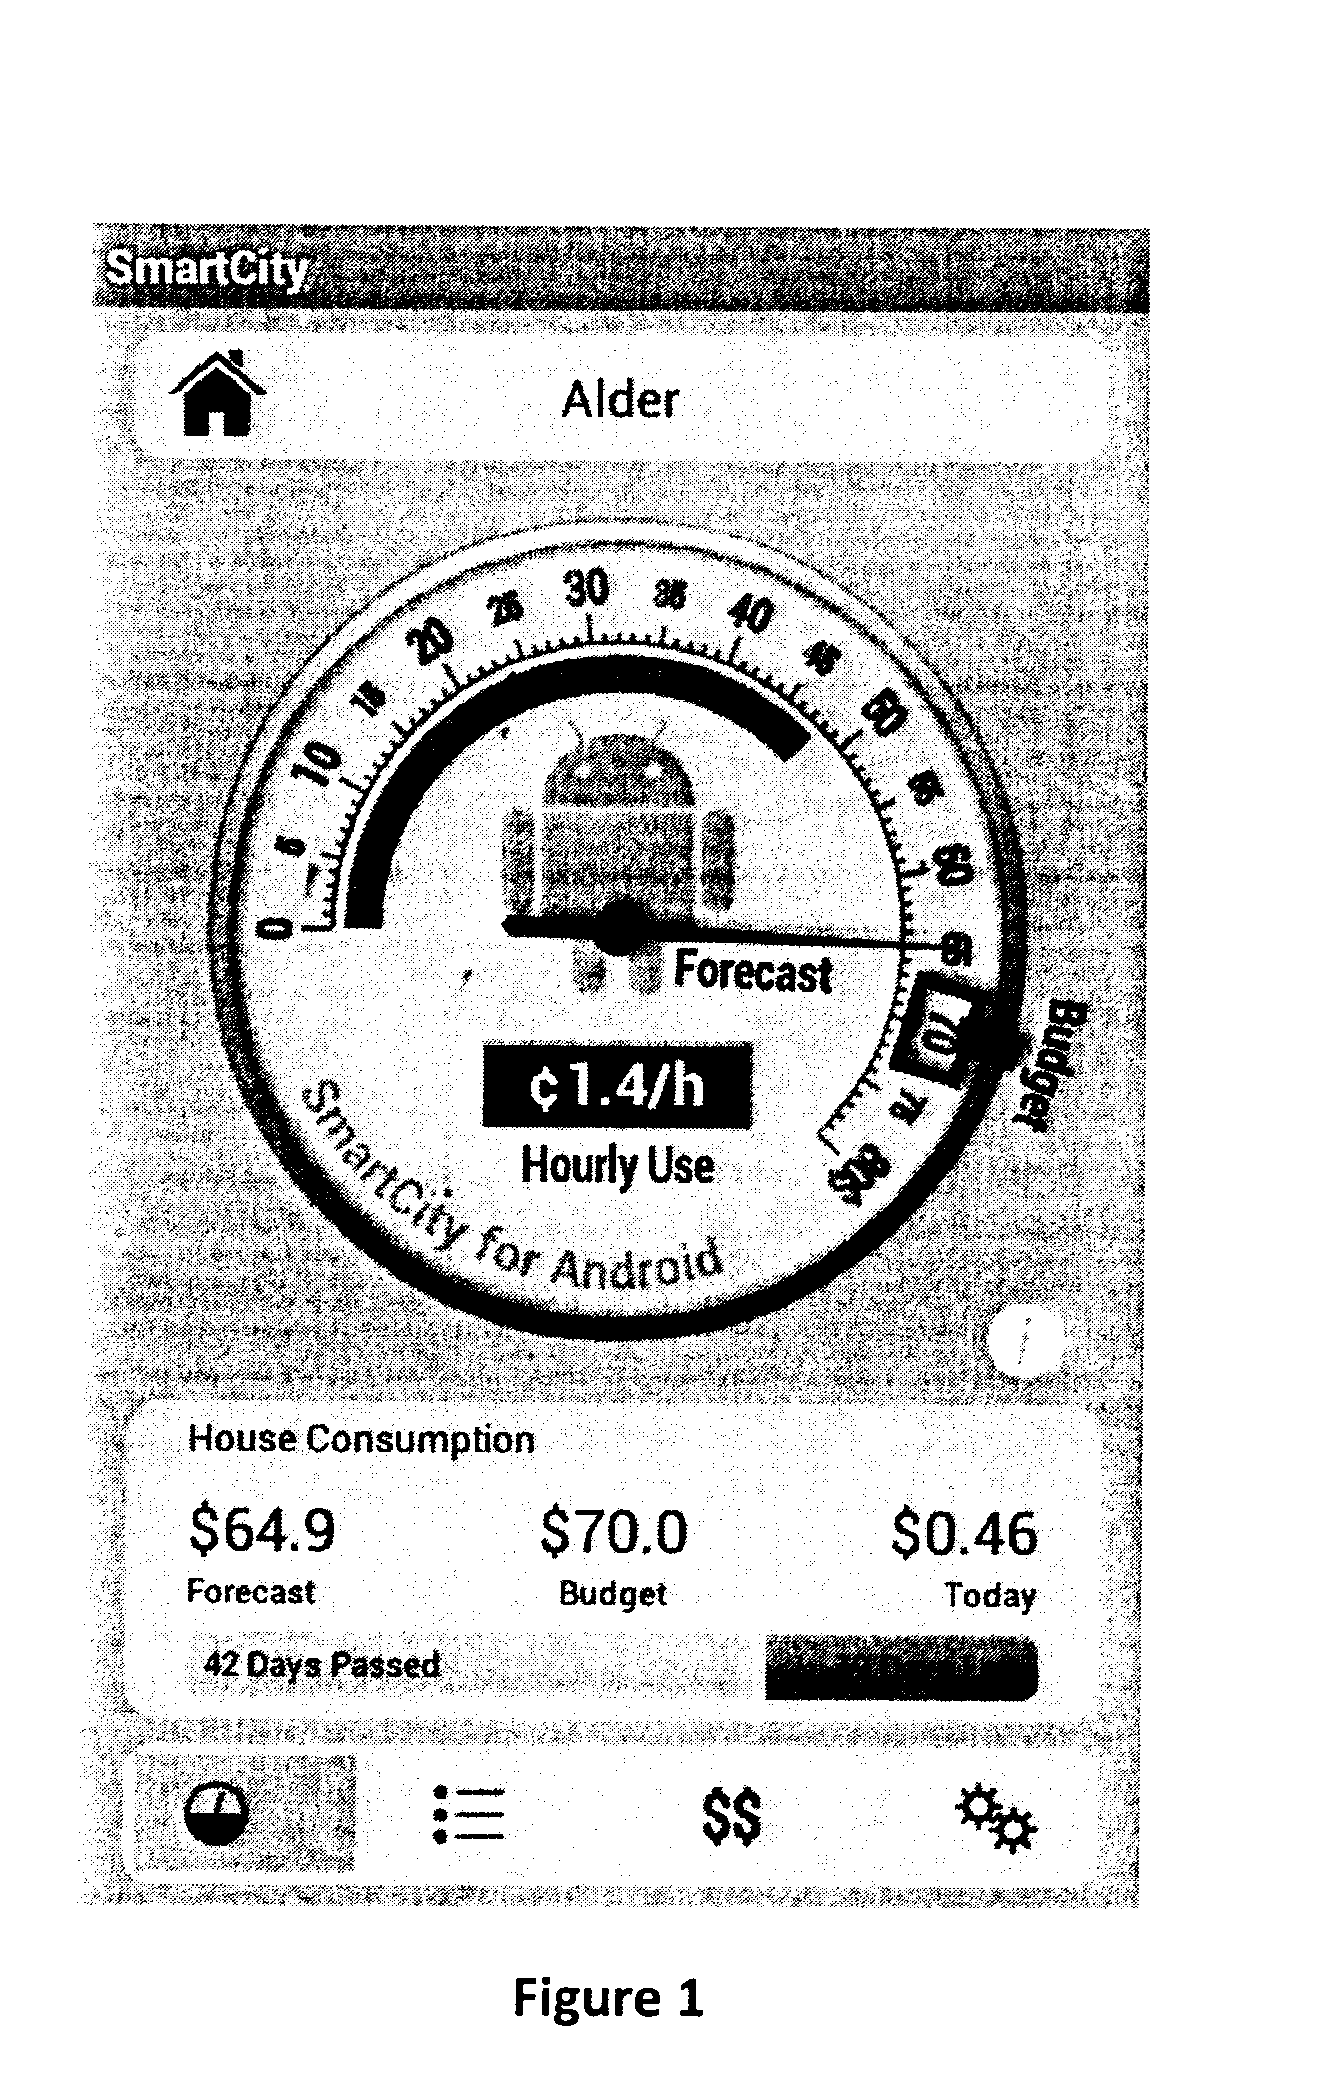
[0301) If the unconsumed budget is more than forecasted spending: the extra money will be divided between all remaining hours, proportional to the forecast deviation. For instance, since the deviation is small during sleeping hours, not much of the extra money will be devoted to those hours since the user clearly does not need much room there. However, during hours where the user does not spend consistently, he / she will be given additional budget.

case 2

[0302) If there is some money left in the budget (unconsumed budget>0), yet the left-over is less than the forecasted consumption: this means that the user is over-consuming, so his / her hourly forecasted consumption should be reduced. When giving extra money to each hour, this was allocated proportionally to each hour's consumption deviation. However, when shrinking the consumption, the method and system of the present invention does it proportional to the forecasted consumption itself. That is because one end goal of Smart Budgeting is to encourage the user to adopt a more conservative behavior by saving at all times. Even during sleeping hours when the deviation is low, turning off an extra appliance might be the key in achieving the target bill, and therefore he / she is asked to lower every hour of consumption by a certain percentage rather than considering the deviation patterns.

case 3

[0303) Finally, if the amount of money spent so far is more than the total budget (remaining budget<0), then the user cannot achieve his / her goal and a $0 budget for every remaining hour is specified.

[0304]The above policies are implemented within the Smart Budgeting method and system and represented in the following equations:

F: forecasted spending ($),

F=∑t∈Qft·gt,

?(R>0·R≥F??=?·?+?·? / (?(u∈Q)??),“where”?=R-F?R>0·R<F??=?·?R / F?indicates text missing or illegible when filed

State Determination

[0305]Once the consumption budget of the remaining billing period is determined, the light indicator should decide whether the user is over-consuming (red or green light). The most important criterion for state determination is whether the consumption of this hour is less than or equal to this hour's budget:

rule#1:{under-consumption:Cnow·gnow≤Bnow•over-consumption:Cnow·gnow>Bnow

[0306]Considering the following scenario: a user's budget is $70. It is the 6th week of the 8-week long billin...


PUM


Abstract

A method and system for use in creating a profile of, managing and understanding power consumption in a premise of a user, wherein said premise comprises two or more power consuming devices comprises measuring, via at least one sensor, aggregate energy consumption at the premise, receiving at a mobile computing device comprising a data processor, said aggregated signal from the sensor, collecting and recording the aggregate signal over a plurality of time resolutions and frequencies, therein to create a predicted aggregate signal for each time x and frequency y, detecting changes in the predicted aggregate signal at time x an frequency y (detected consumption pattern changes) and conveying to at least one of the user, a utility company, and other third party a notification of detected consumption pattern changes.

Description

FIELD OF THE INVENTION[0001]The present invention relates to the field of granular power monitoring, data analytics and enhanced data use at both the consumer and industry levels.BACKGROUND OF THE INVENTION[0002]Energy management is a term that generally relates to or is implemented by systems, processes and devices in order to reduce energy consumption and understand energy consumption patterns. This can occur in private homes, in businesses, in factories / manufacturing facilities and in public-sector / government organizations, to name a few.[0003]From the perspective of an energy consumer, the process of monitoring, controlling, and conserving energy in a building or organization typically involves the following steps, with noted challenges and limitations:[0004]1. Metering (in some fashion) energy consumption and collecting the data.[0005]2. Understanding the raw data and / or collecting data that is useful.[0006]3. Finding opportunities to save energy, and estimating how much energy...

Claims


Application Information

Patent Timeline
Patent Type & Authority Applications(United States)
IPC IPC(8): G06Q50/06H04L29/08
CPCH04L67/30G06Q50/06G06Q30/02G05B19/048G05B2219/2639
Inventor HAGHIGHAT-KASHANI, ALICHEAM, JANICE TZE-NEEHALLAM, JONATHAN MARK
Owner NEURIO TECH
Why Eureka
Try Eureka