Optical network visualization and planning

a network visualization and optical network technology, applied in the field of optical network visualization and planning, can solve the problems of inability to adapt to the adaptive bit rate signaling technology, the inability to use the flexible grid, and the inability to use the spreadsheet. the effect of easy understanding

Active Publication Date: 2017-12-07
CIENA
View PDF20 Cites 19 Cited by
  • Summary
  • Abstract
  • Description
  • Claims
  • Application Information

AI Technical Summary

Benefits of technology

This patent describes a way to plan and optimize how different colors of light are used in optical networks. It uses a special system that lets people see things clearly and easily understand what parts of the network have too much or too little use of certain resources like space and power. This makes it easier for engineers to fix problems and make better decisions about where to place new equipment.

Problems solved by technology

The technical problem addressed in this patent is the difficulty and impracticality of manually assigning wavelengths or spectra in optical networks due to the growing complexities of these networks and the limitations of current tools like spreadsheets. There is a need for more efficient and automatic methods that take into account flexibility and adaptability in new technology platforms.

Method used


Image

  • Optical network visualization and planning
  • Optical network visualization and planning
  • Optical network visualization and planning

Examples


Embodiment Construction

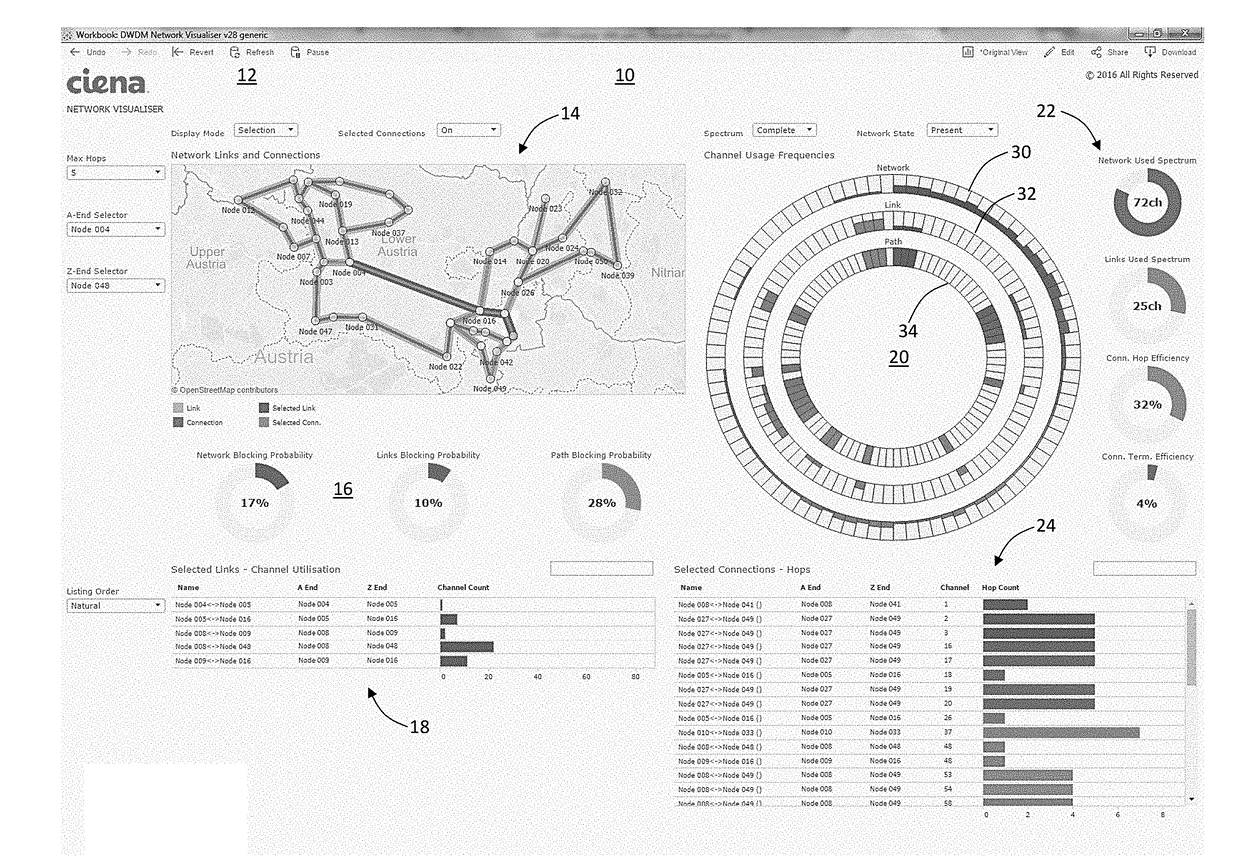
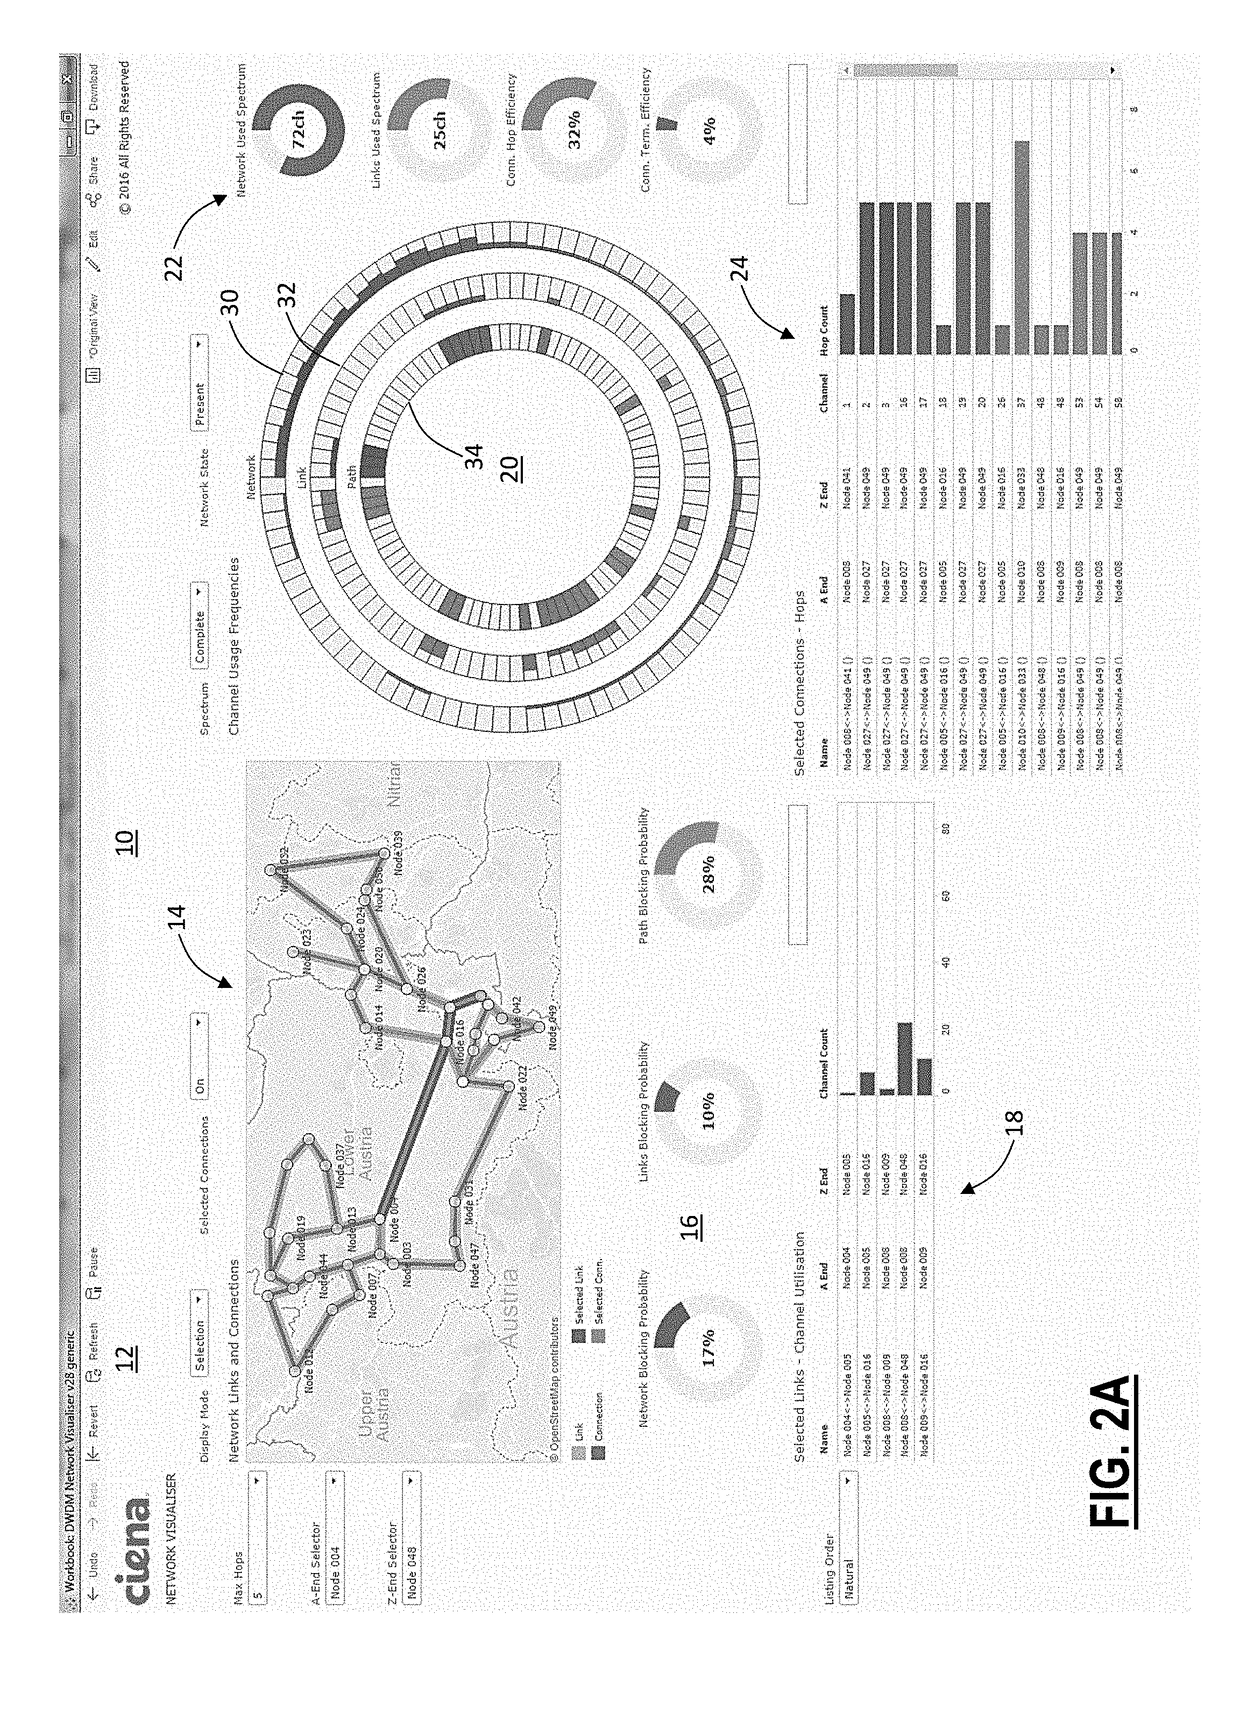
[0024]Again, in various exemplary embodiments, the present disclosure relates to visualization, planning and optimization of wavelength usage and assignment in optical networks. Specifically, a method, a server, and software stored in a non-transitory computer-readable medium are described for implementing a visualization tool which provides network operators succinct visual indications and understanding related to the spectrum usage and resource efficiencies in an optical network (and potentially higher layers), of any size or topology, via an all-in-one Graphical User Interface (GUI). The key is the visualization tool provides a great deal of information in an extremely compact and easy to understand form, at all scales from node and link to the entire network, using concentric circular bar graphs to represent the spectrum in the overall network, on any paths between two points A-Z and on a specific path.

[0025]The visualization tool can be cloud-hosted, accessible via any type of ...


PUM


Abstract

Computer-implemented systems and methods for visually presenting spectrum usage of optical spectrum in an optical network include displaying a network map of the optical network comprising a plurality of nodes and a plurality of links connecting the plurality of nodes to one another; responsive to obtaining spectrum data comprising channel assignments on the plurality of links and nodes as endpoints of the associated channel assignments, displaying a plurality of circular histograms to visually illustrate spectrum usage in the optical network; and adjusting the plurality of circular histograms based on selections of a plurality of endpoints in the optical network. The plurality of circular histograms visually represent the spectrum usage by representing the optical spectrum in the optical network around the associated circular histogram, and wherein each portion or segment of the plurality of circular histograms represents one of a wavelength and a portion of spectrum.

Description


Claims


Application Information

Patent Timeline
Owner CIENA
Why Eureka
Try Eureka