
Dimension grouping and reduction for model generation, testing, and documentation

a technology of dimension grouping and reduction, applied in the field of data analysis grouping of data points, can solve problems such as particularly problematic for business users

Active Publication Date: 2018-10-04
SYMPHONYAI SENSA LLC
View PDF0 Cites 35 Cited by
  • Summary
  • Abstract
  • Description
  • Claims
  • Application Information

AI Technical Summary

Benefits of technology

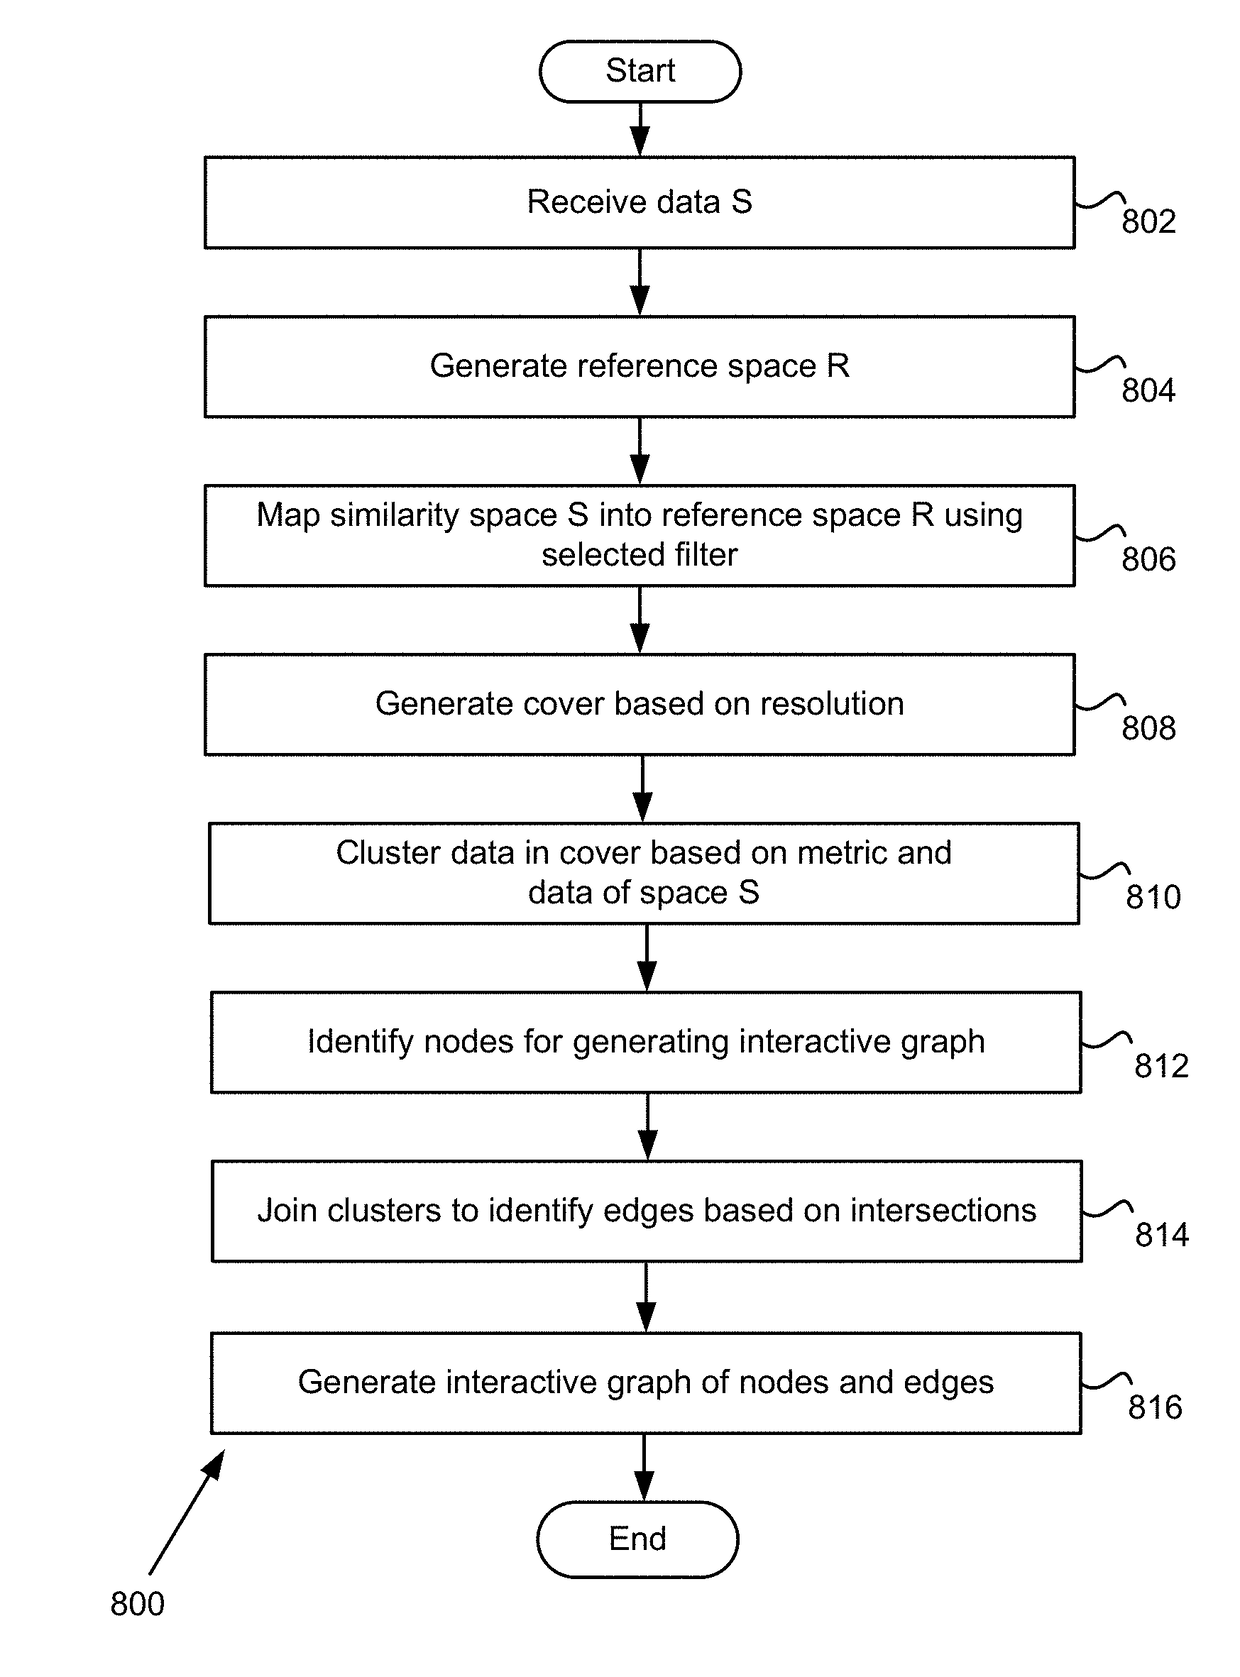
The patent describes a method for analyzing data and generating a model that can be used to make predictions about the data. The method involves receiving analysis data, identifying a subset of data points, mapping the data points to a reference space, and using a lens function to transform the data points. The method also involves identifying correlations between data points and grouping data points into groups based on those correlations. The method can be used to analyze data from various sources and can provide a more accurate model for making predictions about the data.

Problems solved by technology

This is particularly problematic for the business users.

Method used


Image

  • Dimension grouping and reduction for model generation, testing, and documentation
  • Dimension grouping and reduction for model generation, testing, and documentation
  • Dimension grouping and reduction for model generation, testing, and documentation

Examples


Embodiment Construction

3 (FIG. 19C) extends F1 (FIG. 19A).

[0339]Partition P on S is subordinate to F1 if and only if every element of P is in F1. The circled partition P1 of F4 depicted in FIG. 19D, is an example of a subordinate partition {e.g., {a,b,c},{d,e},{f}, and {g}} to F1.

[0340]Singletons(S) are denoted as the partition formed by taking {{x}|x in S}. That is, in the example in FIG. 19D, Singletons({a, b, c, d, e, f, g})={{a},{b},{c},{d},{e}, {f},{g} }. This is the same as the set of leaves of an atomic forest. Let U(P), where P is any collection of subsets of S, denote the union of all the elements of P. U(Singletons(S))==S.

[0341]Partition P′ on S is coarser than another partition P on S if and only if every element x′ in P′ is the union of elements x in P. In various embodiments, every partition on S is coarser than Singletons(S), and {S} is coarser than every partition on S. For instance, {{a,b,c},{d,e,f},{g} } is a coarser partition than {{a,b},{c},{d,e},{f},{g} }.

[0342]FIG. 20 is a block diagr...


PUM


Abstract

An example method includes receiving analysis data and output indicator, mapping data points from a transposition of the analysis data to a reference space, generating a cover of the reference space, clustering the data points mapped to the reference space using the cover and a metric function to determine each node of a plurality of nodes, for each node, identifying data points that are members to identify similar features, grouping features as being similar to each other based on node(s), for each feature, determining correlation with at least some data associated with the output indicator and generate a correlation score, displaying at least groupings of similar features and displaying the correlation scores, receiving a selection of features, generating a set of models based on selection, determining fit of each generated model to output data and generate a model score, and generating a model recommendation report.

Description

CROSS-REFERENCE TO RELATED APPLICATION[0001]The present application claims the benefit of U.S. Provisional Patent Application Ser. No. 62 / 418,709 filed Nov. 7, 2016 and entitled “Analytical Modeling, Fitting and Optimized Selection,” which is hereby incorporated by reference herein.BACKGROUND1. Field of the Invention[0002]Embodiments of the present invention(s) are directed to grouping of data points for data analysis and more particularly to generating a graph utilizing improved groupings of data points based on scores of the groupings.2. Related Art[0003]As the collection and storage data has increased, there is an increased need to analyze and make sense of large amounts of data. Examples of large datasets may be found in financial services companies, oil expiration, biotech, and academia. Unfortunately, previous methods of analysis of large multidimensional datasets tend to be insufficient (if possible at all) to identify important relationships and may be computationally ineffi...

Claims


Application Information

Patent Timeline
IPC IPC(8): G06K9/62G06N7/00G06F17/15G06F17/30G06Q10/06
CPCG06K9/623G06N7/00G06F17/153G06F17/30991G06F17/30958G06Q10/06375G06F16/254G06F16/9024G06F16/9038G06F18/2113
Inventor SINGH, GURJEETHORTON, NOAHEAKIN, BRYCE
Owner SYMPHONYAI SENSA LLC
Learn More