User interface for manipulating a data set

a data set and user interface technology, applied in the field of user interface for manipulating a data set, can solve the problems of reducing the space available for the data display region, unable to be easily changed by a user, and directing user's attention away from the data, so as to minimise the number and complexity of interactions and small screens

a data set and user interface technology, applied in the field of user interface for manipulating a data set, can solve the problems of reducing the space available for the data display region, unable to be easily changed by a user, and directing user's attention away from the data, so as to minimise the number and complexity of interactions and small screens

US20190050117A1Inactive Publication Date: 2019-02-14NUMERABLE SOFTWARE LTD

Image

  • User interface for manipulating a data set
  • User interface for manipulating a data set
  • User interface for manipulating a data set

Examples


Embodiment Construction

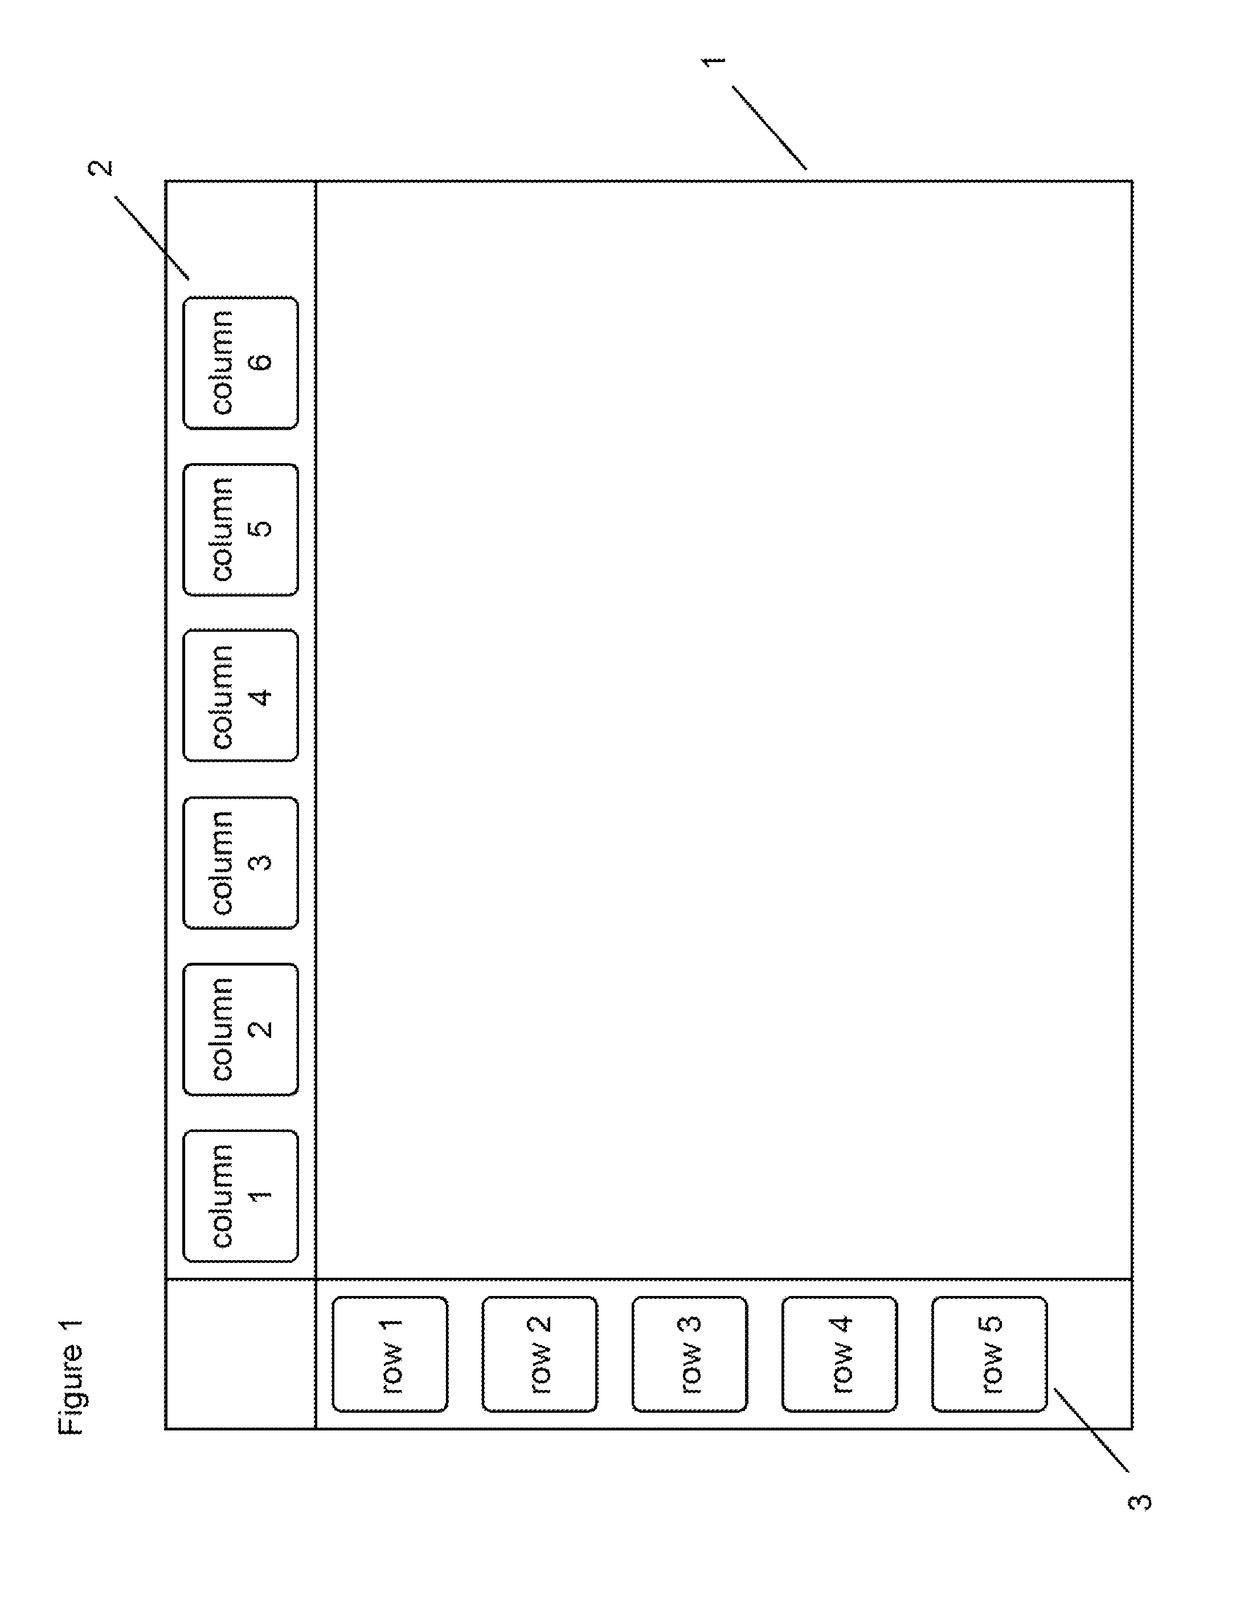
[0054]FIG. 1 is a schematic representation of a user interface for manipulating a data set. The user interface includes a data display region 1 and a first set of user selectable user interface elements arranged in a row, which in the schematic illustration of FIG. 1 take the form of six column headers 2. The column headers 2 represent values of a first variable in a data set, such as time periods, and are arranged horizontally towards the top of the data display region 1.

[0055]The user interface further includes a second set of user interface elements, which in the schematic illustration of FIG. 1 take the form of five row headers 3. The row headers 3 represent values of a second variable in the data set, such as a category or type of data, and are arranged towards the left edge of the data display region 1.

[0056]As will be described in more detail below, the user can select a column header 2 (using, for example, a click of a mouse button when a pointer is positioned over the colum...


PUM


Abstract

A user interface for manipulating a data set comprising at least two data points, wherein each data point has at least three variables, the user interface comprising a data display region, a first set of selectable user interface items arranged in a row and representing values of a first variable of the data set, and a second set of selectable user interface items arranged in a column and representing values of a second variable of the data set, wherein the user selectable user interface items of the first and second sets can be used to manipulate representations of the data set presented in the data display region. The user interface is compact, intuitive and straightforward to learn and use, and requires minimal user interactions to configure a plot. Using the user interface, complex data sets having three or more variables can be visualised quickly and easily.

Description

[0001]This application claims the benefit of and priority to United Kingdom Patent Application No. 1712773.9, filed on Aug. 9, 2018, the contents of which are incorporated herein by reference.TECHNICAL FIELD[0002]The present invention relates to a user interface for manipulating a data set.BACKGROUND OF THE INVENTION[0003]Plots and graphs are widely used to represent data. They show data as graphical elements whose size, position, colour or other characteristics relate to the values of and relationships between the data variables. They help people understand patterns and information in the data set, such as trends, correlations, grouping and outliers, and can do so more effectively than lists or tables of numbers.[0004]A wide variety of types of computer software is available to generate plots. These include standard products like spreadsheets (e.g. Microsoft Excel), business intelligence software (e.g. Microsoft Power BI, Tableau, Qlik), technical software (e.g. MATLAB) and general...

Claims


Application Information

Patent Timeline
14 Feb 2019
Publication
US20190050117A1
IPC
G06F3/0482; G06F3/0488; G06F3/0484
CPC
G06F3/0482; G06F3/04886; G06F3/04845; G06F3/04847; G06F16/2423; G06F16/235; G06T11/206; G06F40/18
Inventors
COULTHARD, MARTIN