
Multivariate responses using classification and regression trees systems and methods

Inactive Publication Date: 2006-02-21
GENERAL ELECTRIC CO
View PDF24 Cites 38 Cited by
  • Summary
  • Abstract
  • Description
  • Claims
  • Application Information

AI Technical Summary

Benefits of technology

[0004]The present invention is, in one aspect, a method of allowing inclusion of more than one variable in a Classification and Regression Tree (CART) analysis. The method includes predicting y using p exploratory variables, where y is a multivariate response vector.

Problems solved by technology

Commercially available tools for CART analysis exist, however, there is no known tool that allows the user to build a model that predicts more than one measurement at a time (i.e., more than one response in a CART application).

Method used


Image

  • Multivariate responses using classification and regression trees systems and methods
  • Multivariate responses using classification and regression trees systems and methods
  • Multivariate responses using classification and regression trees systems and methods

Examples


Embodiment Construction

[0011]Classification and Regression Tree (CART) analysis is founded on the use of p explanatory variables, X1, X2, . . . , Xp, to predict a response, y, using a multi-stage, recursive algorithm as follows:

[0012]1. For each node, P, evaluate every eligible split, s, of the form Xi∈S, Xi∉S, on each predictor variable, by associating a split function, φ(s,P)≧0 which operates on P. The split forms a segregation of data into two groups. The set S can be derived in any useful way.

[0013]2. Choose the best split for each node according to φ(s,P). This could be the maximum or minimum split function value for that node, for example. Each split produces two child nodes.

[0014]3. Repeat 1 and 2 for each child node.

[0015]4. Stop when apriori conditions are met.

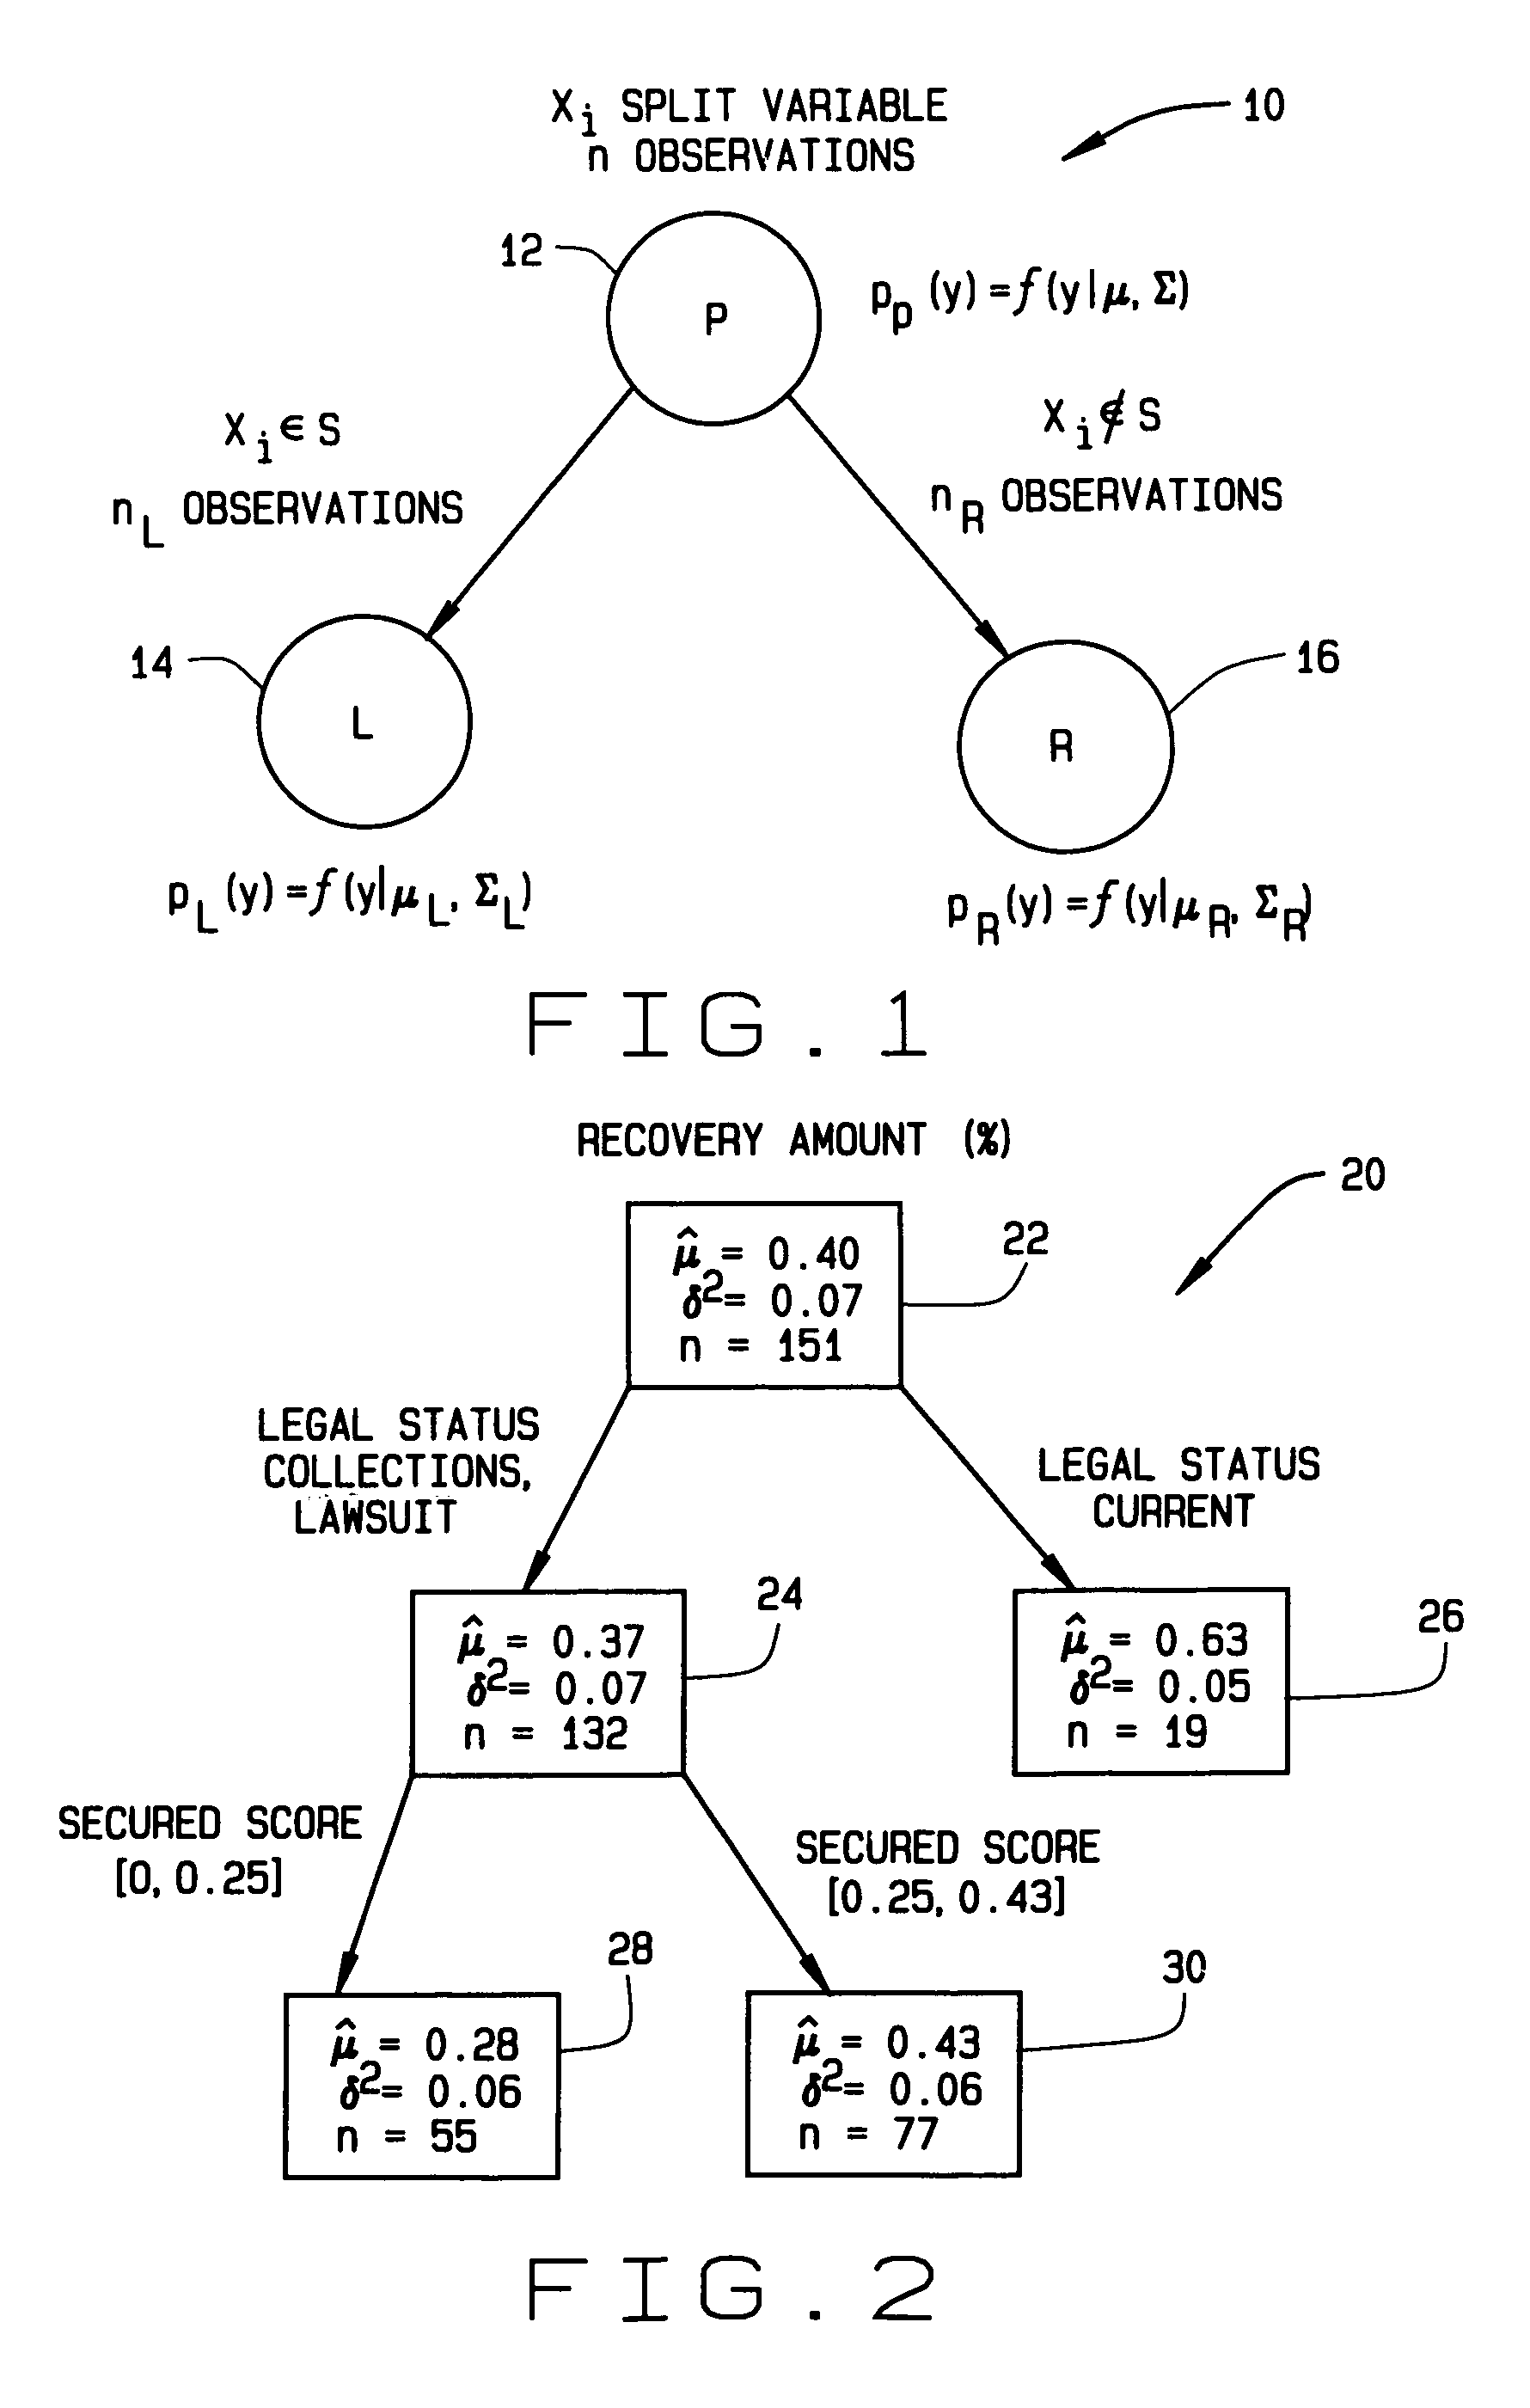
[0016]FIG. 1 illustrates a single split 10 where a heterogeneous parent node, P, 12 is observed to identify a split that is used to segregate a heterogeneous parent node, 12 into more homogeneous child nodes, such as node L 14 and node R 16...


PUM


Abstract

The present invention is a method of allowing inclusion of more than one variable in a Classification and Regression Tree (CART) analysis. The method includes predicting y using p exploratory variables, where y is a multivariate, continuous response vector, describing a probability density function at “parent” and “child” nodes using a multivariate normal distribution, which is a function of y, and defining a split function where “child” node distributions are individualized, compared to the parent node. In one embodiment a system is configured to implement the multivariate CART analysis for predicting behavior in a non-performing loan portfolio.

Description

BACKGROUND OF THE INVENTION[0001]This invention relates generally to prediction of responses using mathematical algorithms for quality measurements and more specifically to the use of Classification and Regression Tree (CART) analysis for prediction of responses.[0002]In a financing example, an amount collected on a charged off loan is a function of many demographic variables, as well as historic and current information on the debtor. If one desired to predict the amount paid for an individual borrower, a statistical model need be built from an analysis of trends between the account information and the amount paid by “similar” borrowers, that is, borrowers with similar profiles. CART tools allow an analyst to sift, i.e. data mine, through the many complex combinations of these explanatory variables to isolate which ones are the key drivers of an amount paid.[0003]Commercially available tools for CART analysis exist, however, there is no known tool that allows the user to build a mod...

Claims


Application Information

Patent Timeline
IPC IPC(8): G06Q40/00G06F17/18
CPCG06F17/18G06Q40/00G06Q40/04G06Q40/025G06Q40/02G06Q40/03
Inventor KEYES, TIM K.
Owner GENERAL ELECTRIC CO
Learn More