
System and method for visualization of continuous attribute values

a continuous attribute and attribute value technology, applied in the field of user interfaces, can solve the problems of difficulty in analyzing the access patterns of thousands of users, difficulty in practical difficulties, and inability of web masters to include advertisements directed to teenagers on a certain web page, so as to improve user experience, improve user experience, and reduce costs. cost

Inactive Publication Date: 2006-04-11
MICROSOFT TECH LICENSING LLC
View PDF0 Cites 12 Cited by
  • Summary
  • Abstract
  • Description
  • Claims
  • Application Information

AI Technical Summary

Problems solved by technology

However, it may be very difficult for the web master to analyze the access patterns of thousands of users involving possibly hundreds of web pages.
However, the web master may not want to include advertisements directed to teenagers on a certain web page if users in a different category who are senior citizens who also happen to access that web page frequently.
Yet, a practical difficulty has arisen.
While both cluster models and classification models can be extracted from data, such as on-line consumer transaction data, through well-known conventional machine-learning techniques, it has proven to be rather difficult to present category data in a simple meaningful and easily understood manner, for example, to a business manager who is making marketing or other decisions based on that data.
However, textual data, particularly if it is voluminous, which is very often the case with consumer purchasing data, is extremely tedious to quickly comprehend (i.e., “digest”) particularly when looking for trends or other relationships that are “hidden” in the data.
The resulting categories provide little, if any and often no, physically discernible basis in reality, i.e., the qualitative meaning and physical distinctions (apart from differences in mathematical metrics) between different categories are unclear, if not very difficult, to comprehend.
In essence, the question of “What do the categories represent?” can become very difficult for the data analyst to answer.
Hence, useful distinctions effectively become lost in the results, thus frustrating not only a data analyst who is then working with that data but also ultimately a business manager who, in an effort to reduce business risk, may need to make costly marketing and sales decisions, such as how to effectively market a given product and to whom and when, based on that data.
Thus far, the visualization tools available in the art for depicting clusters and their inter-relationships have proven to be quite deficient in practice in meeting this need, particularly, though certainly not exclusively, when utilized in an electronic commerce setting.

Method used


Image

  • System and method for visualization of continuous attribute values
  • System and method for visualization of continuous attribute values
  • System and method for visualization of continuous attribute values

Examples


Embodiment Construction

Overview

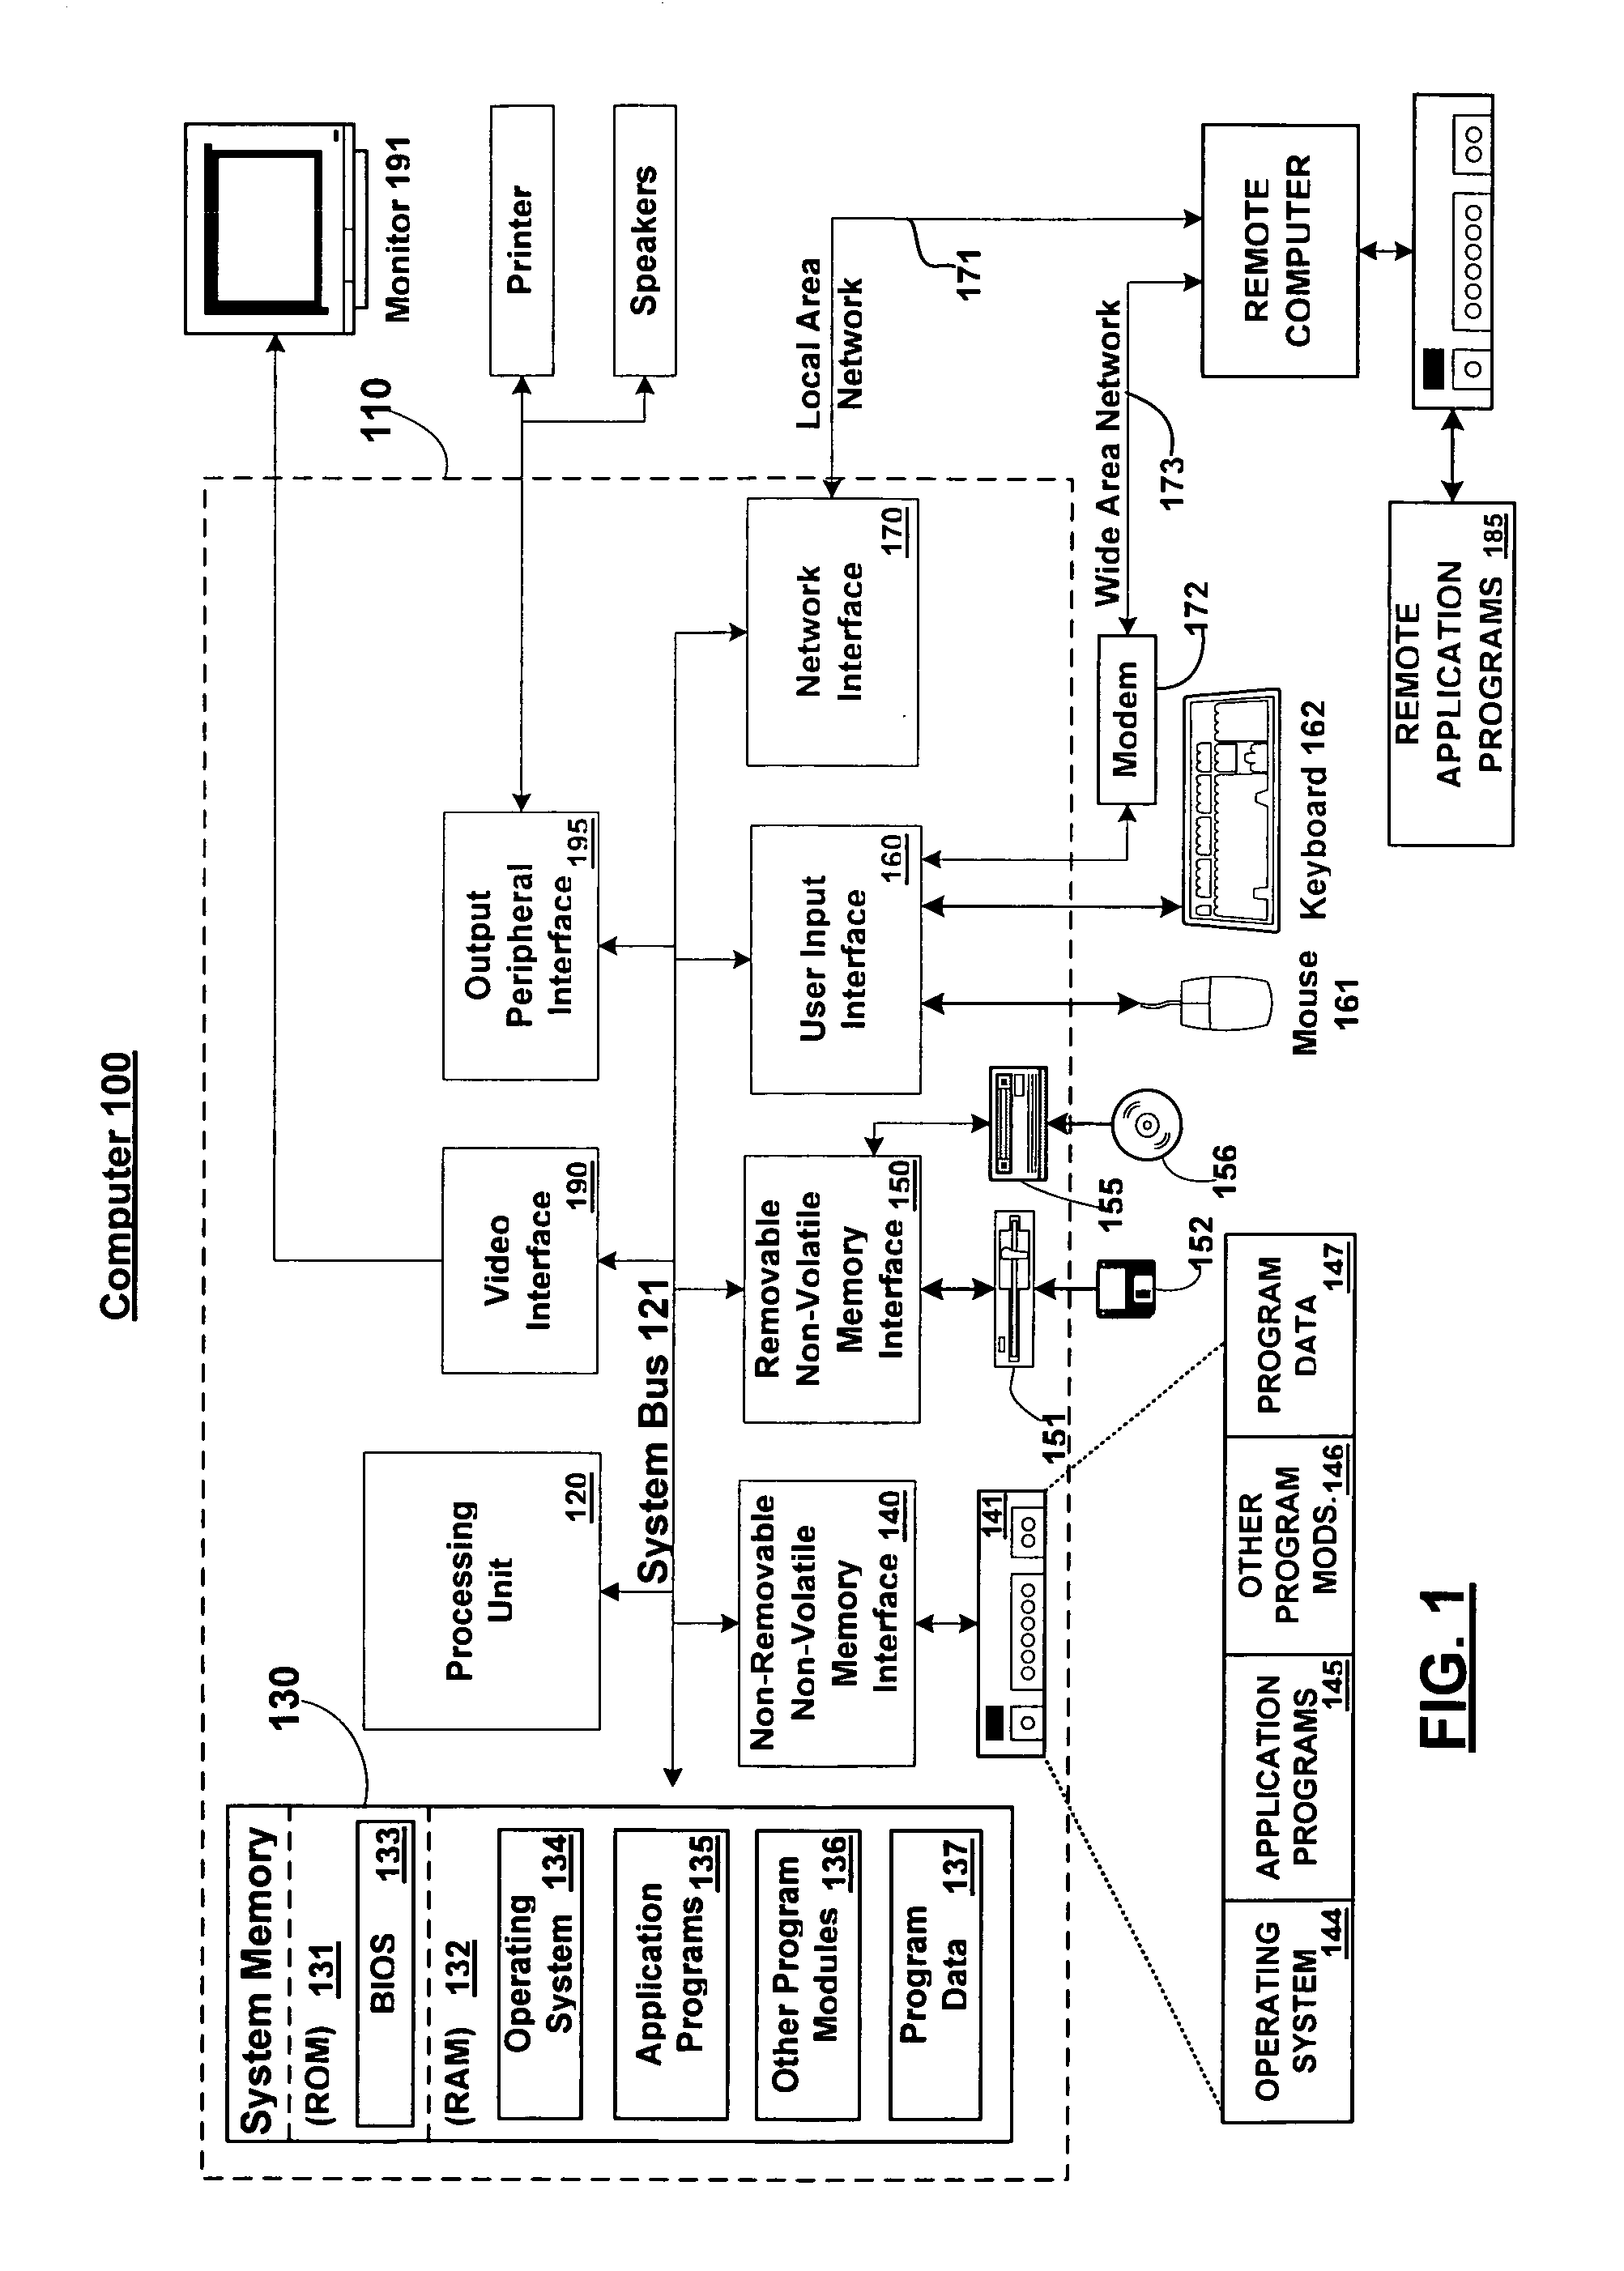
[0033]As described in the background, conventionally, tools for analyzing category data are not capable of providing useful visual information about categories and their inter-relationships.

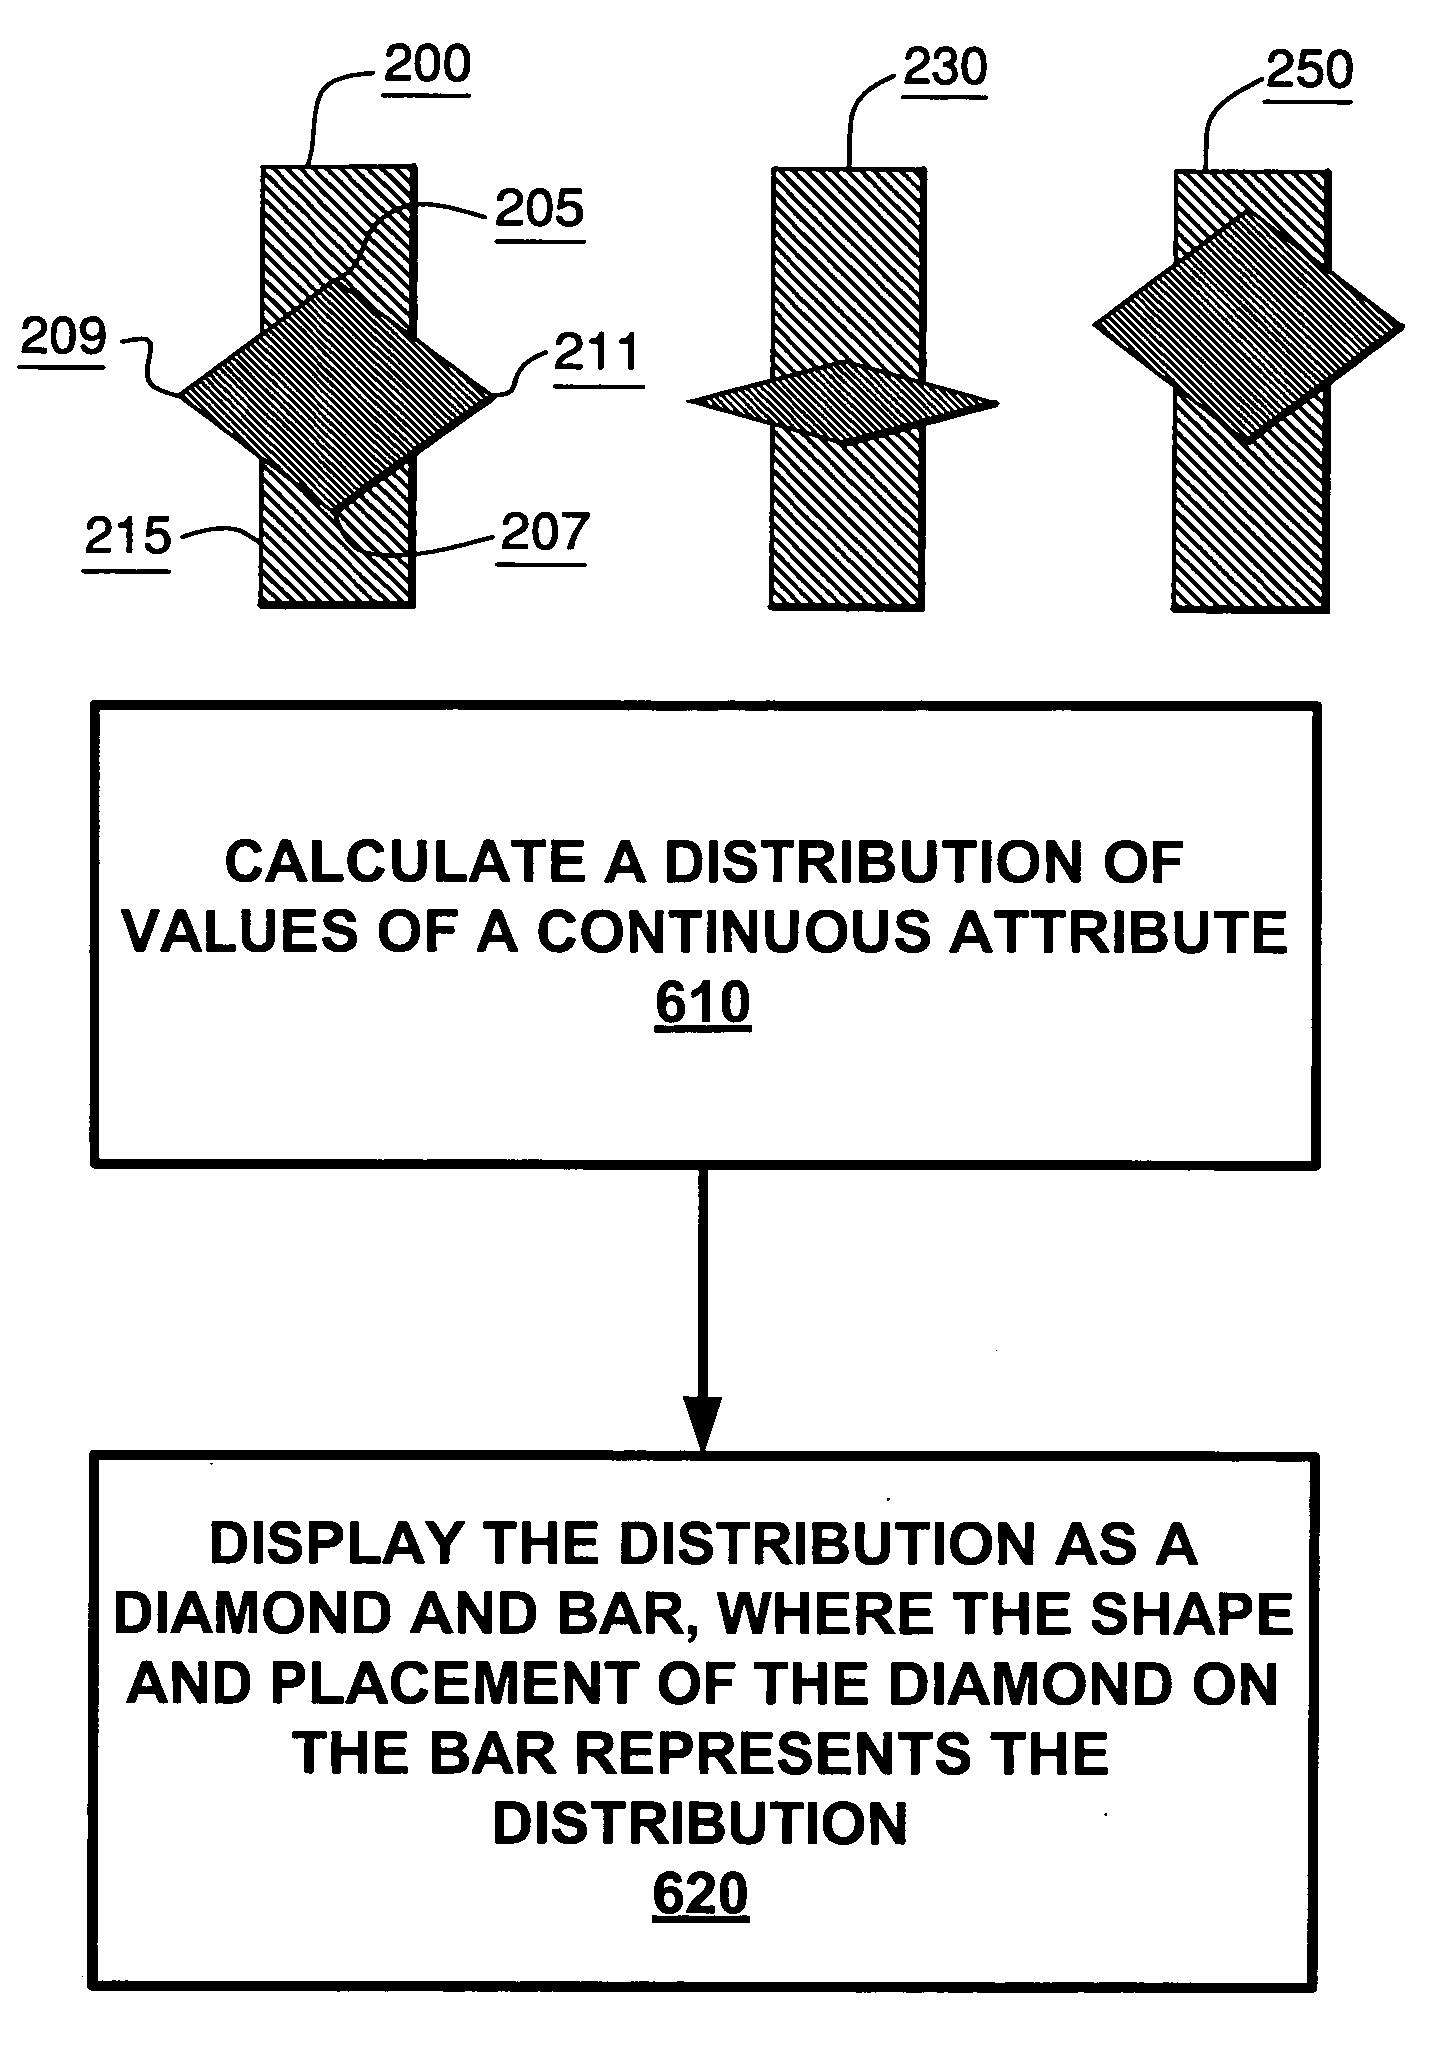
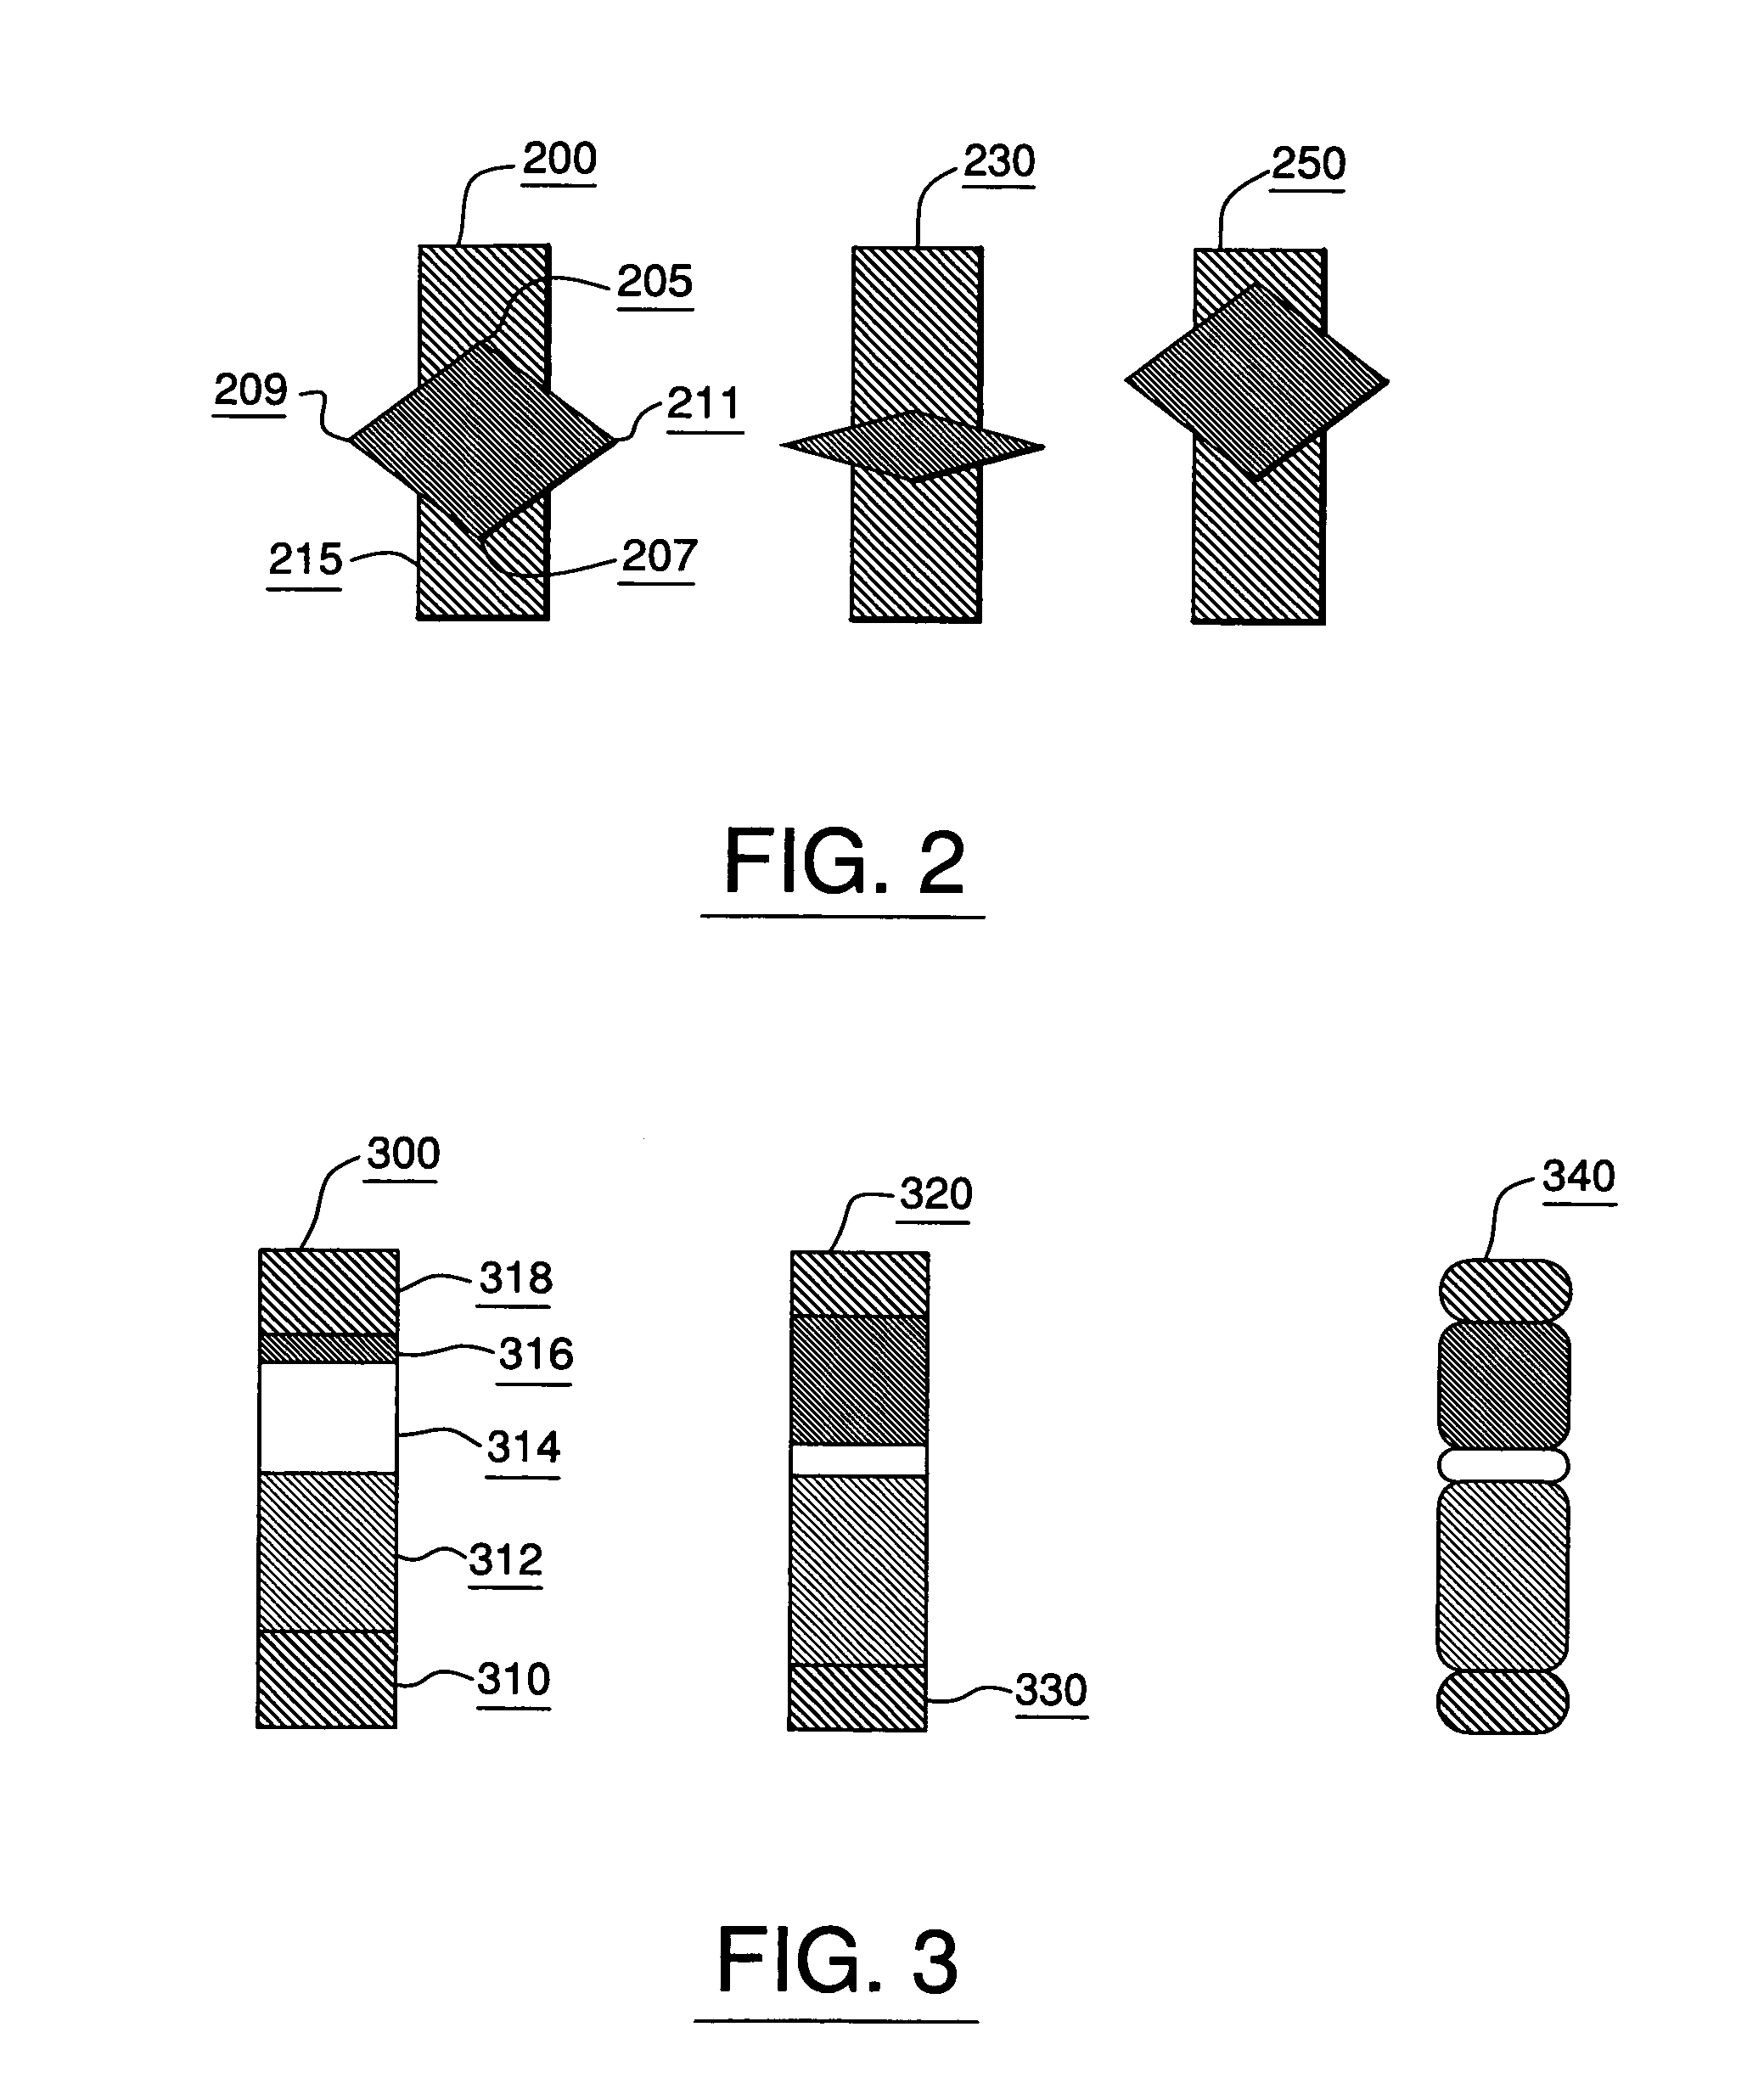
[0034]Distribution displays for categories are provided which illuminate the distribution of continuous attributes over all cases in a category, and which provide a histogram of the population of the different states of categorical attributes. An array of such displays by attribute (in one dimension) and category (in another dimension) may be provided in order to provide an easy method of comparison of distributions of an attribute between categories, and to provide an easy method of comparison of the distributions of all attributes in a category.

[0035]Category diagram displays are also provided. These diagrams provide a method for visualizing the different categories, and their distributions, populations, and similarities. These are displayed by using different shading of nodes represent...


PUM


Abstract

Distribution displays for categories are provided which illuminate the distribution of continuous attributes over all cases in a category, and which provide a histogram of the population of the different states of categorical attributes. An array of such displays by attribute (in one dimension) and category (in another dimension) may be provided. Category diagram displays are also provided for visualizing the different categories, and their distributions, populations, and similarities. These are displayed through different shading of nodes and edges representing categories and the relationship between two categories, and through proximity of nodes.

Description

FIELD OF THE INVENTION[0001]The present invention relates to user interfaces, and more specifically, to user interfaces for the visualization of categories of data.BACKGROUND OF THE INVENTION[0002]Computer systems have long been used for data analysis. For example, data may include demographics of users and web pages accessed by those users. A web master (i.e., a manager of a web site) may desire to review web page access patterns of those users in order to optimize links between various web pages or to customize advertisements to the demographics of the users. However, it may be very difficult for the web master to analyze the access patterns of thousands of users involving possibly hundreds of web pages. However, this difficulty may be lessened if the users can be categorized by common demographics and common web page access patterns.[0003]Two techniques of data categorization—classification and clustering—can be useful when analyzing large amounts of such data. These categorizati...

Claims


Application Information

Patent Timeline
Patent Type & Authority Patents(United States)
IPC IPC(8): G06F17/00G09G5/22G06T11/20
CPCG06T11/206Y10S707/917Y10S707/99945G06F16/58G06F16/5838G06F16/5854
Inventor CHICKERING, DAVID MAXWELLTANG, ZHAOHUIHECKERMAN, DAVID EARLROUNTHWAITE, ROBERT L.BOCHAROV, ALEXEI V.OVESON, SCOTT CONRAD
Owner MICROSOFT TECH LICENSING LLC
Learn More