Method and article for interactive data exploration

a data exploration and interactive technology, applied in the field of visual tools for data exploration, can solve the problems of user's computer system raising security concerns, unable to execute most applications in the context of a browser, and undesirable approaches

Inactive Publication Date: 2008-04-22
ORACLE INT CORP
View PDF9 Cites 15 Cited by
  • Summary
  • Abstract
  • Description
  • Claims
  • Application Information

AI Technical Summary

Benefits of technology

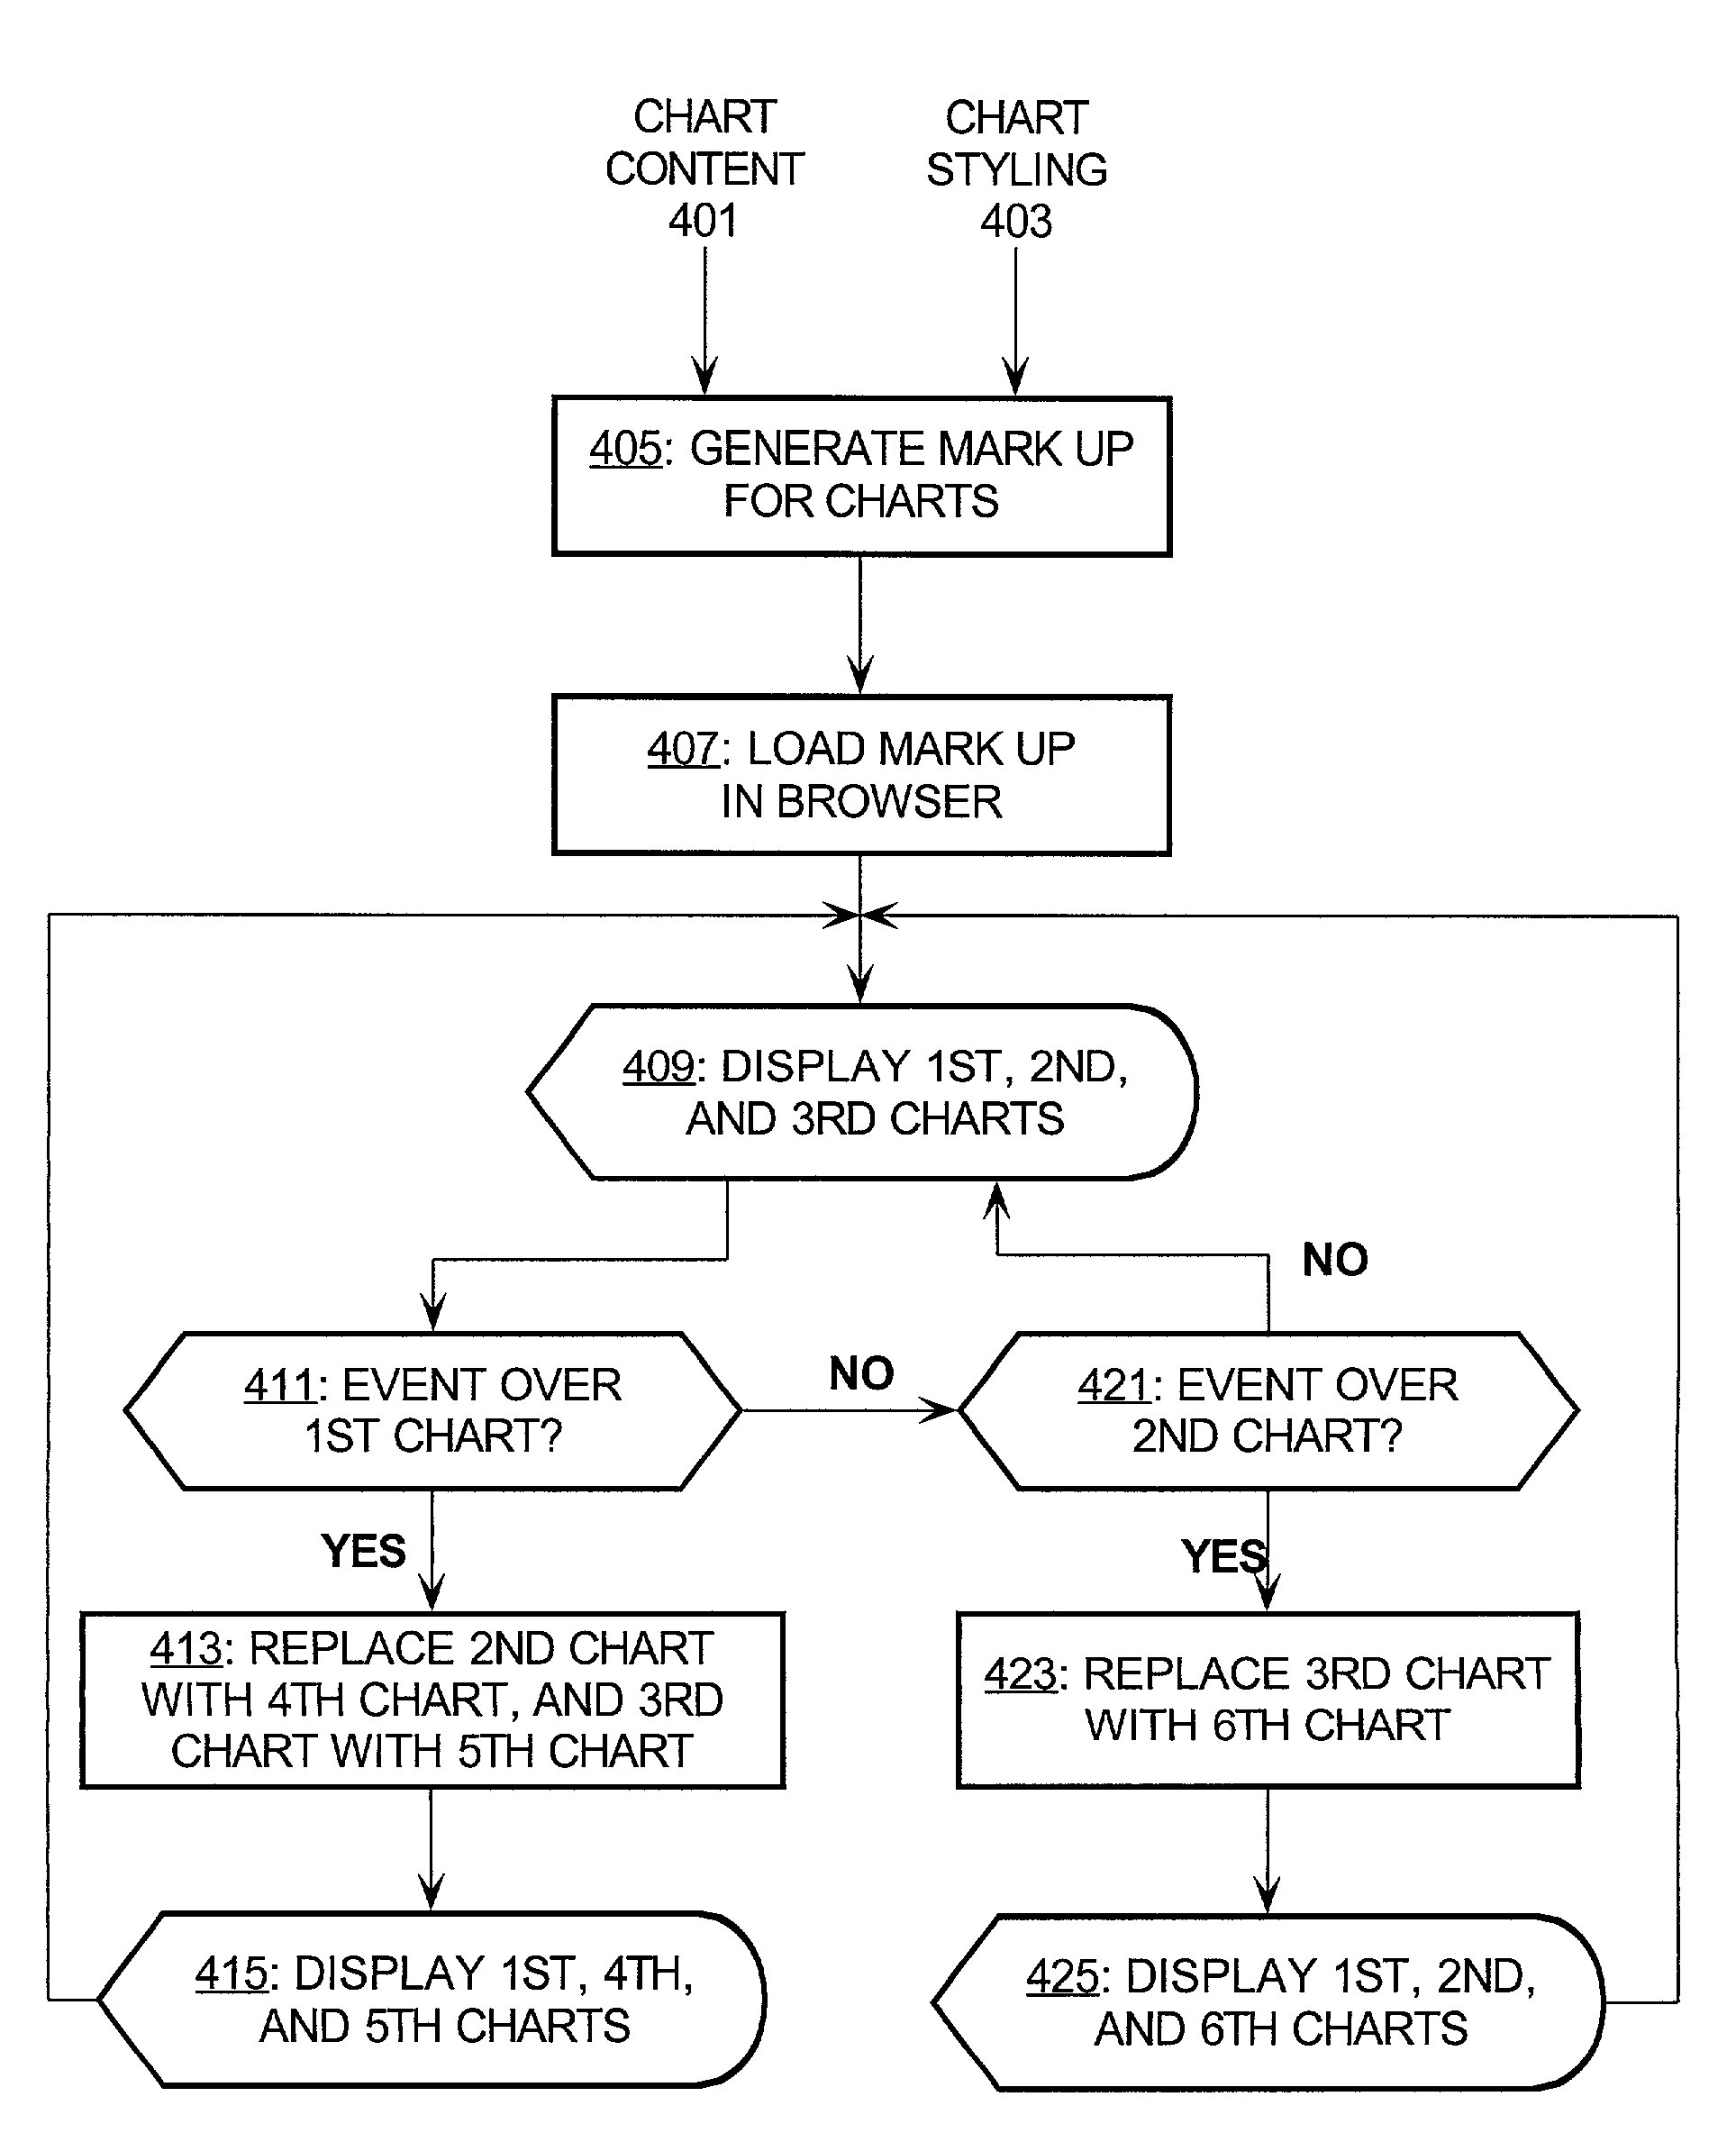
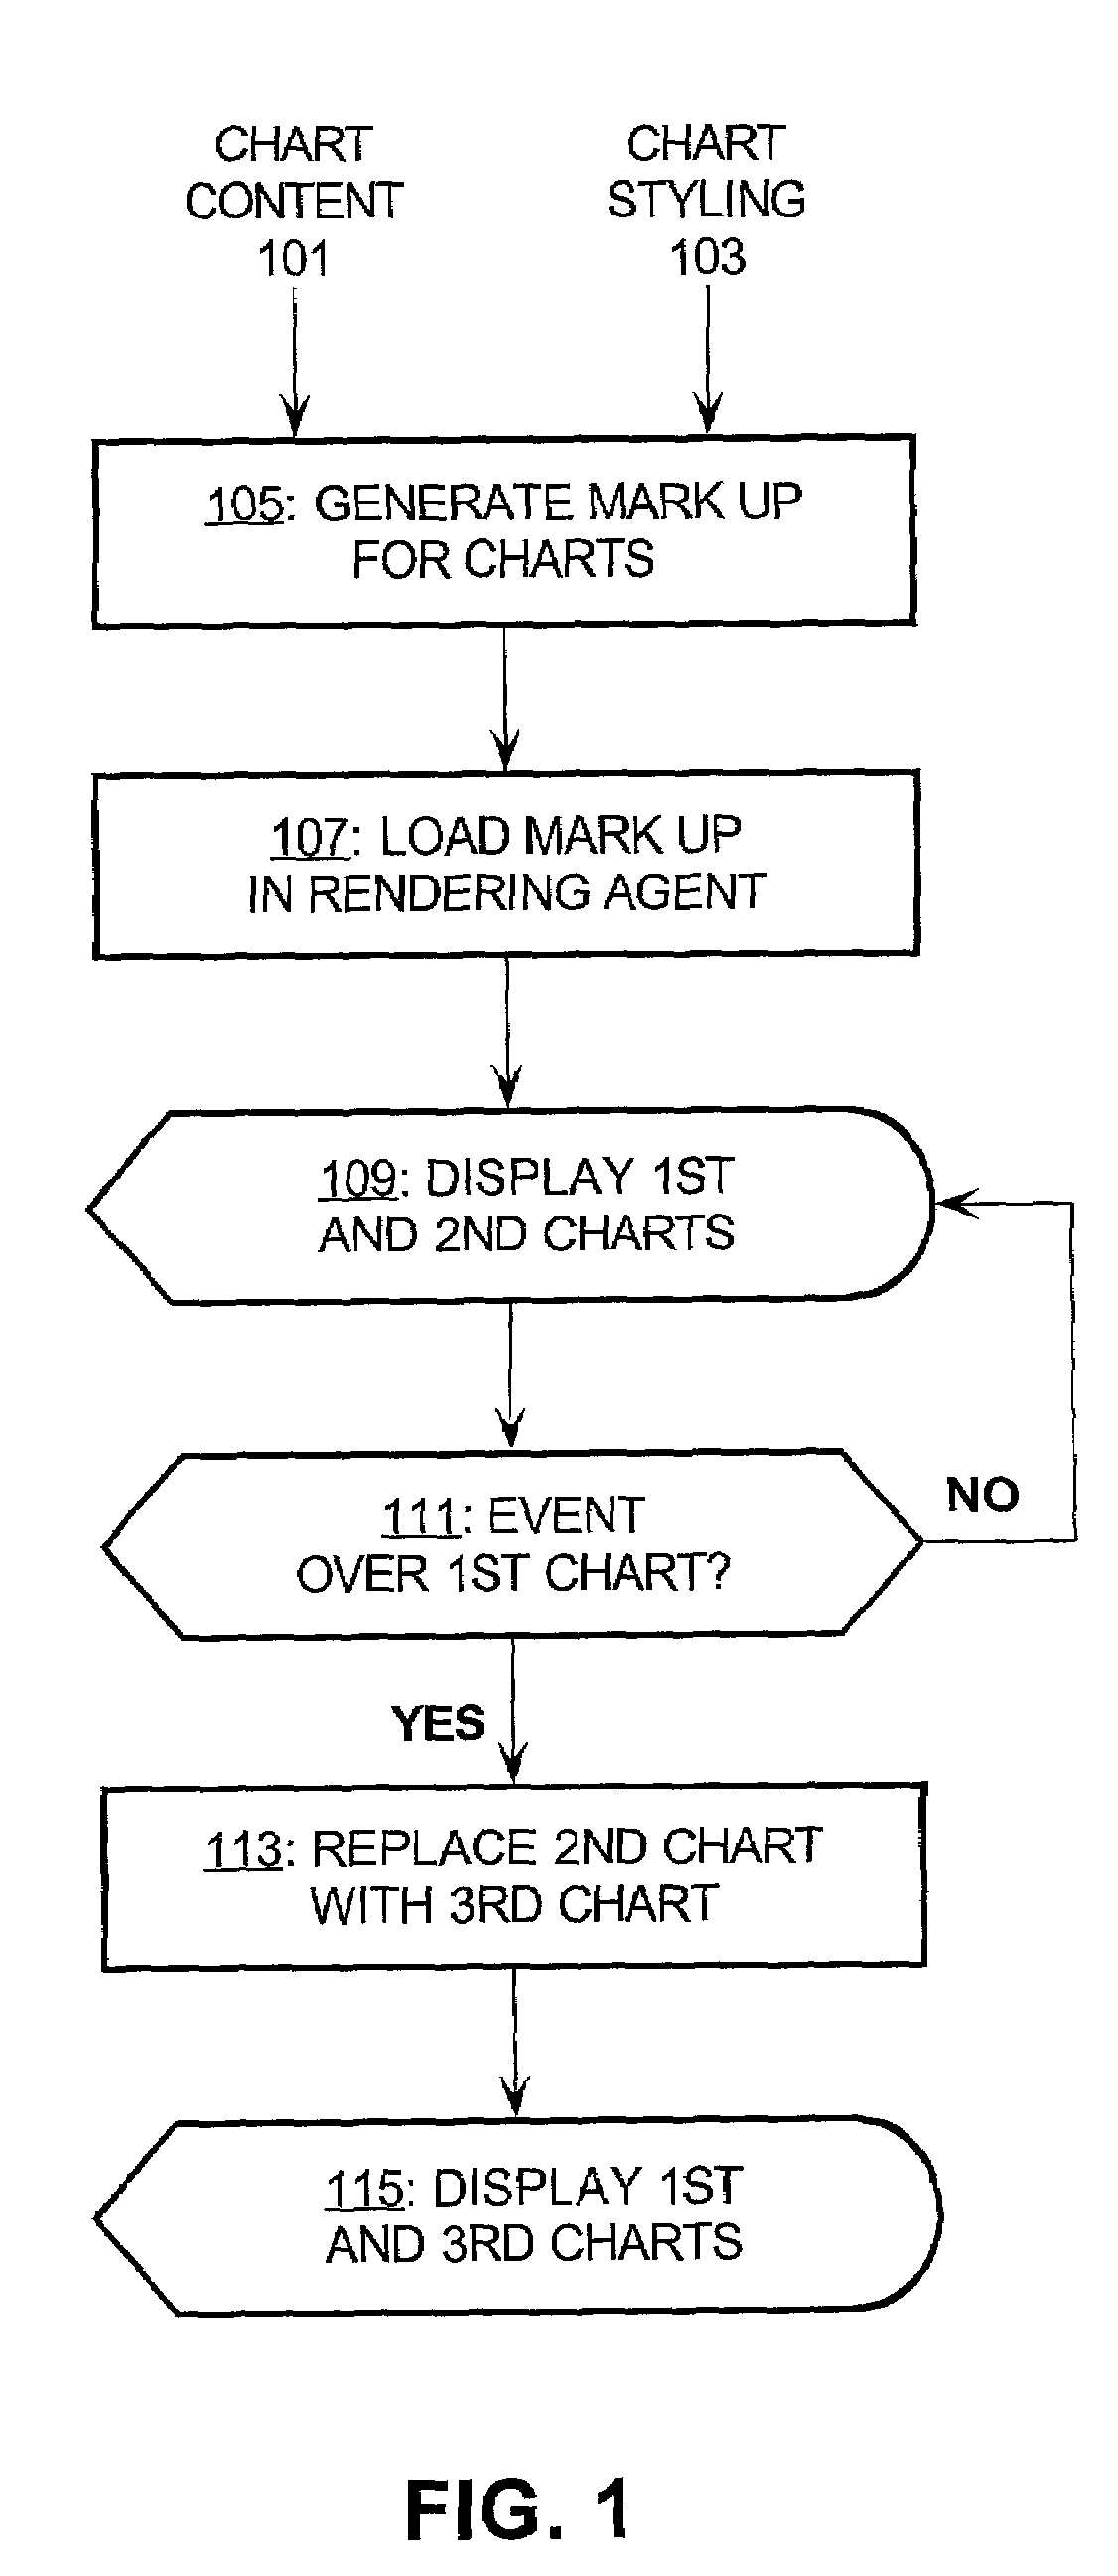
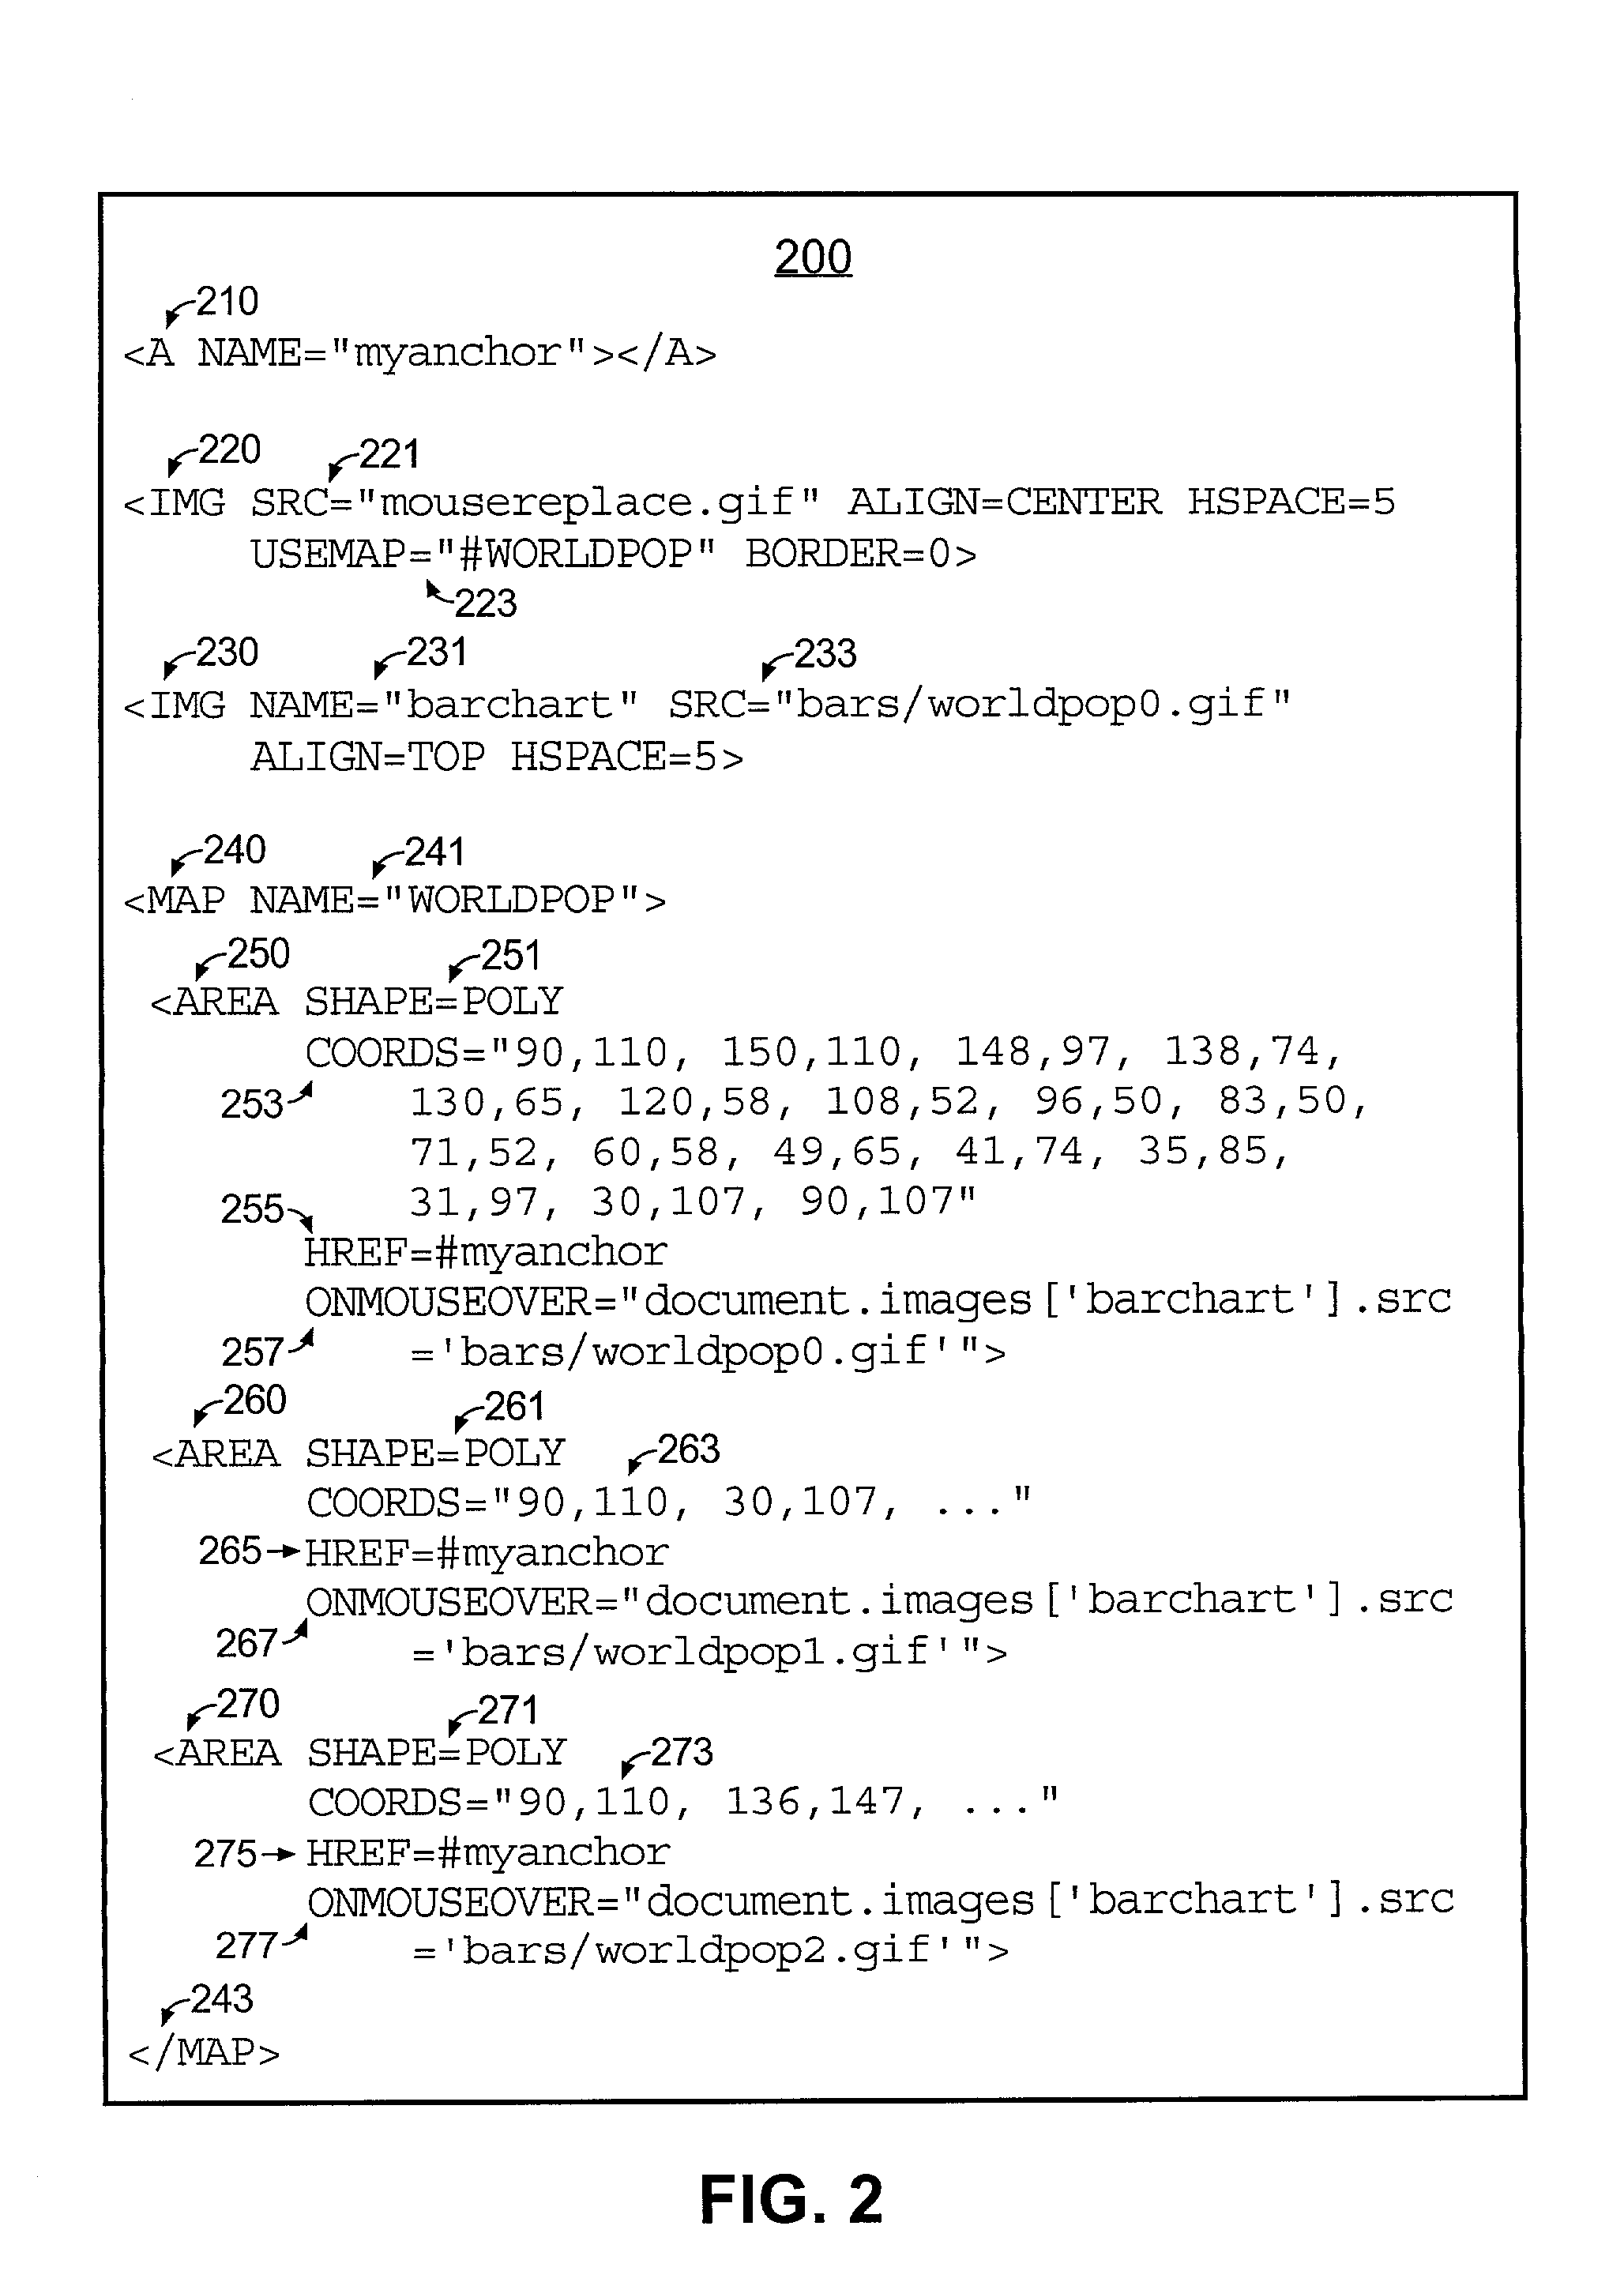
[0007]The present invention addresses these and other needs by providing the rendering agent with a computer-readable medium that is marked up to display at least two charts at the same time and, in response to a cursor operation over one of the charts, to replace the other chart. The cursor operation need not be a mouse click and can simply be the event of moving the cursor into a specified area of the first chart. In the example of a drill down operation, one of the charts may be the main...

Problems solved by technology

Most applications, however, cannot be executed in the context of a browser.
From a performance aspect, this approach is undesirable, because the downloading phase imposes a large initialization time.
If the application is compiled to native machine code, as most applications are, executing a downloaded application on the user's computer system raises security concerns, because the application may include a virus or a software defect that damages the user's computer system.
Even though with JAVA™ applets, which can be embedded into web pages, security c...

Method used


Image

  • Method and article for interactive data exploration
  • Method and article for interactive data exploration
  • Method and article for interactive data exploration

Examples


Embodiment Construction

[0023]A system, method, and software for interactive data exploration are described. In the following description, for the purposes of explanation, numerous specific details are set forth in order to provide a thorough understanding of the present invention. It is apparent, however, to one skilled in the art that the present invention may be practiced without these specific details or with an equivalent arrangement. In other instances, well-known structures and devices are shown in block diagram form in order to avoid unnecessarily obscuring the present invention.

Dynamic Rendering Agents

[0024]A rendering agent is a piece of software that is responsible for receiving a page of information that has been marked up in accordance with a markup language, formatting the information in accordance with the markup, and outputting the formatted information. The most common type of rendering agent is an Internet browser, such as the NETSCAPE™ NAVIGATOR™ browser and the MICROSOF™ EXPLORER™ brows...


PUM


Abstract

A markup programming technique is described which directs a rendering agent to display at least two charts at the same time and, in response to a cursor operation over one of the charts, to replace the other chart. The cursor operation need not be a mouse click and can simply be the event of moving the cursor into a specified area of the first chart.

Description

FIELD OF THE INVENTION[0001]The present invention relates to visual tools for data exploration and more particularly to a method and article for interactively presenting charts.BACKGROUND OF THE INVENTION[0002]Charts are a convenient and compact way of visually presenting information, especially numeric data. For example, the population of China from 1950 to 2000 can be represented effectively with a bar chart. When implemented on a computer, the presentation of charts can be interactive, allowing the user to navigate the various charts that depict the data set and, hence, explore the data. One common chart navigation feature is known as a “drill down,” in which a user selects one element of a chart to obtain more detailed information for that element in another chart. For example, a pie chart may be displayed, showing the relative populations of China, India, and the United States. By clicking on the pie slice for China, the user can immediately bring up a bar chart showing the gro...

Claims


Application Information

Patent Timeline
IPC IPC(8): G06N3/00
CPCG06F3/0481G06Q10/06
Inventor MOLESKY, LORY D.
Owner ORACLE INT CORP
Why Eureka
Try Eureka