Internal calibration standards for electrophoretic analyses
a technology of electrophoretic analysis and calibration standards, applied in the field of polynucleotide sequencers and analyzers, can solve the problems of deviating substantially from the separation profile of fragments, basecalling errors, and incorrect estimation of spacing, so as to improve the length or read, improve the quality of data and experiment, and reduce the effect of basecalling errors
- Summary
- Abstract
- Description
- Claims
- Application Information
AI Technical Summary
Benefits of technology
Problems solved by technology
Method used
Image

Examples
example 1
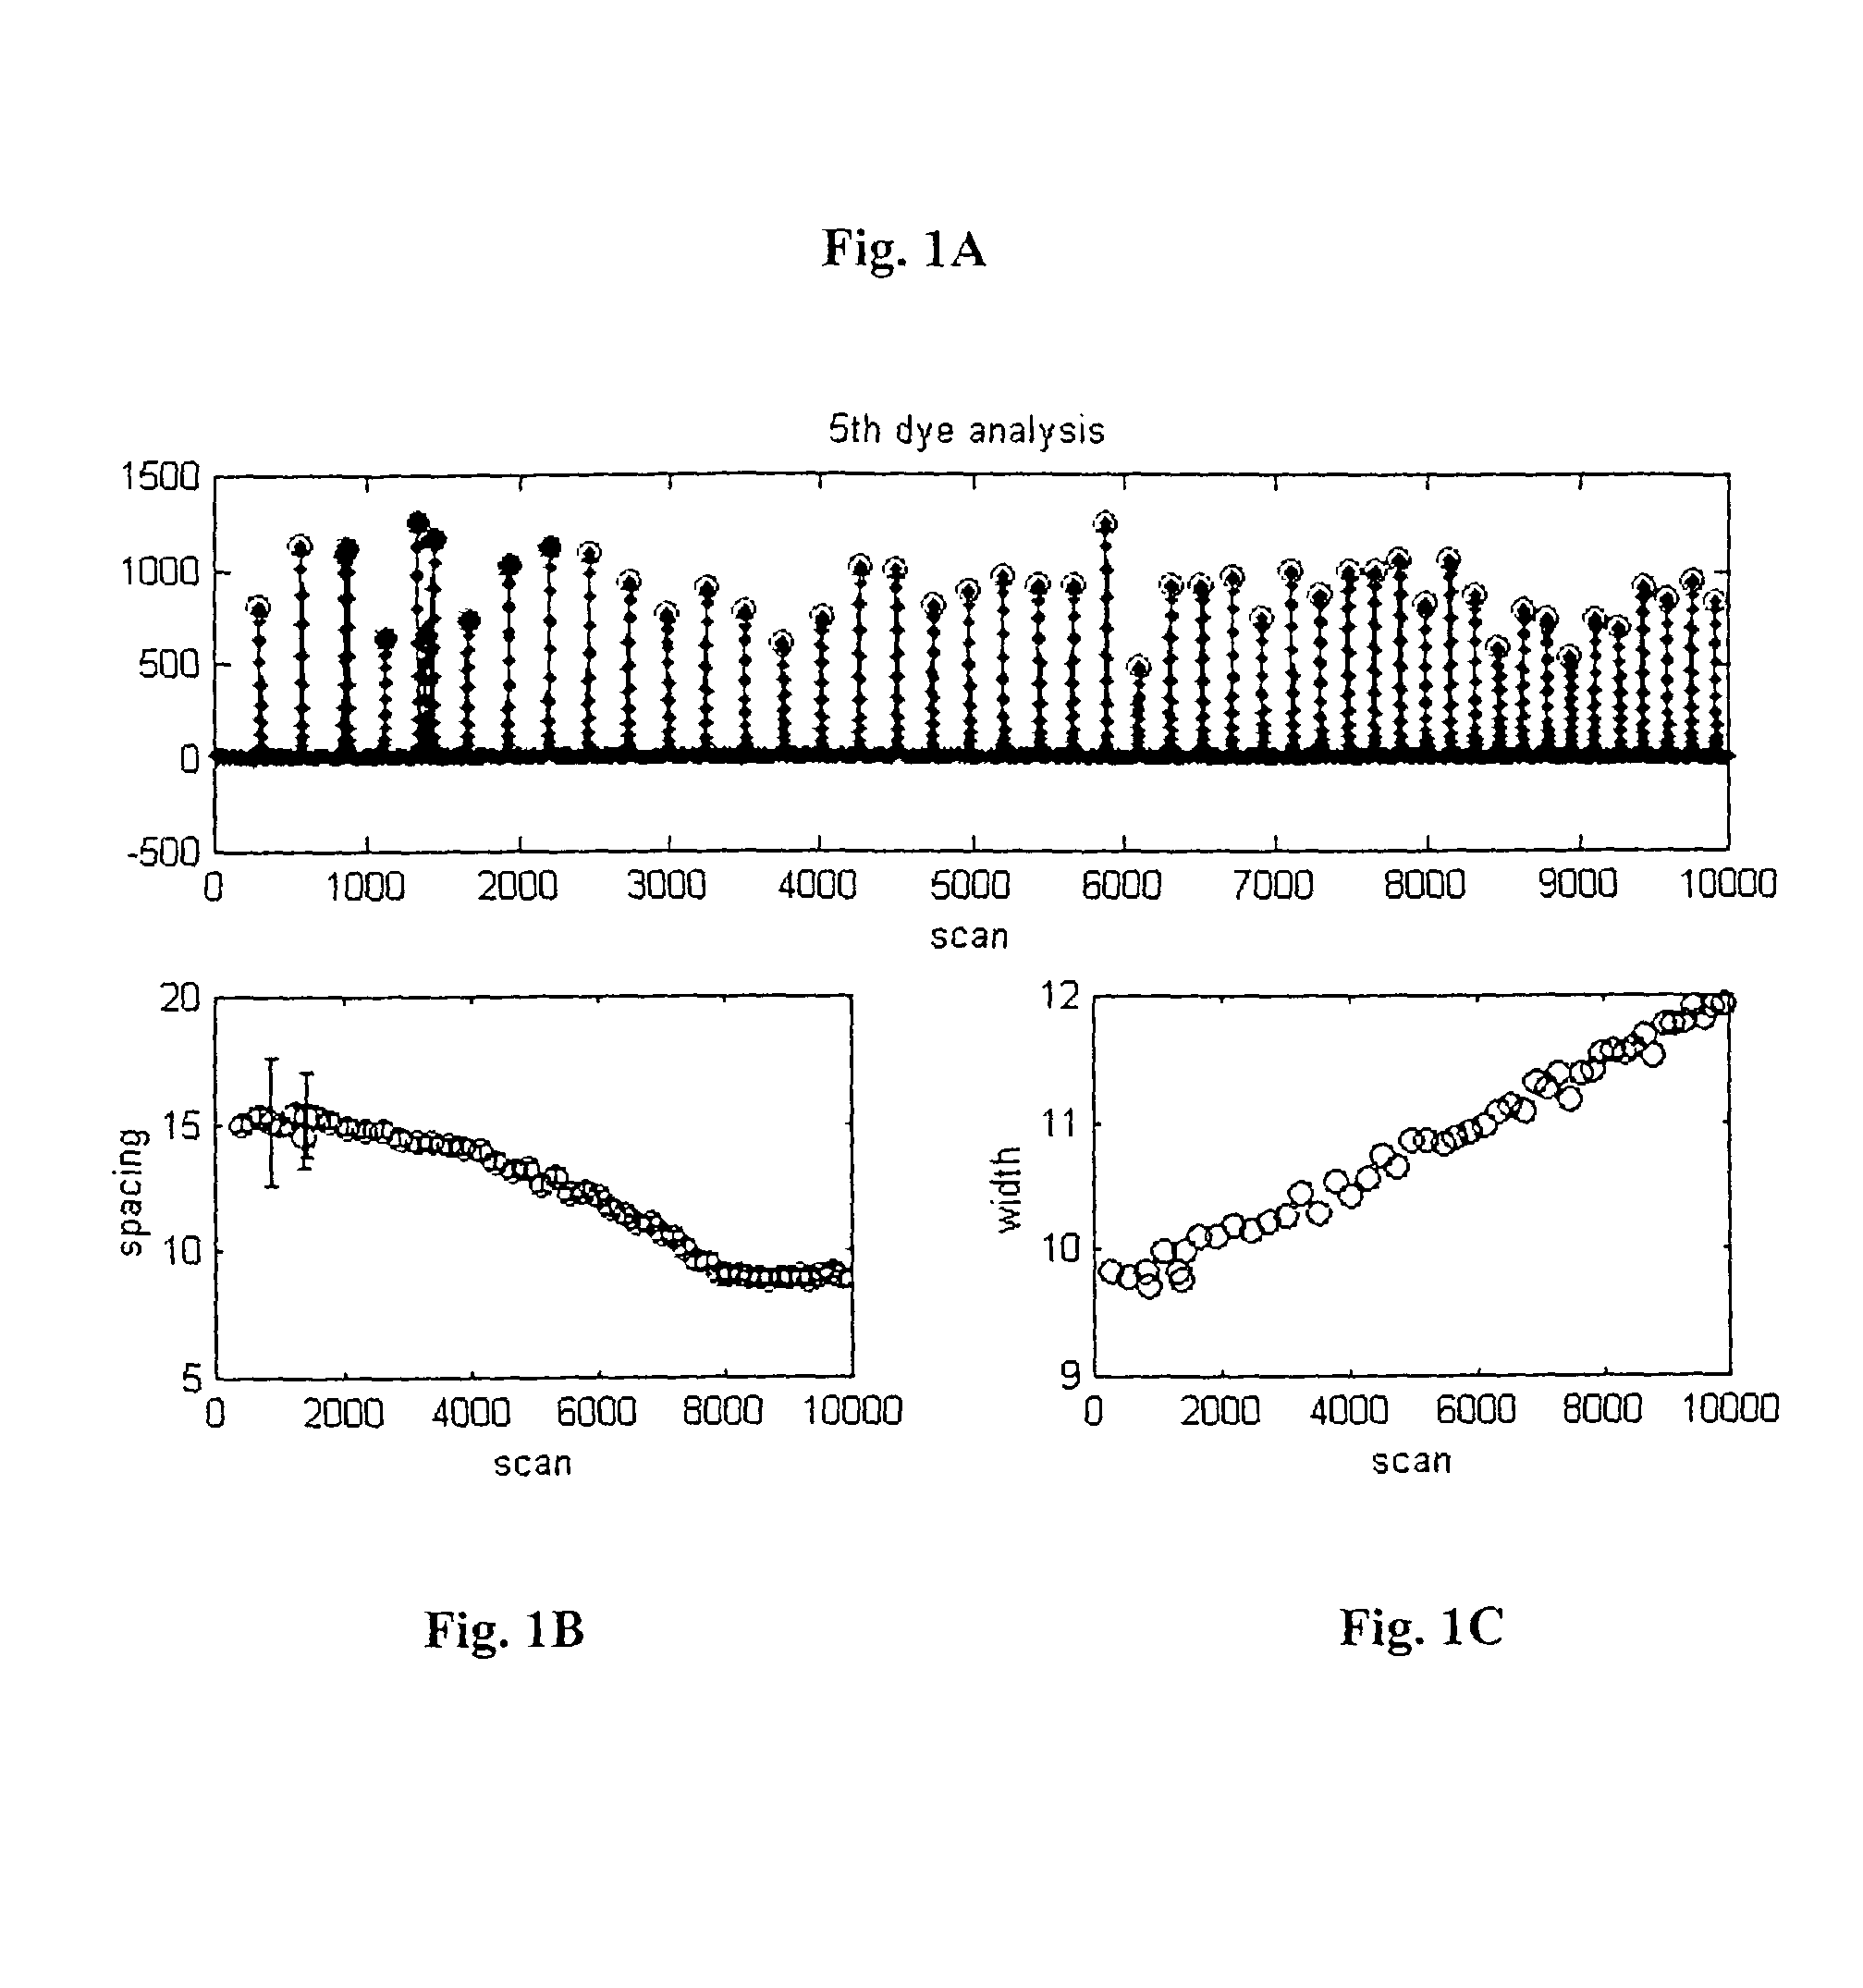
[0104]FIG. 1 is an electropherogram representing data from a simulated 5th-dye run. The x-axis is scan number, and the y-axis is fluorescent amplitude, in arbitrary units. Each scan is approximately 1 second in duration. Most of the peaks are equally spaced, i.e., they occur at each 18 bases. A mobility similar to 3700 POP5 data (Applied Biosystems; Foster City, Calif.) was used to simulate realistic scan spacing. A few of the peaks deviate from the regular 18-base spacing. Such patterned peaks are used to provide absolute calibration of the start position, i.e., base 1. For ease of identification, regularly spaced peaks are identified by open (red) circles, whereas patterned peaks are identified with closed (green) circles.
[0105]From the 5th dye ladder (FIG. 1A) the curves of FIGS. 1B and 1C can be estimated. FIG. 1B represents the spacing peak-to-peak as a function of scan number. The spacing is also reported in scan number. The curve of FIG. 1C represents the width of each peak, ...
example 2
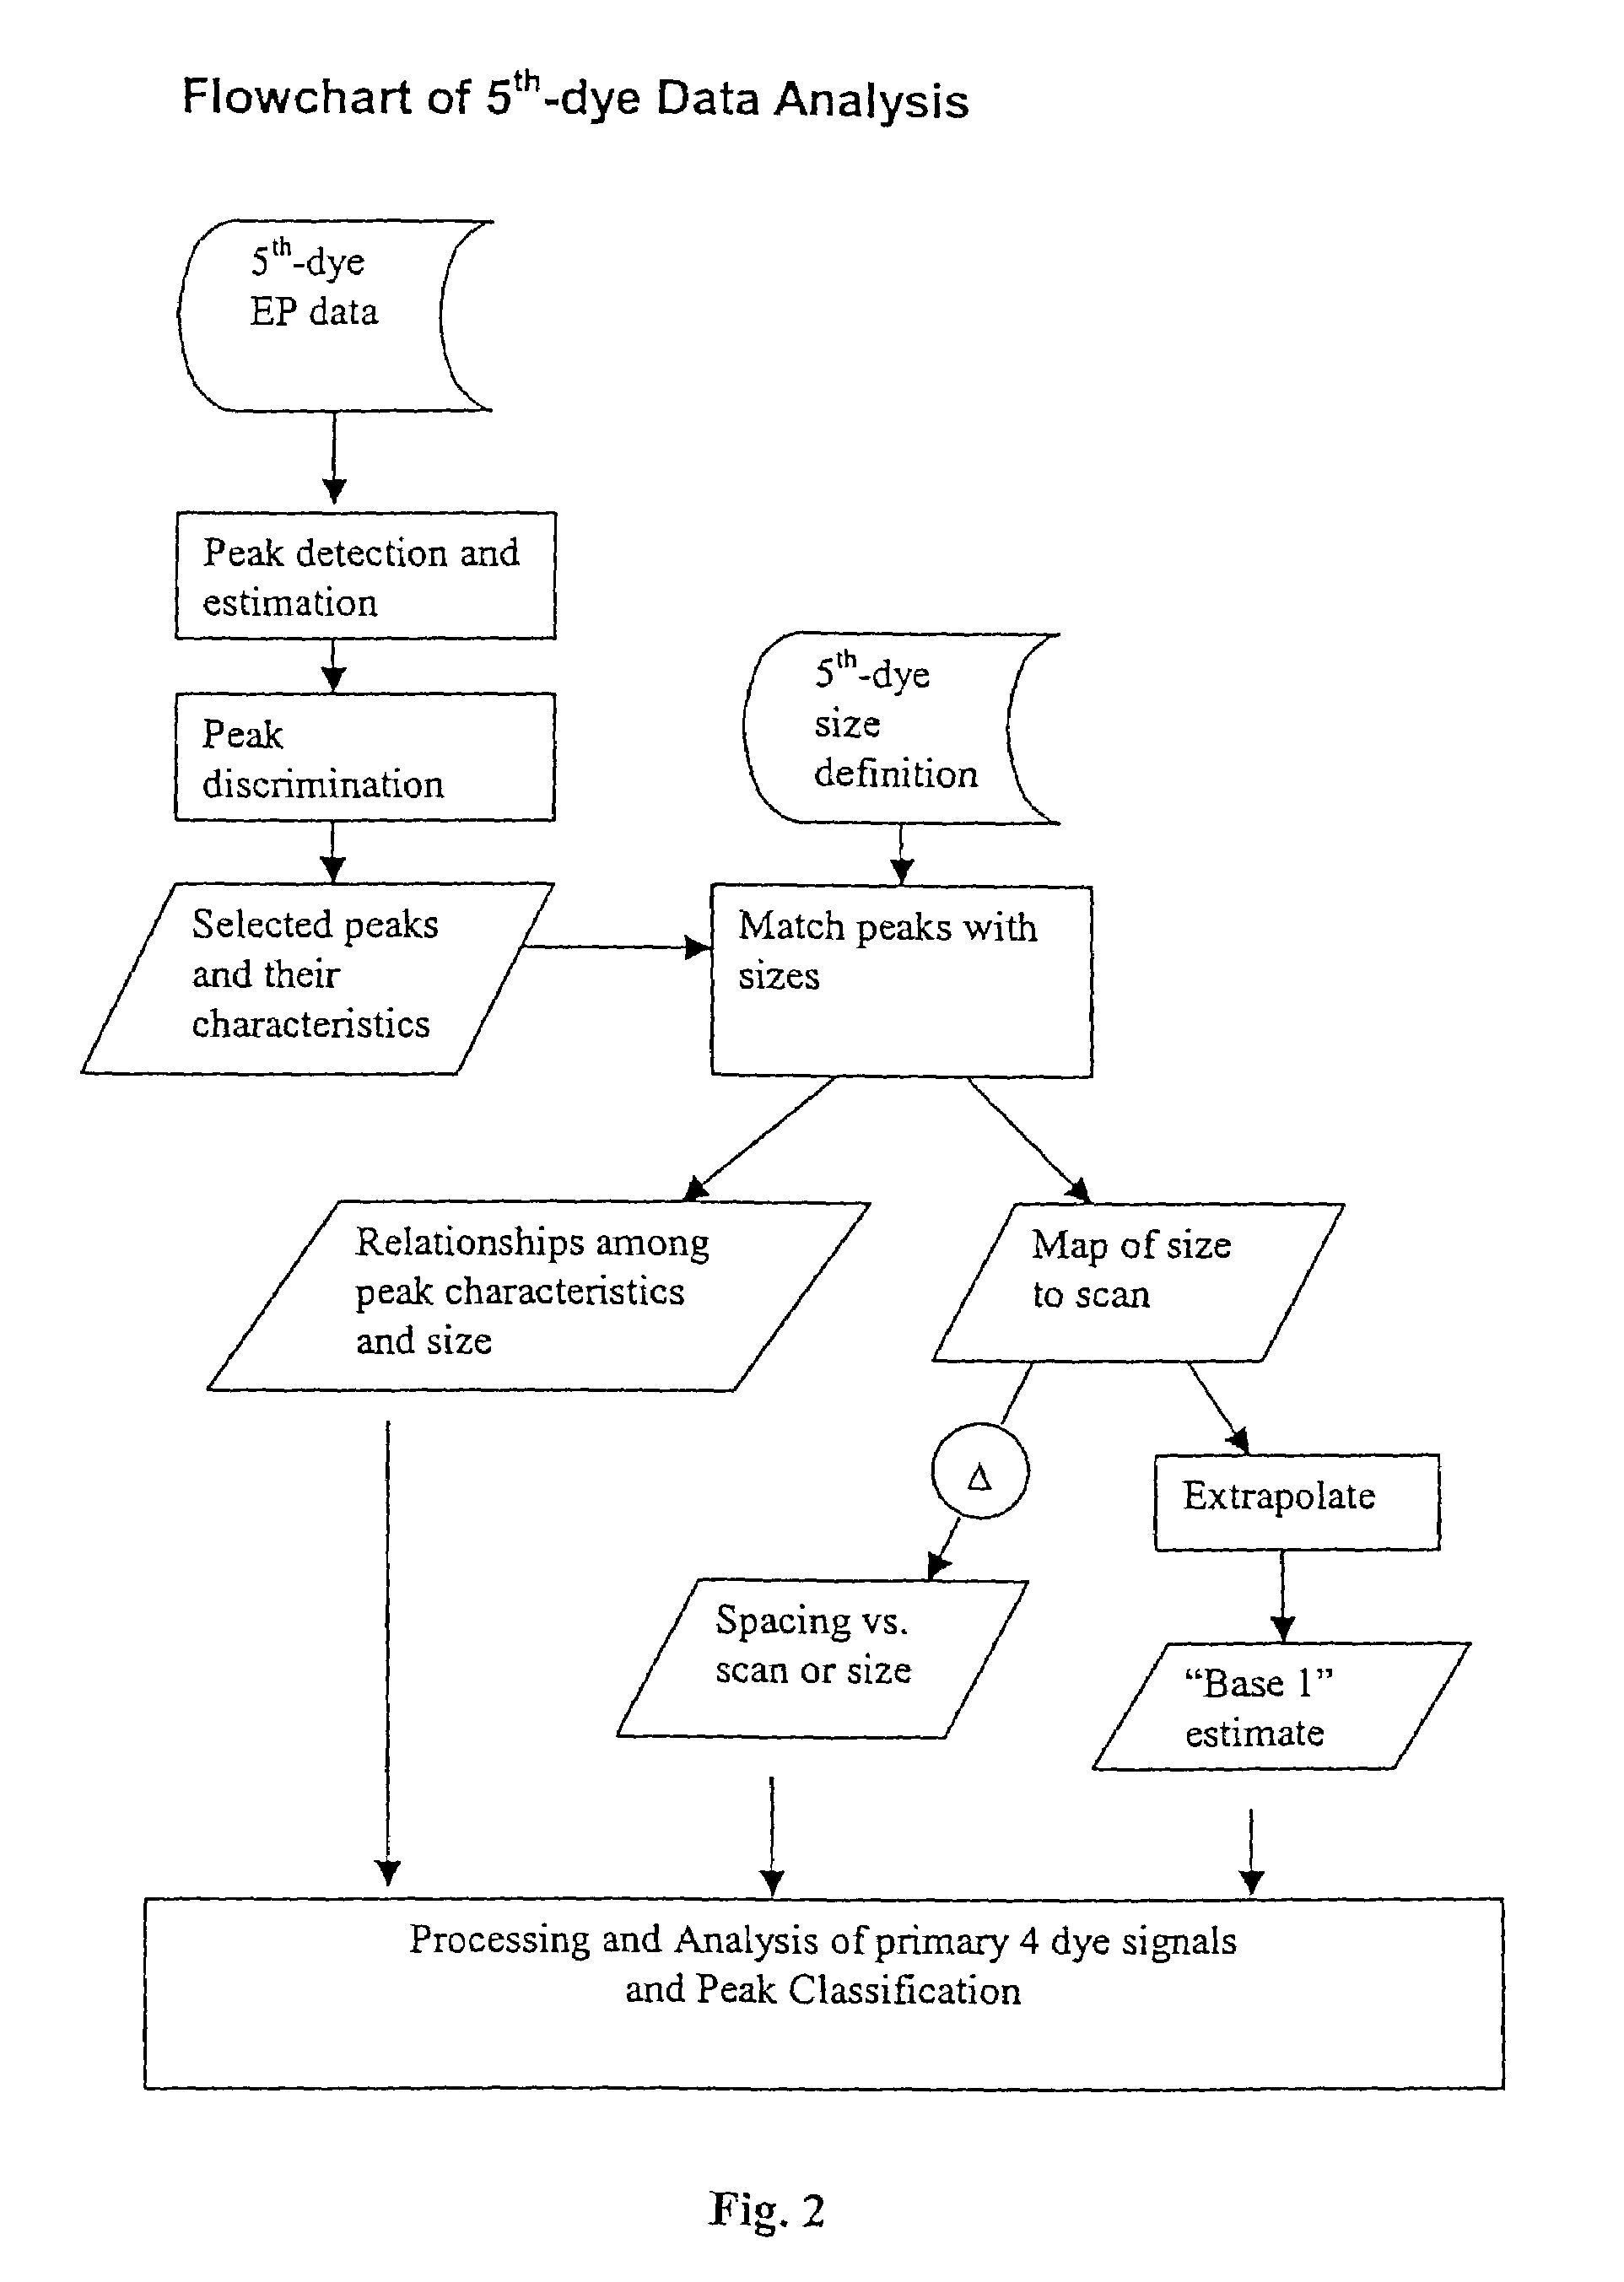
[0107]FIG. 2 provides a flowchart showing steps contemplated by an embodiment of the present invention.
[0108]Peak detection can be achieved through a number of techniques known in the art. For example, peak detection can be achieved via identification of local maxima in the discretely sampled EP data. An embodiment of the present invention makes use of an algorithm that involves Savitsky-Golay smoothing. Any of a variety of techniques for estimation of peak characteristics can be employed in practicing the present invention. Characteristics of interest include: position (scan), and shape (e.g., height, width). Savitsky-Golay smoothing can also be used toward these ends.
[0109]Peak discrimination can also be achieved in a variety of ways. In various embodiments, the Euclidean distances in height-width space of peaks from some reference point are sorted and differenced to determine a boundary that separates peaks to be ignored from those to be considered for subsequent analysis.
[0110]M...
example 3
[0114]According to one example of the present teachings, a ladder is designed and constructed to contain a 5th dye-labeled fragment every 10 to 20 bases from base ˜20 to base ˜1200-1500 (i.e., at least 60 fragments). An additional 2-3 peaks can be designed to occur near the beginning for base 1 estimation. The ladder sequence, in this embodiment, exhibits generally “normal” migration (e.g., by having fairly equal representation of all 4 bases), and does not exhibit substantial mobility irregularities when run under standard conditions. The ladder can be comprised of, for example, of a repeating internal unit, so between peaks there will be a constant number of bases of the same sequence. The ladder can be generated, for example, from a single-base sequencing reaction. In another embodiment, the template includes additional peaks, but contains isolated peaks (by at least ˜5 bases) every ˜20 or so bases. Ideally it comprises the repeating unit described above.
PUM
| Property | Measurement | Unit |
|---|---|---|
| distance | aaaaa | aaaaa |
| peak width at half height | aaaaa | aaaaa |
| sizes | aaaaa | aaaaa |
Abstract
Description
Claims
Application Information
 - R&D Engineer
- R&D Manager
- IP Professional
- Industry Leading Data Capabilities
- Powerful AI technology
- Patent DNA Extraction
Browse by: Latest US Patents, China's latest patents, Technical Efficacy Thesaurus, Application Domain, Technology Topic.
© 2024 PatSnap. All rights reserved.Legal|Privacy policy|Modern Slavery Act Transparency Statement|Sitemap