
Method and apparatus for displaying graphical representations of graph layouts

a graph layout and graph technology, applied in the field of graph layout algorithms, can solve the problems of only good hierarchical and radial layout algorithms, large tables are not easily understood by design engineers, and dynamic updates between tabulars

Inactive Publication Date: 2014-12-02
PIECE FUTURE PTE LTD
View PDF9 Cites 9 Cited by
  • Summary
  • Abstract
  • Description
  • Claims
  • Application Information

AI Technical Summary

Benefits of technology

The invention is a method and apparatus for displaying a graphical representation of a graph. It allows for the inclusion of nodes and edges, and determines the position of each within the layout of the graph. The layout is then generated and displayed to users. The first force model, a repulsive force model, and the second force model, an attractive force model, are applied to nodes and edges, respectively, to achieve the desired positioning. The technical effect of this invention is a more complete and accurate representation of a complex graph, making it easier for users to understand and interact with.

Problems solved by technology

Although such tables are easily stored and processed by computers, and many details may be specified within such tables in a readable format, large tables are not easily understood by design engineers.
Disadvantageously, hierarchical and radial layout algorithms only achieve good results if the graph for which the layout is determined has specific properties, such as being acyclic or directed, which cannot be guaranteed for all graphs, and especially for finite state machines.
Furthermore, hierarchical and radial layout algorithms cannot pin nodes to specific positions, thereby preventing dynamic updates between tabular and graphical representations of the graph without disturbing portions of the graph which may have been set manually.
Disadvantageously, existing physical model algorithms model nodes as ideal points; however, since nodes typically include information (e.g., respective labels of the nodes) which must be visible in the graphical representation of the layout of the graph, modeling of the nodes as ideal points often results in significant overlaps which render such information unreadable.
Although overlaps can be corrected, such corrections require additional processing on the layout of the graph, thereby increasing time and cost associated with generating and displaying the layout of the graph.

Method used


Image

  • Method and apparatus for displaying graphical representations of graph layouts
  • Method and apparatus for displaying graphical representations of graph layouts
  • Method and apparatus for displaying graphical representations of graph layouts

Examples


Embodiment Construction

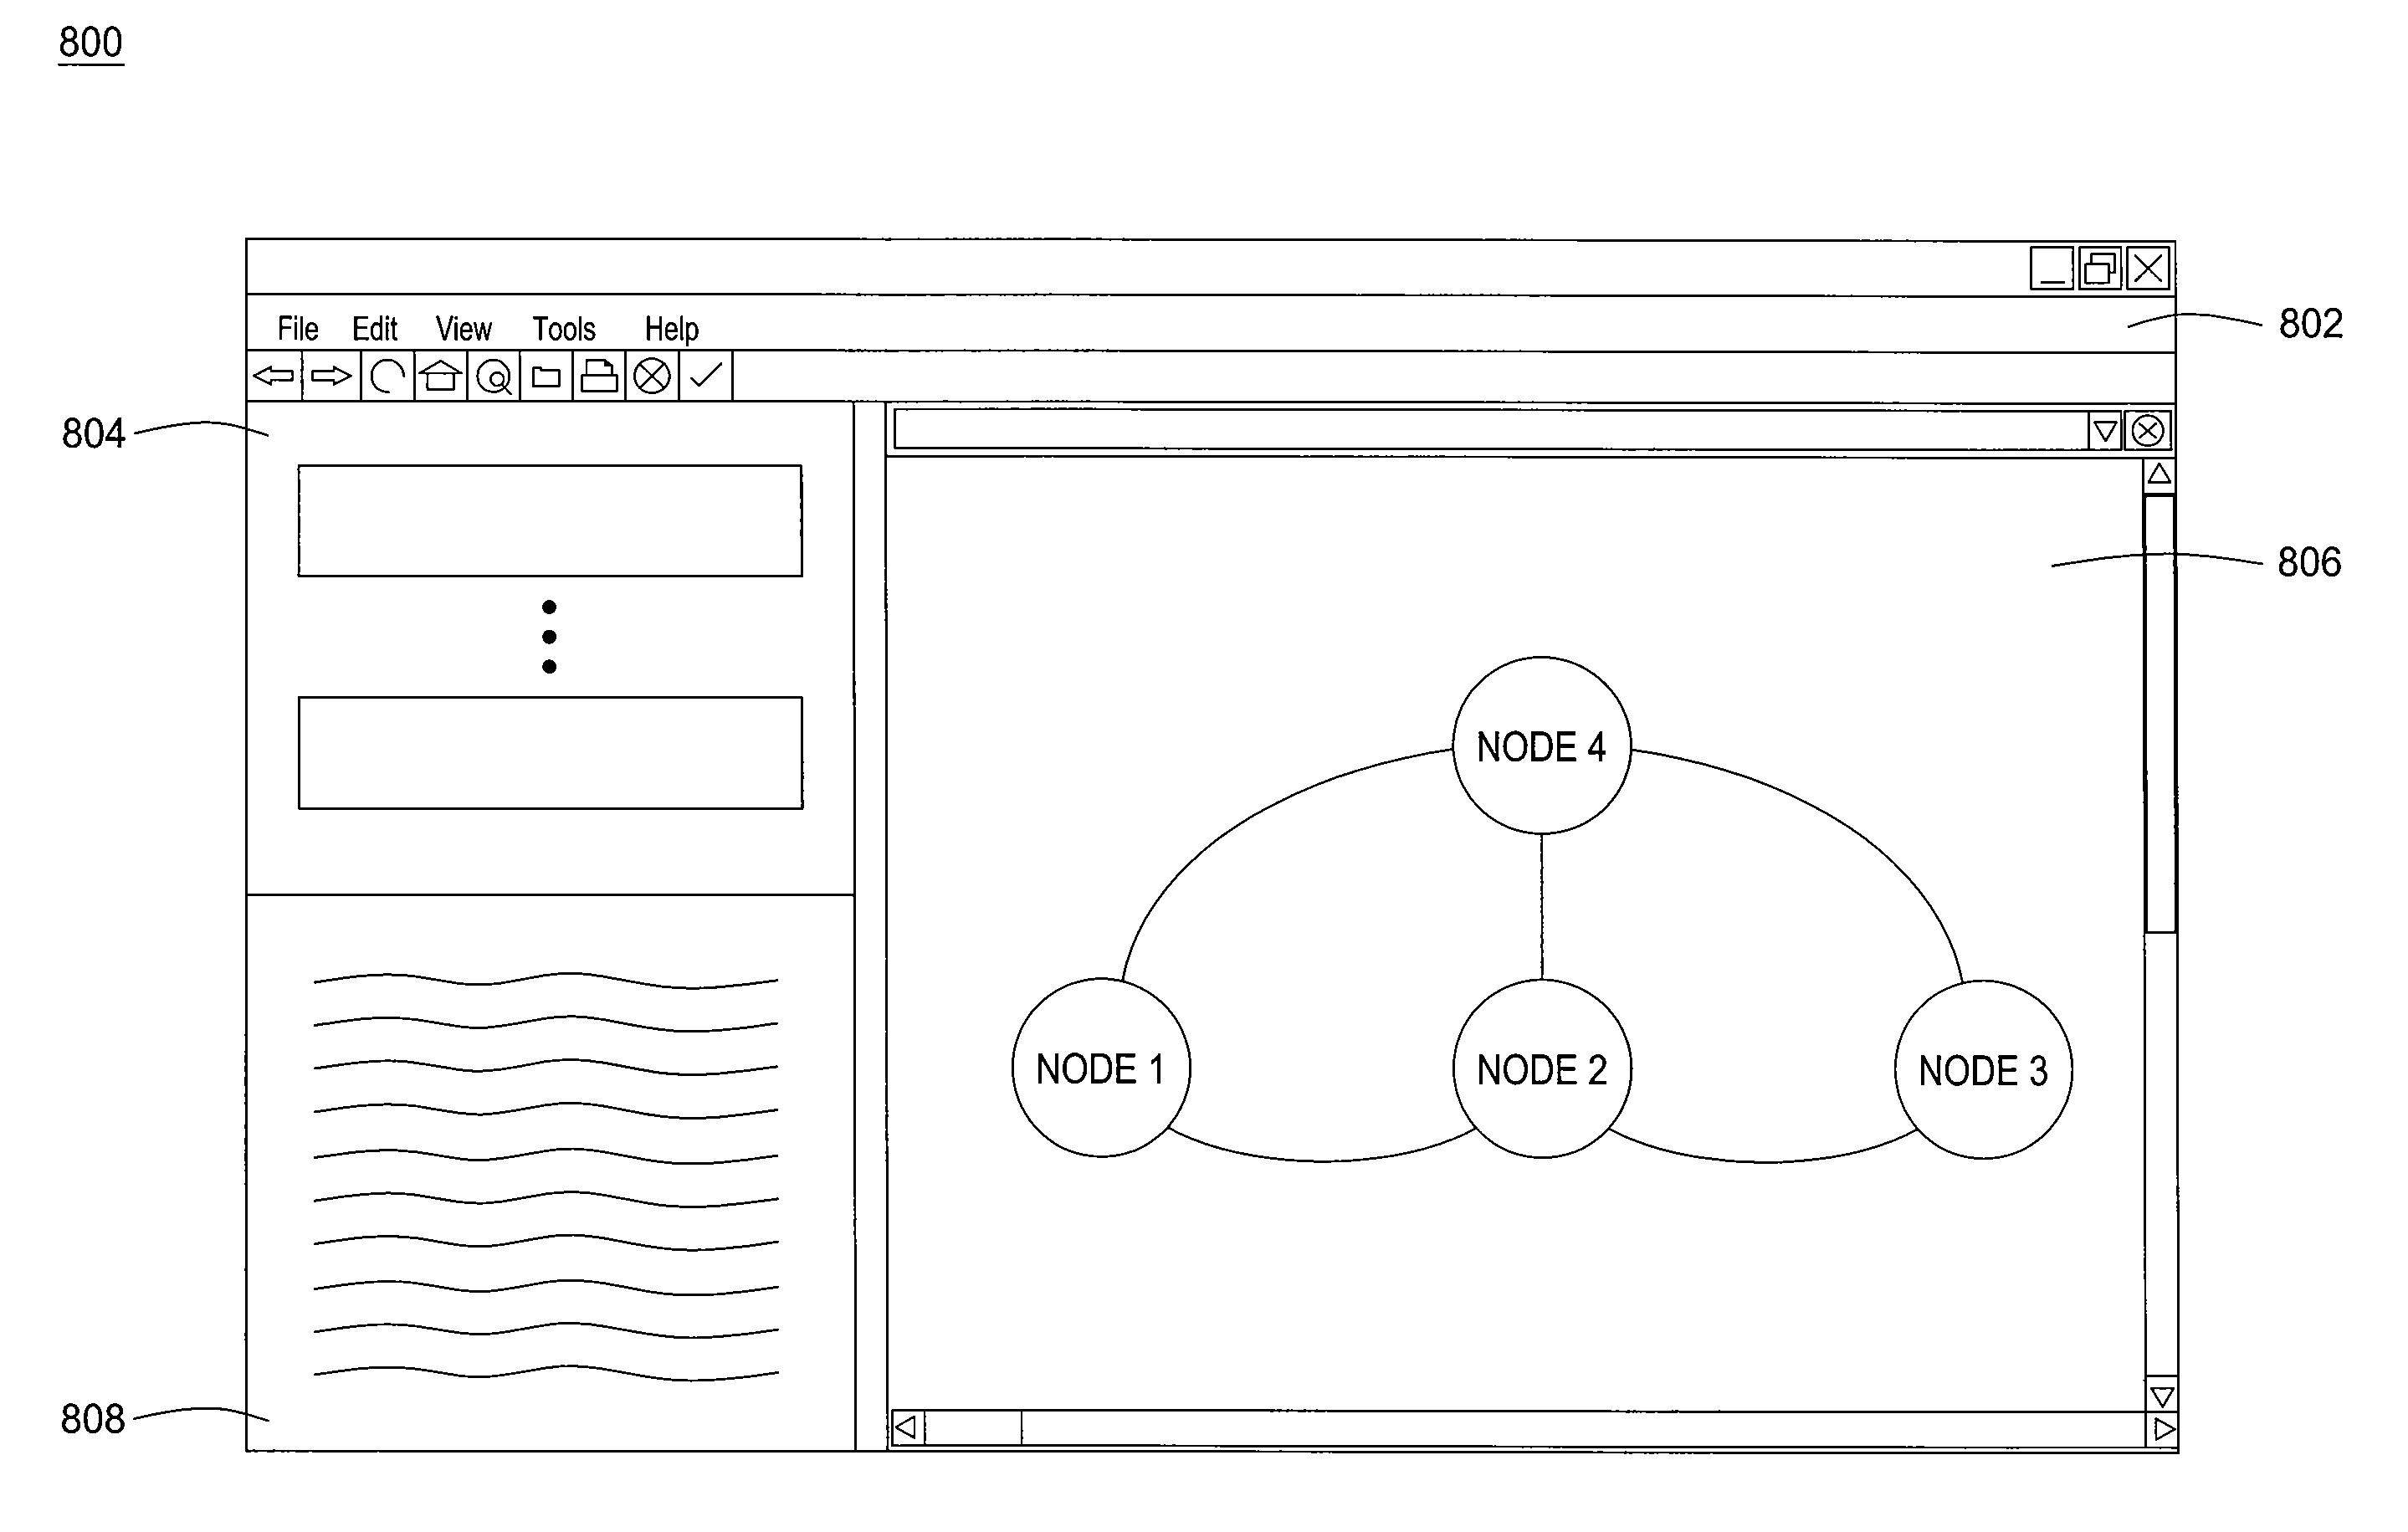
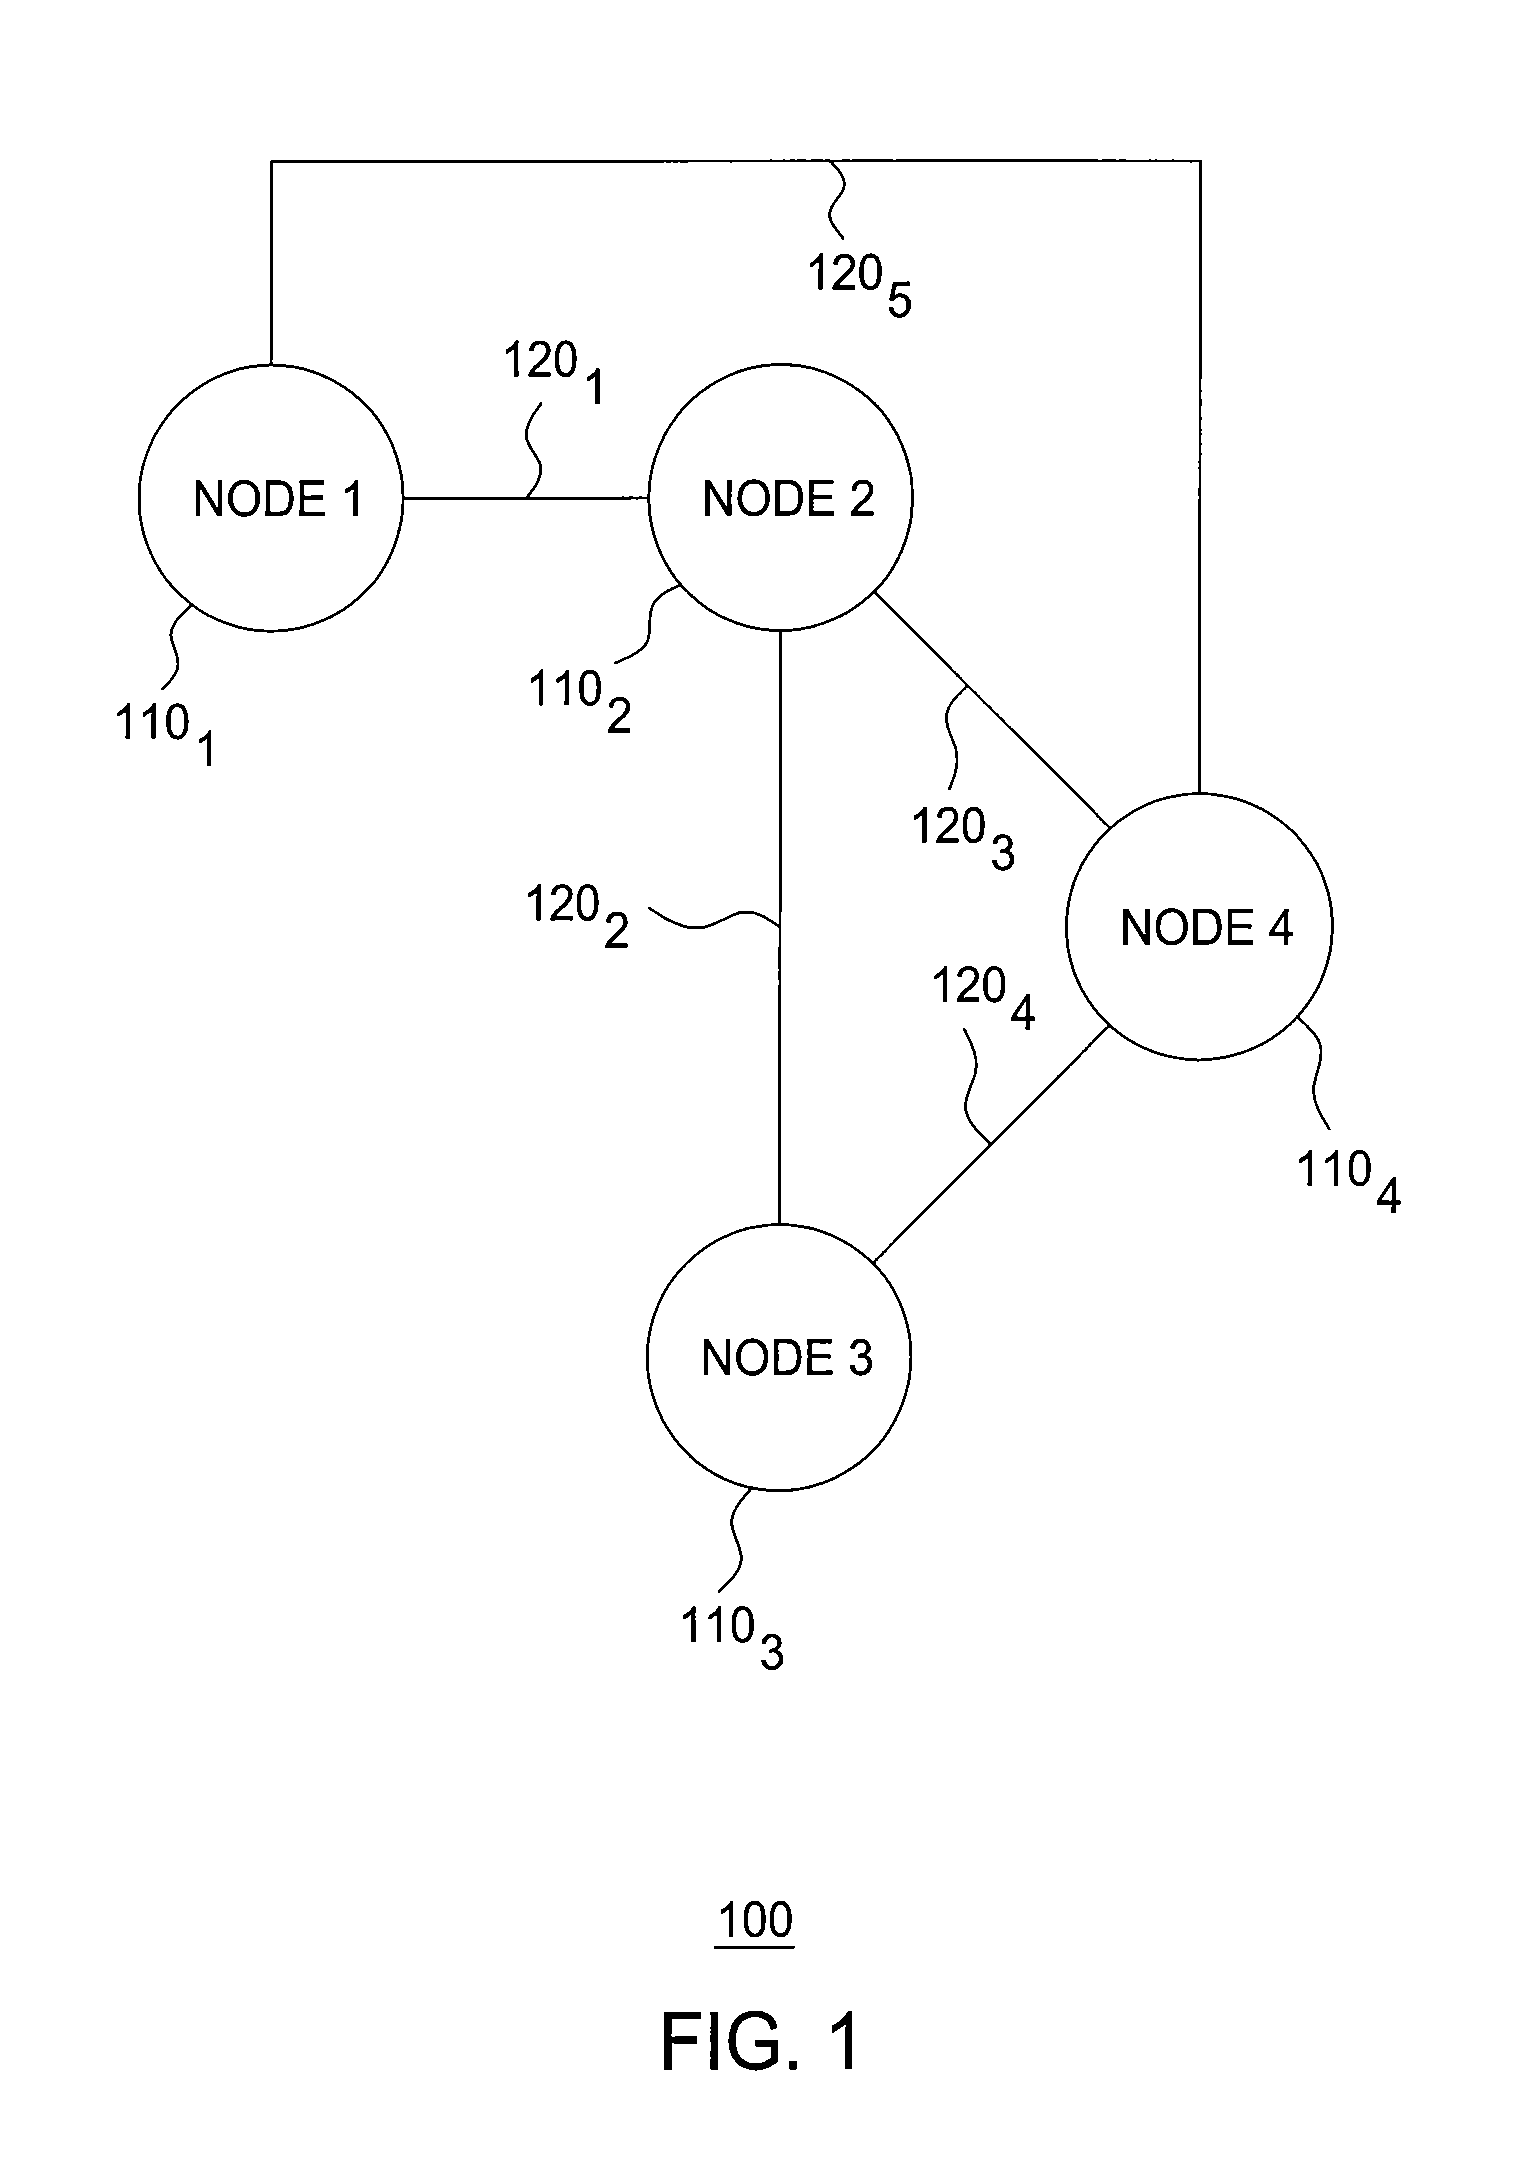
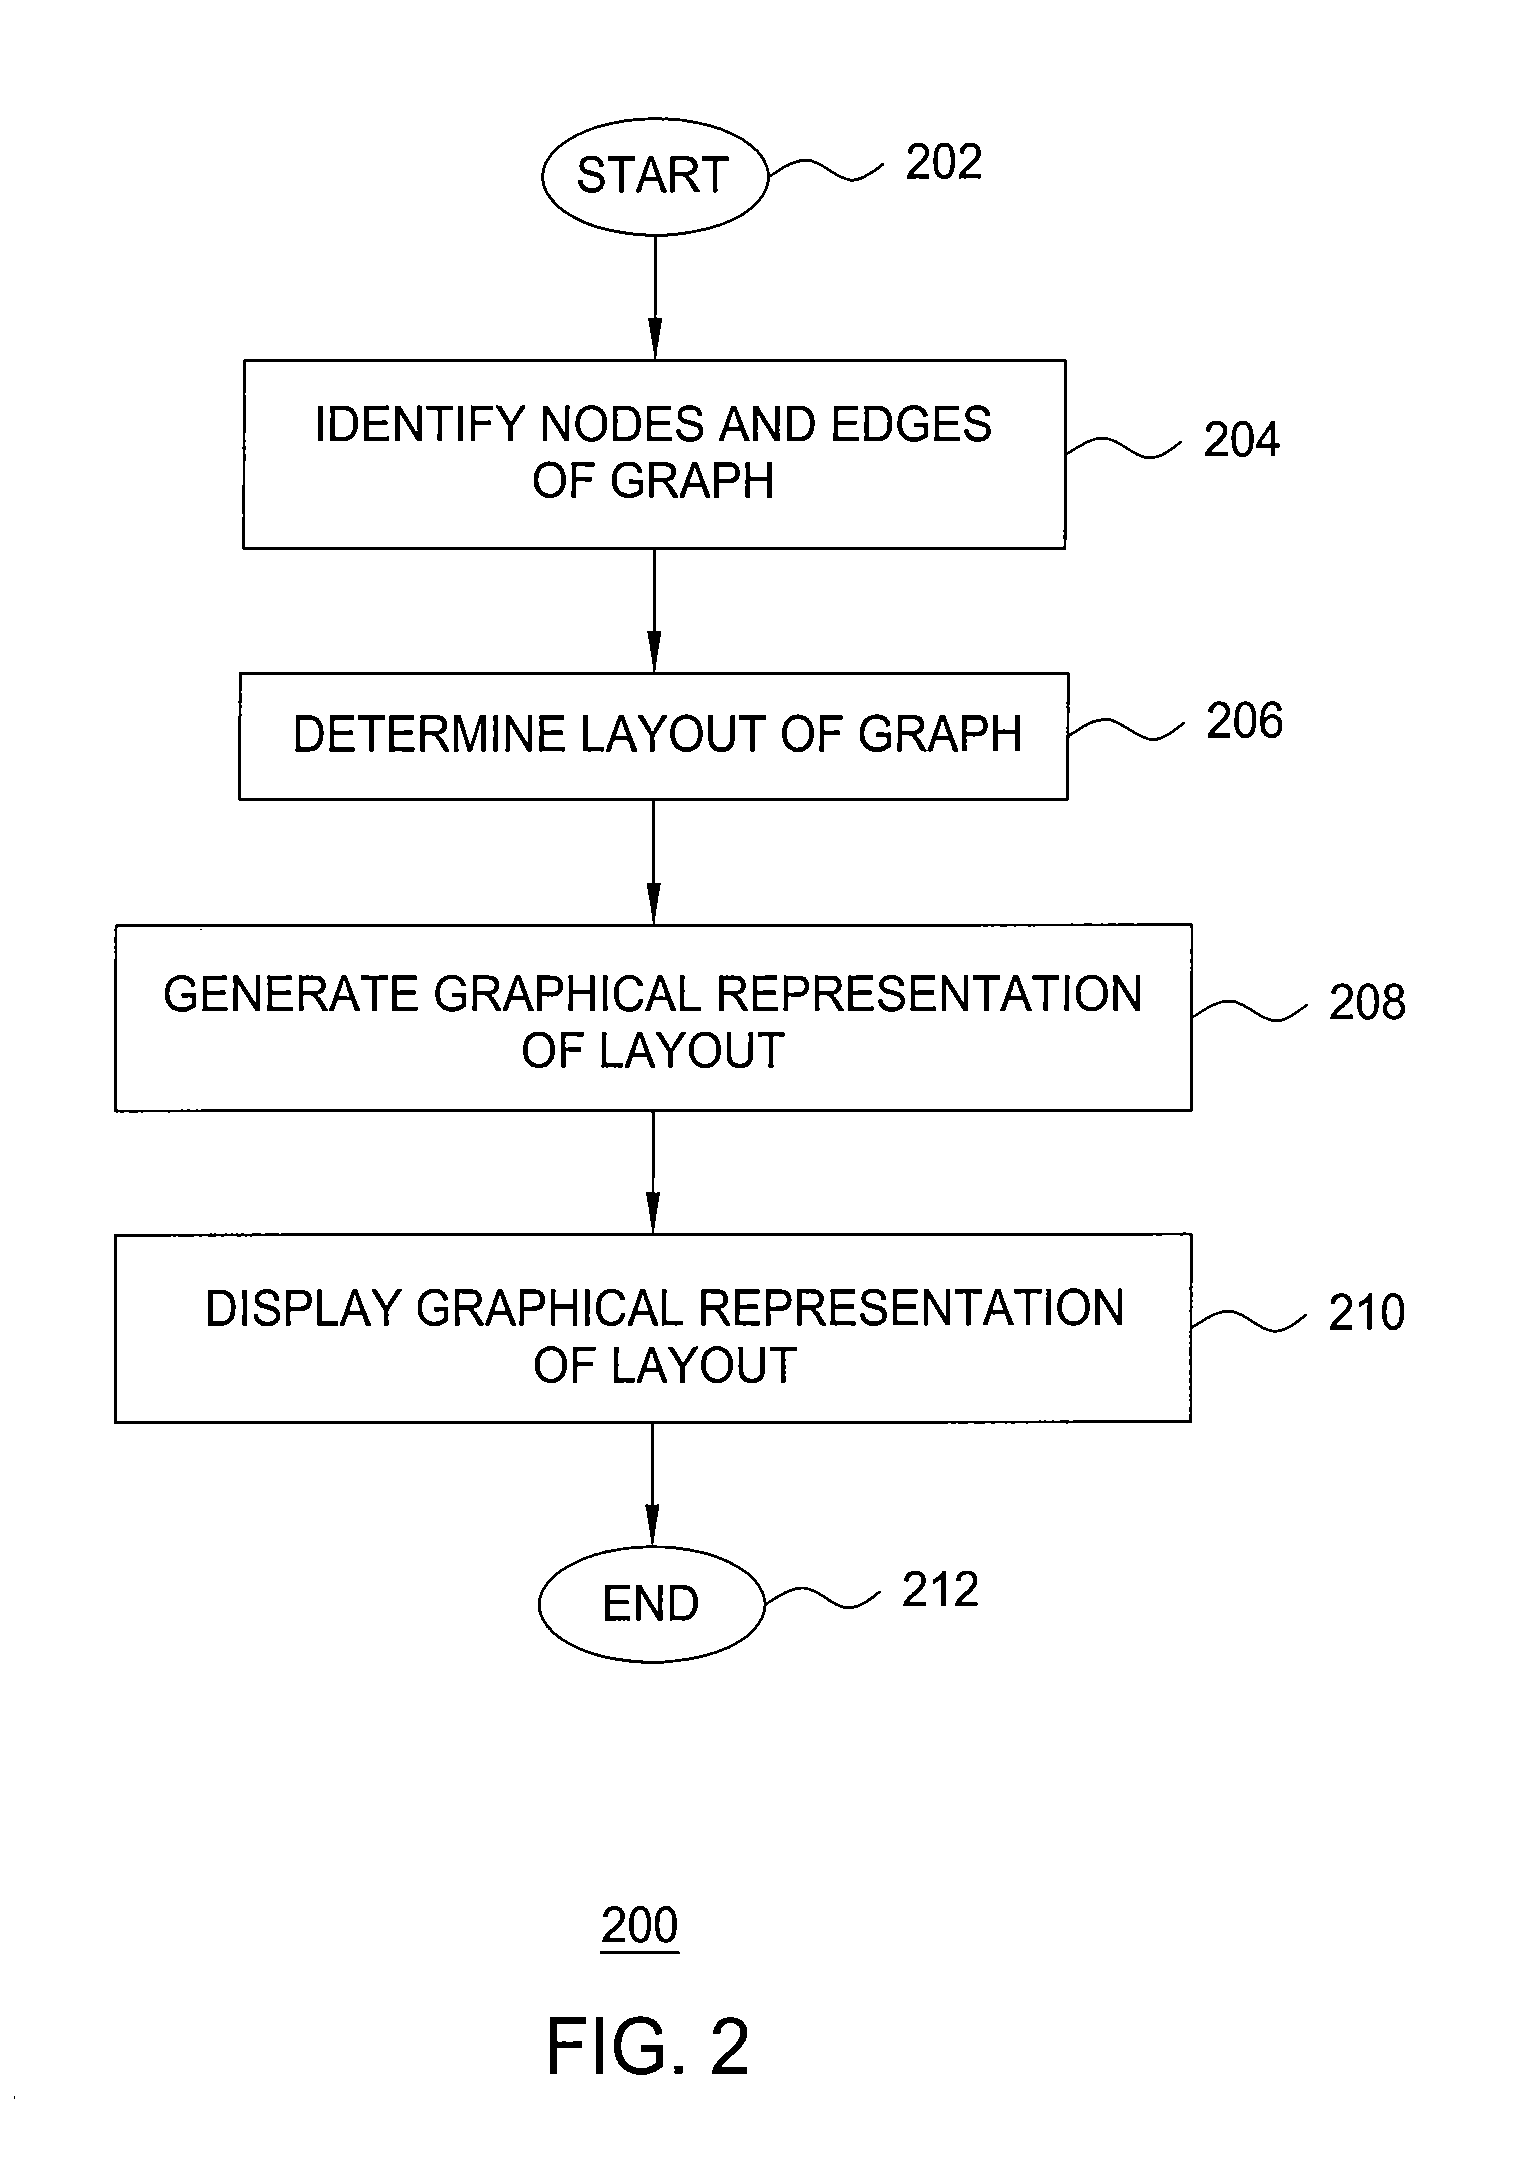
[0019]The present invention determines a layout of a graph having a plurality of nodes and a plurality of edges. The layout of the graph is determined by determining respective positions of nodes and respective positions of edges within the layout. In one embodiment, respective positions of the nodes are determined using one or more force models. In one embodiment, respective positions of nodes and respective positions of edges are each determined using one or more force models. A graphical representation of the determined layout of the graph is generated. The graphical representation of the layout of the graph is displayed to one or more users.

[0020]In one embodiment, respective positions of the nodes in the layout of are determined using a repulsive force model for each pair of nodes in the graph and an attractive force model for each pair of nodes in the graph that are connected by an edge. The repulsive force model includes a substantially linear repulsive force in a first regio...


PUM


Abstract

The invention includes a method and apparatus for displaying a graphical representation of a graph including nodes and edges. A layout of the graph is determined. The layout of the graph is determined by determining respective positions of each of the nodes and edges within the layout. The position of each node is determined using a first model and, optionally, a second force model, wherein the first force model comprises a substantially linear repulsive force in a first region, a substantially exponential repulsive force in a second region, and an attractive force in a third region. In one embodiment, the position of each edge may be determined using the first force model. A graphical representation of the layout is generated. The graphical representation of the layout is displayed to one or more users.

Description

FIELD OF THE INVENTION[0001]The invention relates to the field of graph layout algorithms and, more specifically, to generating layouts of state machines.BACKGROUND OF THE INVENTION[0002]Many companies use formal design techniques in system development processes, including techniques for formally specifying system behavior using state machines. In the past, state machines were typically represented using state machine tables and manually drawn state machines. Although such tables are easily stored and processed by computers, and many details may be specified within such tables in a readable format, large tables are not easily understood by design engineers. In an effort to simplify system design processes for design engineers, graph layout and graphical display generation algorithms have been developed which translate a tabular representation of a state machine into a graphical representation of the state machine. There are currently three primary categories of graph layout algorith...

Claims


Application Information

Patent Timeline
Patent Type & Authority Patents(United States)
IPC IPC(8): G06T11/20
CPCG06T11/206
Inventor HEINKEL, ULRICH KARLSCHNEIDER, AXELWALTER, STEPHAN
Owner PIECE FUTURE PTE LTD
Learn More