Methods and apparatus for visually representing a cardiac status of a patient

a technology for visually representing a patient's cardiac status and a patient's heart rate, which is applied in the field of methods and apparatus for visually representing a cardiac status of a patient, can solve the problems of not being able to perform non-trivial invasive procedures, not being feasible in all patients, and being difficult to achieve. , to achieve the effect of reducing the width of the filter waveform

Inactive Publication Date: 2015-03-03
MASSACHUSETTS INST OF TECH
View PDF8 Cites 1 Cited by
  • Summary
  • Abstract
  • Description
  • Claims
  • Application Information

AI Technical Summary

Problems solved by technology

The arterial blood pressure which is often monitored in intensive care unit patients provides a poor indication of cardiac output because of the body's extensive feedback system which can maintain arterial blood pressure in a narrow range despite wide variations in cardiac output.
Thermodilution has several disadvantages:(1) It requires the placement of a pulmonary artery catheter—this is a non-trivial invasive procedure and is not feasible in all patients, e.g. newborn infants.
This procedure is also very expensive and time and personnel intensive.(2) The measurement is not continuous in time—and generally is at most repeated every few hours.(3) The measurement is not always accurate, especially in low blood flow conditions.
This technique is also noncontinuous and personnel intensive.
This cumbersome method is regularly used only in the catheterization laboratory.
This technique suffers from the difficulty in stabilizing an external ultrasound transducer, the need to assume a cross-sectional flow profile of the blood in the aorta, and the uncertainty in the angle between the ultrasound beam and the aorta.
The Transonic Systems Flowmeter (Ithaca, N.Y.) utilizes an ultrasound transit-time principle to measure flow, but is not practical for routine clinical use, because it is highly invasive requiring the placement of a transducer directly around the aorta.
Conventional electromagnetic flowmeters are also not practical for routine clinical use because they also require placement of a transducer directly around the aorta.
Bioimpedance changes are only indirectly related to changes in cardiac flow and are especially unreliable in patients with cardiovascular or respiratory illnesses in which the electrical impedance properties of the thorax are altered.
These attempts were for the most part based on semi-empirical mathematical formulas, and failed to yield good correlation between stroke volume derived from analysis of the arterial pressure waveform and true stroke volume over a range of physiologic conditions.
However, the method of Bourgeois et al only worked when the diastolic decay of the aortic blood pressure waveform was described by a perfect exponential function.
Clinically, because of the risk of blood clot formation and embolization it is not practical to leave an aortic catheter in place.
The method of Bourgeois fails when a peripheral arterial trace is used as input, thus rendering the technique useless from a clinical point of view.
Moreover, the method of Bourgeois suffers from several other defects.
The method of Bourgeois provides a measure proportional to stroke volume for each beat but does not provide the actual phasic cardiac output signal.
This method for the determination of the end of systole may be inaccurate, particularly for peripheral arterial pressure traces where the dicrotic notch may be shifted, distorted or absent.
This method suffers from a number of defects.
At one of the sites (carotid artery) one cannot safely place a catheter, rendering continuous monitoring of arterial pressure and thus cardiac output impossible; the second site (femoral artery) also is not suitable for leaving an arterial catheter in place for prolonged periods or otherwise continuously measuring arterial pressure at this site.
However, this method does not provide a continuous signal proportional to cardiac output nor does it provide a means for estimating stroke volume on a beat-to-beat basis.

Method used


Image

  • Methods and apparatus for visually representing a cardiac status of a patient
  • Methods and apparatus for visually representing a cardiac status of a patient
  • Methods and apparatus for visually representing a cardiac status of a patient

Examples


example 1

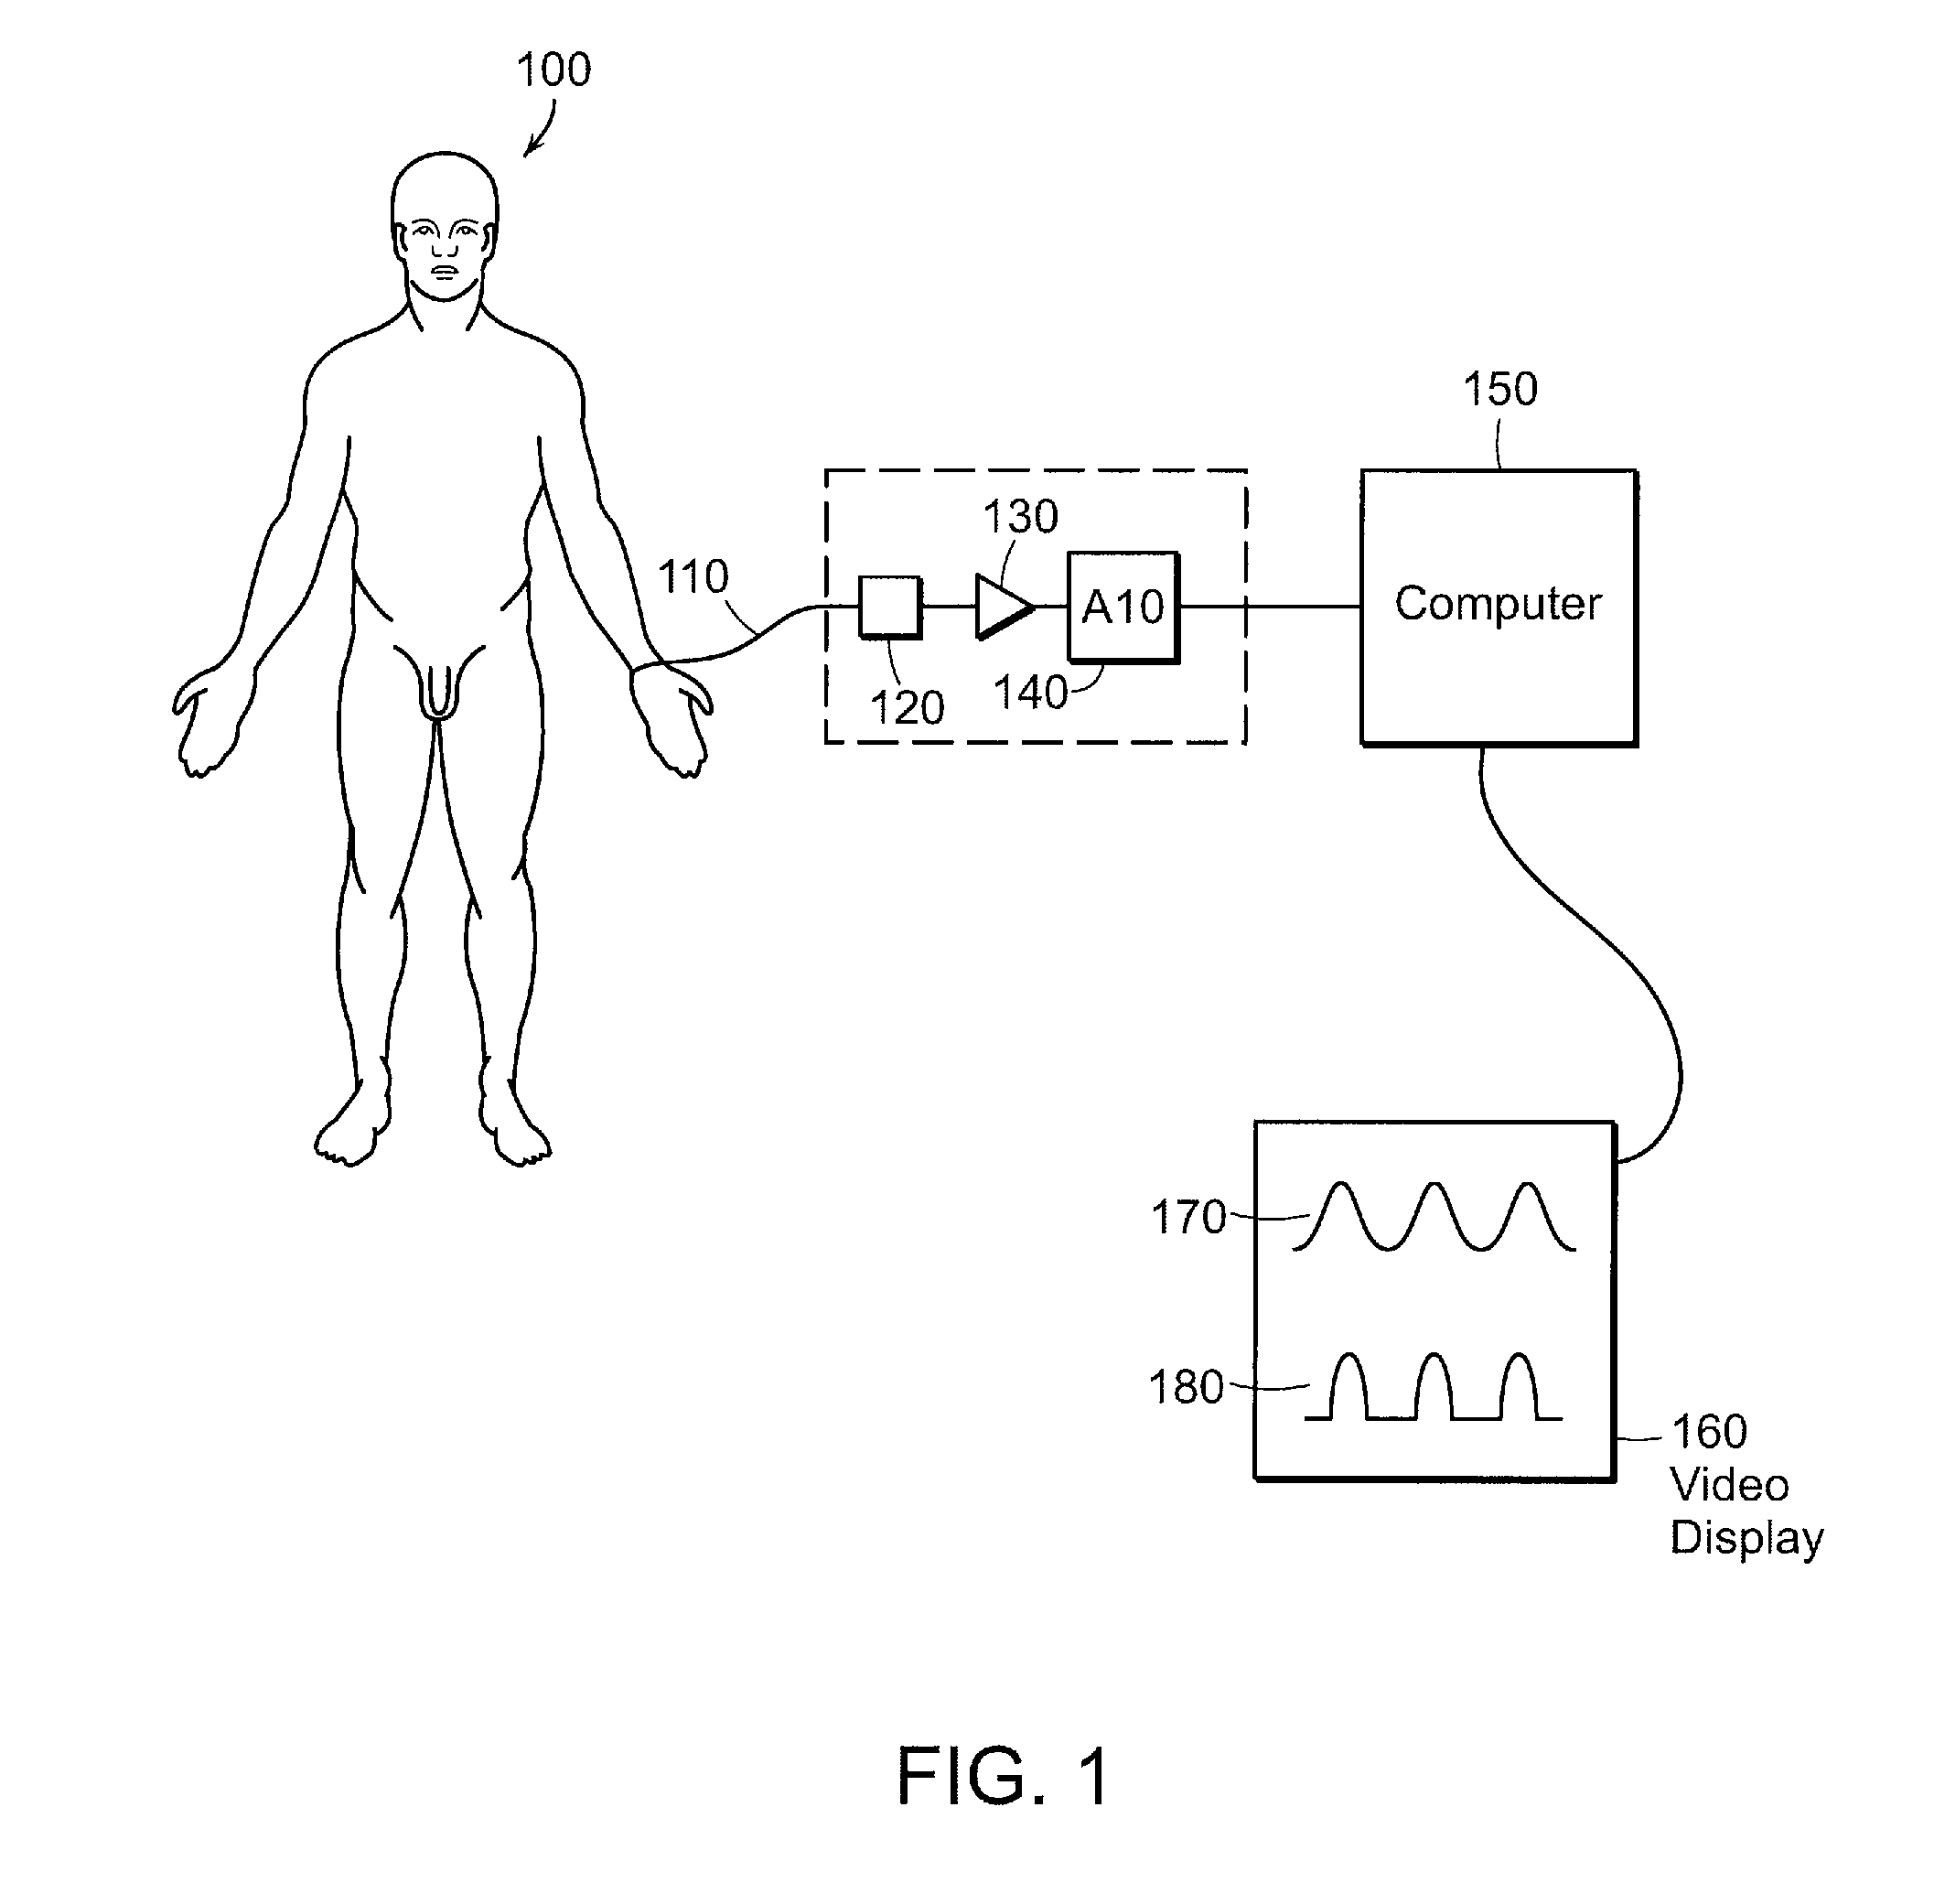
[0053]In this example (see FIG. 1), the input signal is a central or peripheral arterial signal recorded by means of an indwelling catheter or a noninvasive continuous arterial blood pressure transducer. In the case of a fluid filled catheter (110) placed, for example, in the radial artery of a patient (100) the catheter is interfaced with a transducer (120) which converts the pressure in the fluid in the catheter into an electrical signal. This electrical signal is amplified and conditioned by means of an electronic amplifier (130). This amplifier may be incorporated in an existing bedside monitor which interfaces with the appropriate blood pressure sensor. The amplified and conditioned electrical signal is converted into digital form by means of an analog to digital converter (140). A digital computer (150) is used to construct a transforming filter and to apply this filter to the input signal in order to compute an output signal proportional to the phasic cardic output. A video s...

example 2

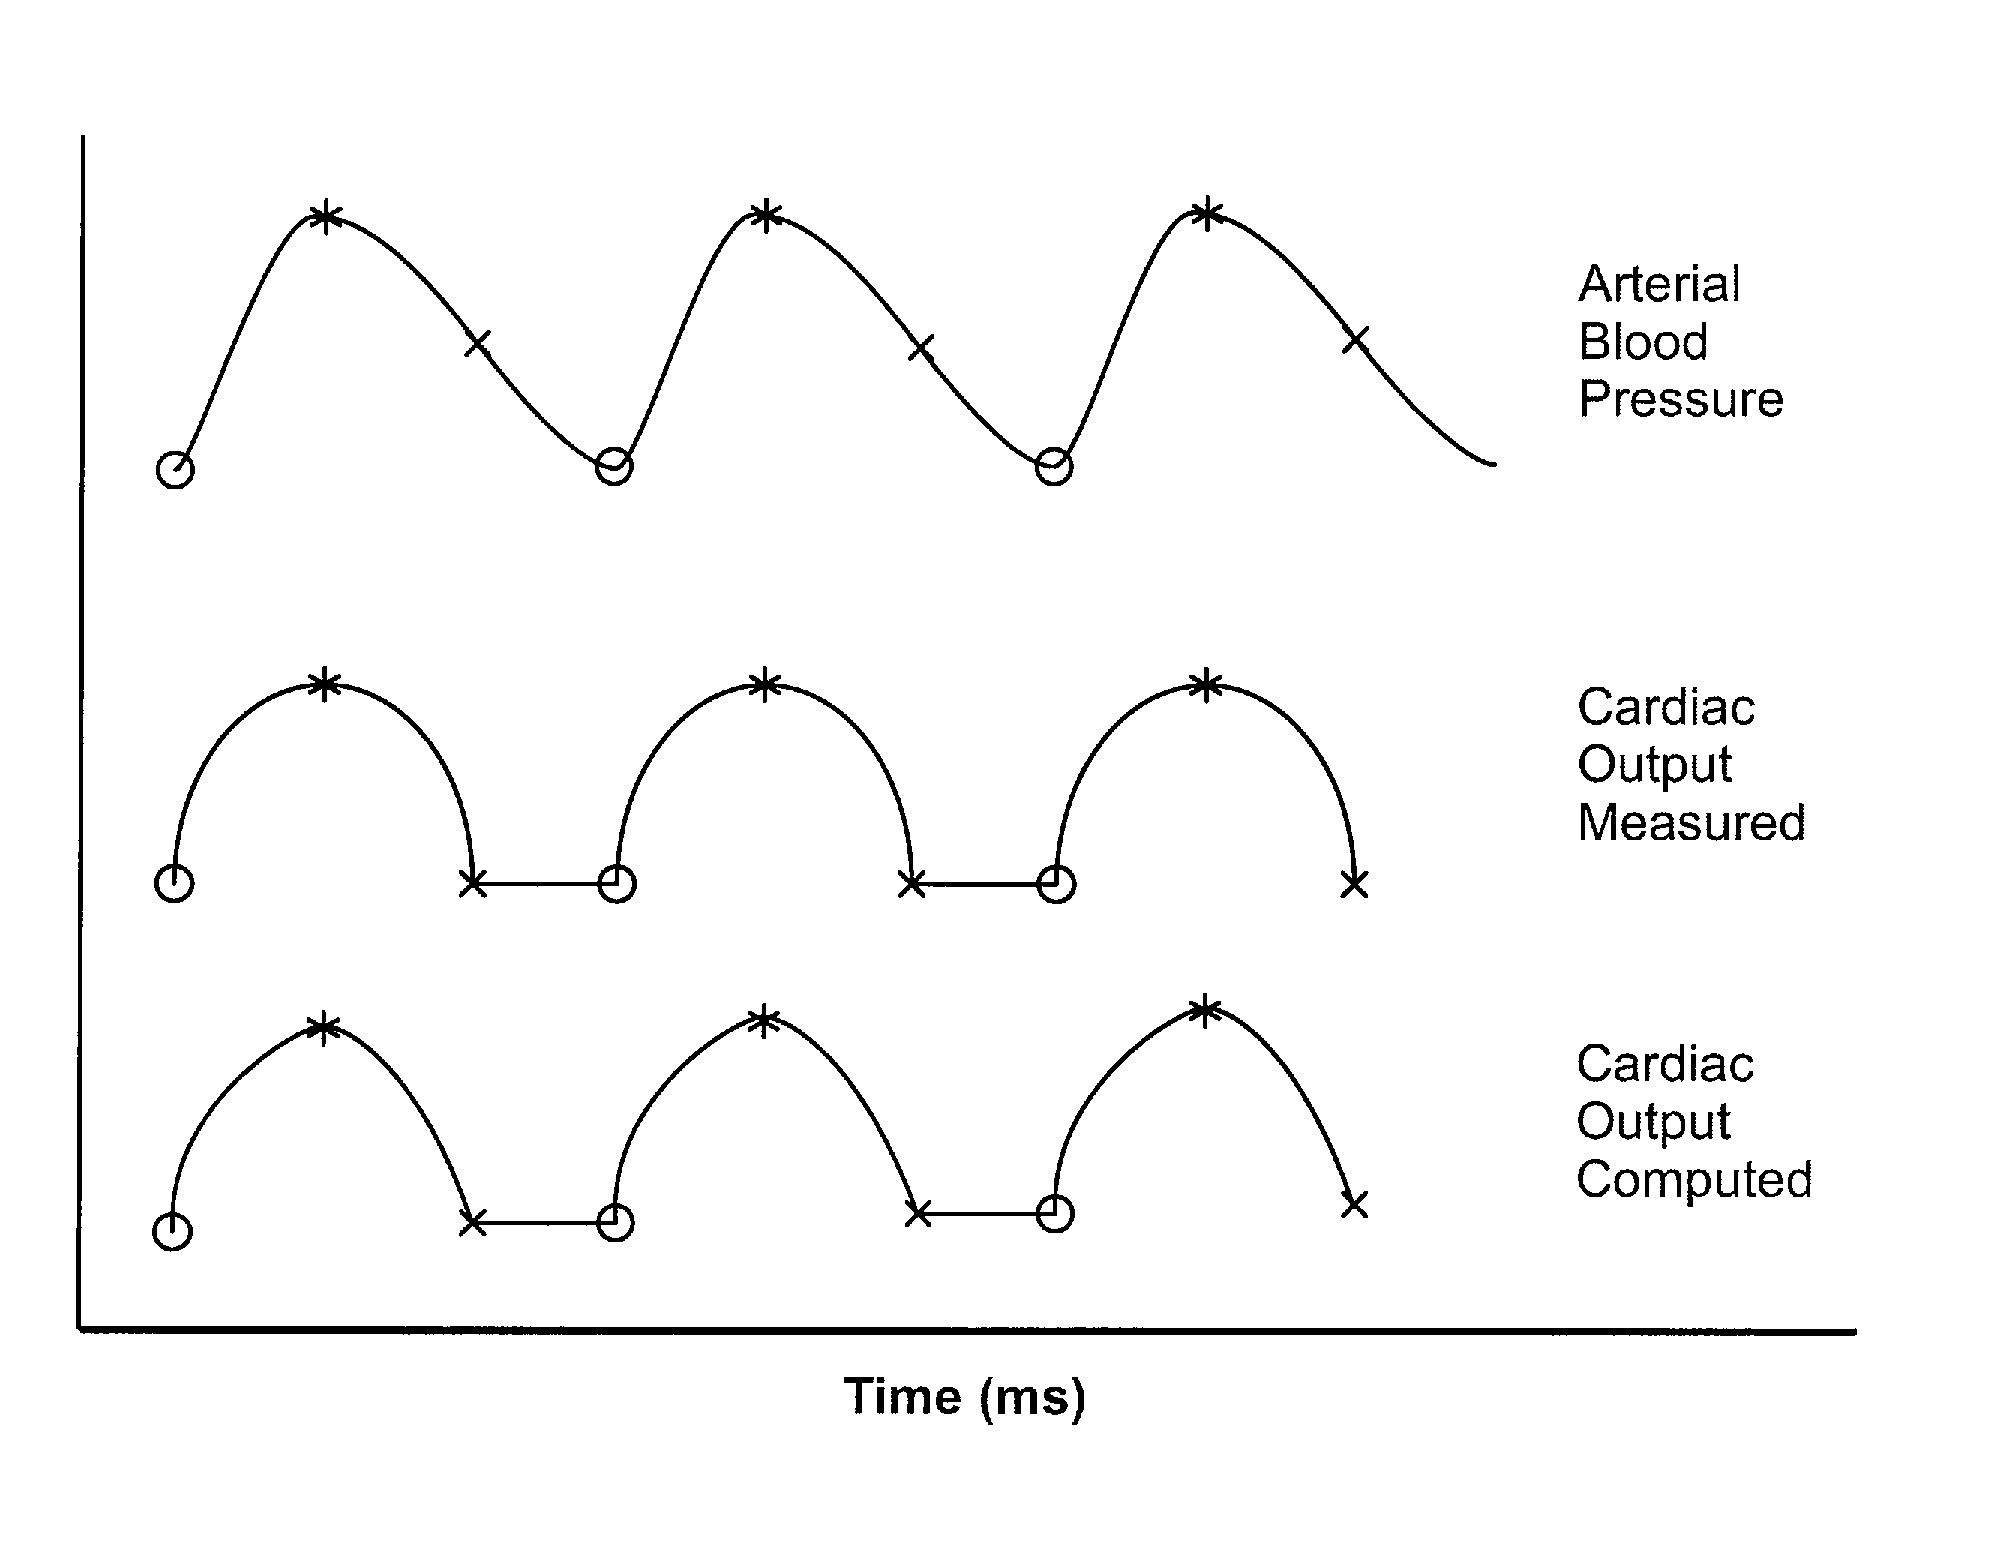
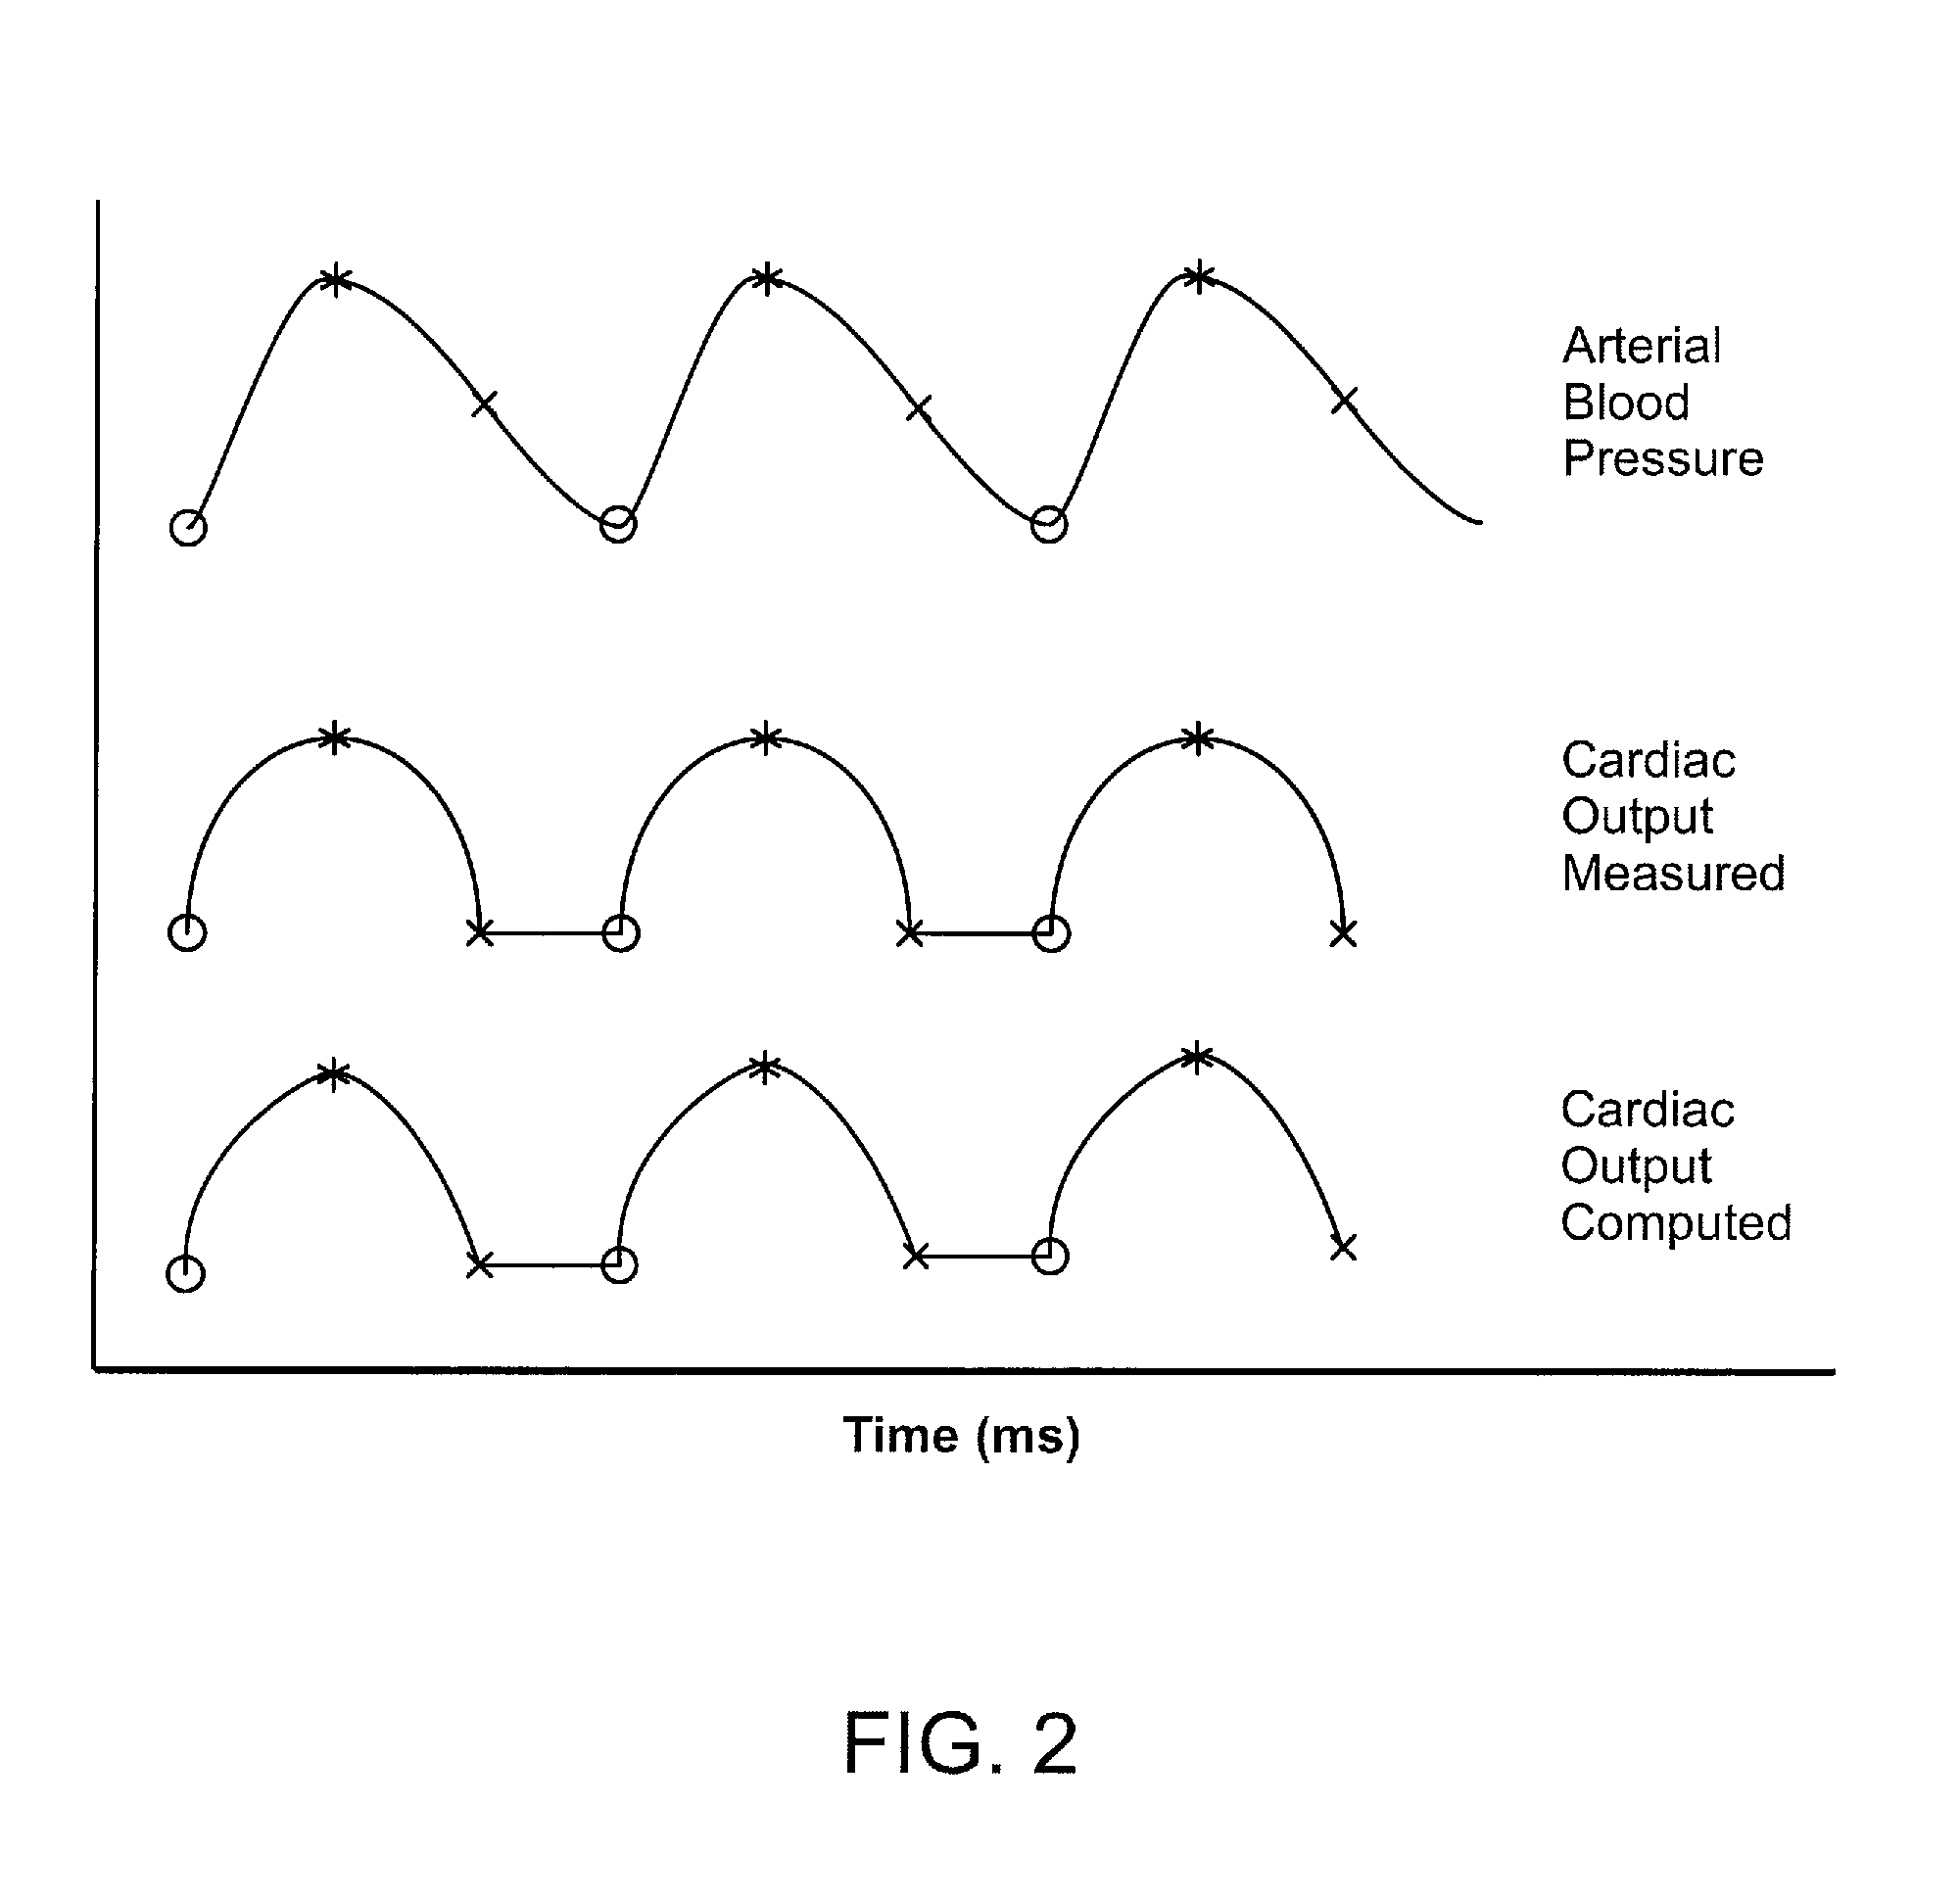
[0086]In a preferred embodiment the transforming filter is constructed utilizing two filters one of which is a nonlinear filter. First, a non-linear filter is utilized which involves computing the logarithm of the arterial blood pressure signal (y=ln(Pa) and then computing the second derivative of the resulting signal yielding d2y / dt2. In this preferred embodiment a second filter, h, is then applied to d2y / dt2 and the properties of the filter, h, adjusted to reduce the output signal from the filter during the diastolic periods. In this preferred embodiment the output signal from this second filter, d2z / dt2, will represent an estimate of the second derivative of the logarithm of the central aortic pressure (z≅ ln(PA)). The first integral of d2z / dt2, dz / dt, (the integration constant adjusted to set the time average of dz / dt to zero) may then be computed. The value of dz / dt evaluated during the diastolic periods will provide an estimate of −1 / τ where τ is the central aortic decay time ...


PUM


Abstract

Method and apparatus are provided for computing signals related to cardiac output from physiologic input signals related to circulatory pressures or flows. Method and apparatus are provided for constructing a transforming filter and applying said filter to the physiologic input signals in order to obtain a signal proportional to phasic cardiac output or time-averaged cardiac output. This invention provides a means for real-time monitoring of cardiac output and stroke volume which is of great clinical importance but not otherwise feasible by present techniques.

Description

[0001]This application claims the benefit, under 35 U.S.C. §371, as a national stage application of International Application No. PCT / US2009 / 040299, filed Apr. 13, 2009, which claims the benefit of U.S.Provisional Patent Application Ser.No. 61 / 045,063, filed Apr. 15, 2008. The contents of each of the above-identified applications are incorporated herein by reference in their entirety.[0002]A Computer Program Listing Appendix (147,456 bytes) was created on Nov. 11, 2014, and submitted in duplicate on two identical compact discs. The contents of the Computer Program Listing Appendix were present in PCT / US2009 / 040299 and are incorporated herein by reference in their entirety.BACKGROUND OF THE INVENTION[0003]Cardiac output, or total blood flow to the periphery, is perhaps one of the most vital quantities to be able to monitor in a critically ill patient. A decrease in cardiac output may be one of the first indicators of a deterioration in circulatory function. Conversely, an increase in...

Claims


Application Information

Patent Timeline
Patent Type & Authority Patents(United States)
IPC IPC(8): A61B5/02A61B5/021A61B5/029
CPCA61B5/029A61B5/021
Inventor COHEN, RICHARD J.
Owner MASSACHUSETTS INST OF TECH
Why Eureka
Try Eureka