
Cartoon analysis method for geographic distribution and time trend of price of commodity

A commodity price and price technology, applied in the direction of animation production, commerce, image data processing, etc., can solve the problems that the price figures are too abstract and cannot describe the historical price change trend vividly, so as to improve price competitiveness and profit margin, and achieve a large economy benefit, cost reduction effect

Inactive Publication Date: 2010-05-12
BEIJING HUAXIASHENRONG INFORMATION TECH
View PDF0 Cites 6 Cited by
  • Summary
  • Abstract
  • Description
  • Claims
  • Application Information

AI Technical Summary

Problems solved by technology

The price figure is too abstract to establish a visual connection between the price information of the product and the geographical location where the product is sold, nor can it describe the historical price change trend of the product at that location

Method used


Image

  • Cartoon analysis method for geographic distribution and time trend of price of commodity
  • Cartoon analysis method for geographic distribution and time trend of price of commodity
  • Cartoon analysis method for geographic distribution and time trend of price of commodity

Examples


Embodiment Construction

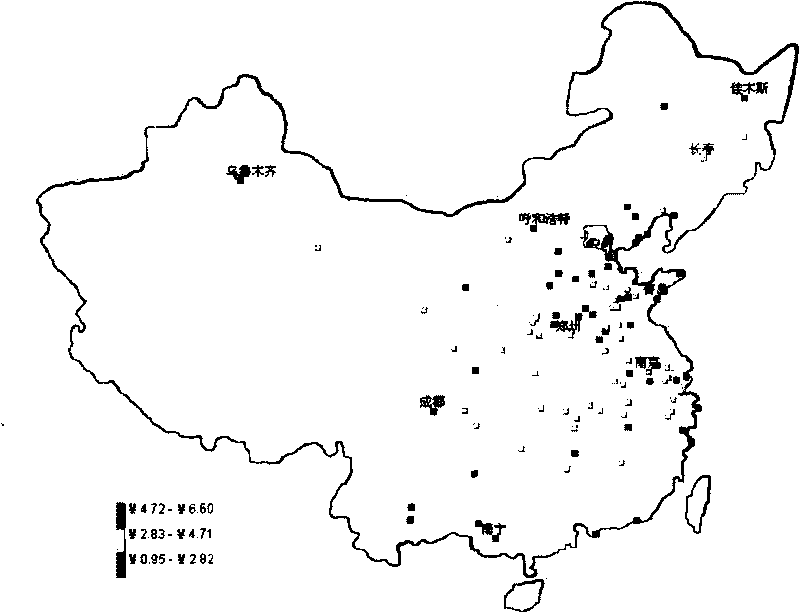
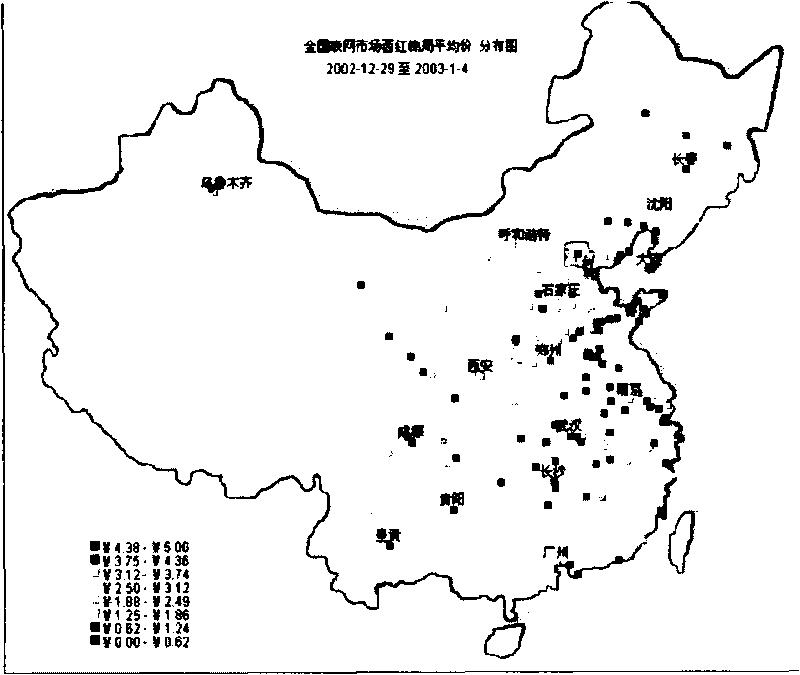
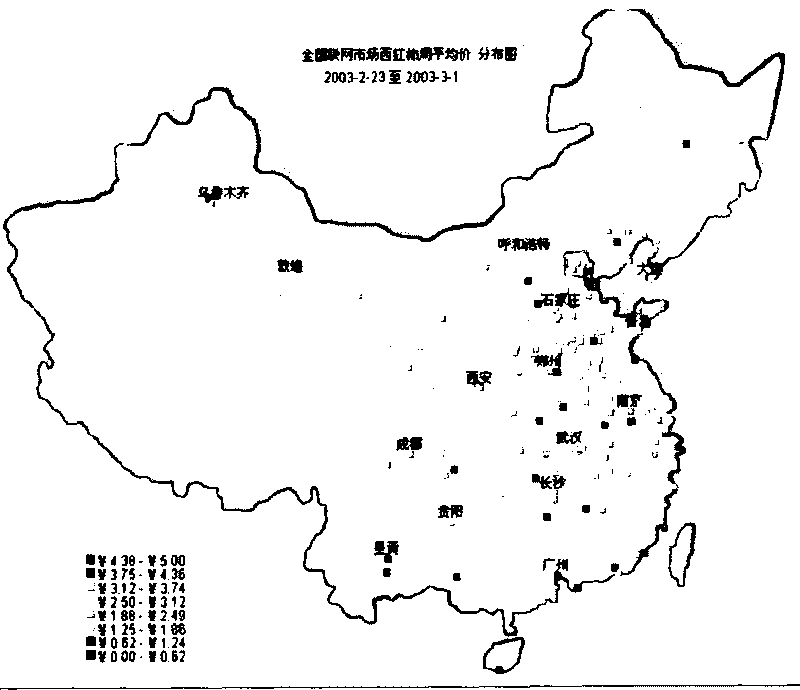
[0037] combine Figure 1 to Figure 8 , which specifically introduces the embodiments of the present invention.

[0038] 1. Select a product.

[0039] 2. According to a certain time scale (such as every day, every week, every ten days, every month, etc.), collect the price information of the commodity in various markets (wholesale price and retail price are acceptable, as long as they are consistent).

[0040] 3. Set the level of price information. Generally, the actual price range is divided into 3-10 levels from low to high, and the higher the level, the higher the price. The number of levels depends on the purpose of the analysis and the number of markets. Generally speaking, if you want to obtain the global large law of price distribution, you should have fewer levels; if you want to get the local small law of price distribution, you should have more levels. If there are many markets, there should be more grades; if there are few markets, there should be fewer grades. ...


PUM


Abstract

The invention relates to a cartoon analysis method for the geographic distribution and the time trend of the price of a commodity in the field of economic analysis. The method comprises the following steps: (1), manufacturing a background diagram with the geographical position of each market; (2), dividing the price of a designated commodity in each market into a plurality of sections; (3), setting the color value of each price section; (4), drawing a commodity price distribution diagram: drawing a colored spot distribution diagram; marking one spot at the geographical position of each market in the background diagram; fully filling the spots of the color values according to the color values set by the price section of each market, wherein the colored spots can also be expanded into the polygon of a representative area of the market and are connected with the polygon of each adjacent market in a seamless way, and a colored cloud-shaped distribution diagram is drawn; and (5), manufacturing a commodity price dynamic distribution cartoon, drawing a plurality of distribution diagrams according to different time points and displaying each diagram continuously according to a time sequence at a designated speed to form the cartoon. The invention provides a vivid and dynamic commodity price analysis technology, can guide the production and the sale of commodities, improves a production plan, promotes the commodity circulation and meets the consumption requirement.

Description

1. Technical field: [0001] The field of economic information analysis 2. Background technology: [0002] There are many types of commodities, especially agricultural products, which will have different sales prices when they are sold in different regions and at different times. The drive of price differences will promote the circulation of commodities. Analyzing the circulation trend of commodities in a period will not only obtain commercial benefits, but also promote the sales of commodities, stabilize the contradiction between supply and demand in the market, and meet consumer needs. But at present, there is no simple, effective and intuitive analysis method for commodity prices. Currently used methods and their problems: [0003] (1) List method: List the prices of commodities in the form of tables. It cannot provide users with an image thinking description based on time and place. [0004] (2) Time domain broken line analysis method: select the price of a certain com...

Claims


Application Information

Patent Timeline
IPC IPC(8): G06T11/00G06T13/00G06Q30/00
Inventor 崔文顺崔硕李建玲
Owner BEIJING HUAXIASHENRONG INFORMATION TECH
Learn More