Method for dynamically and visually displaying network relationship

A display method and relationship technology, which is applied in the field of dynamic visualization display of network relationship graphics, and can solve problems such as unseen

Inactive Publication Date: 2011-07-27
中国医学科学院医学信息研究所
View PDF0 Cites 6 Cited by
  • Summary
  • Abstract
  • Description
  • Claims
  • Application Information

AI Technical Summary

Problems solved by technology

However, in the prior art, there are ...

Method used


Image

  • Method for dynamically and visually displaying network relationship
  • Method for dynamically and visually displaying network relationship
  • Method for dynamically and visually displaying network relationship

Examples


Embodiment Construction

[0045] The preferred embodiments of the present invention will be specifically described below in conjunction with the accompanying drawings.

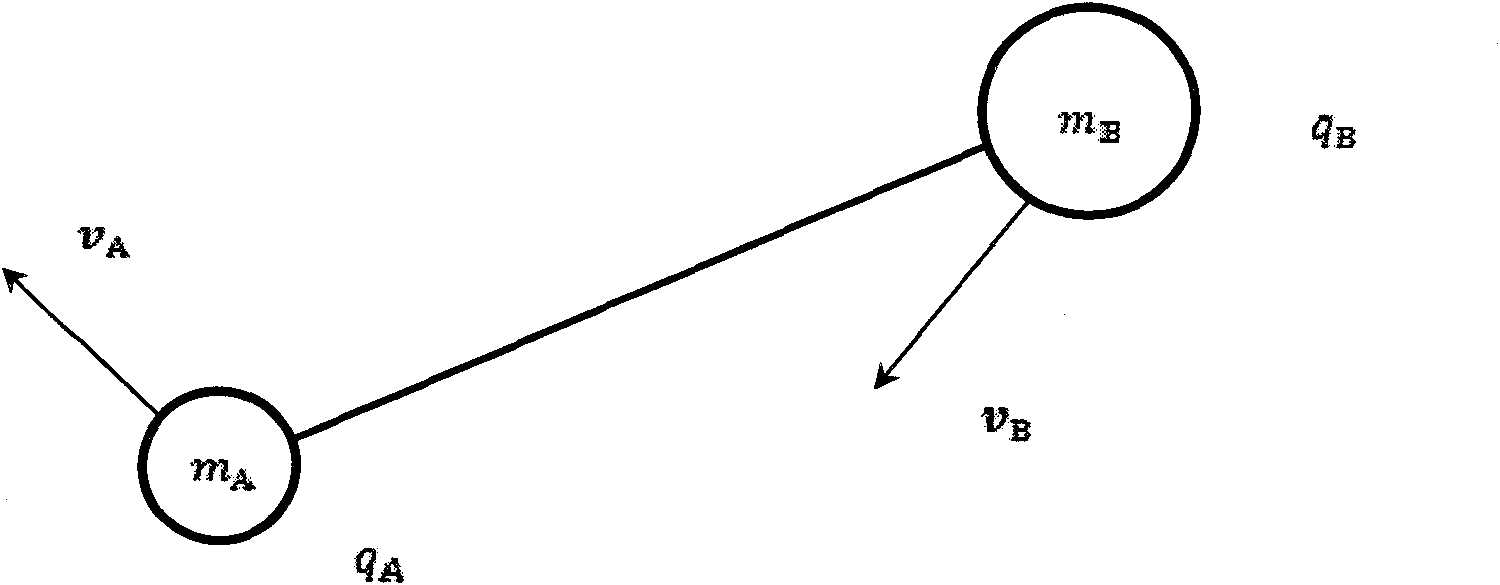
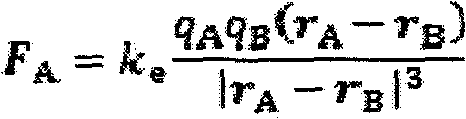
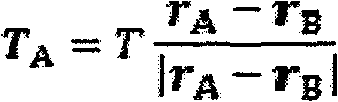
[0046] This embodiment implements the method for dynamically visually displaying the network relationship described in the present invention. In order to realize the simulation of nodes and relationships, some common tools can be used, such as defining nodes and relationships as corresponding classes through object-oriented methods, and defining the physical laws obeyed by charged particles and springs as class property or method. Alternatively, directly define the calculations of electrostatic repulsion, spring force, and damping resistance as corresponding functions, and call the functions when calculating the node positions.

[0047] In an embodiment, nodes are dynamically loaded and deleted during the running of the program according to the user's choice. For example, display the node that the user is most concerned about in the ce...


PUM


Abstract

The invention relates to a method for dynamically and visually displaying a network relationship graph. The method comprises the following steps of: firstly, simulating all nodes into mass points with the same electric charges; secondly, simulating relationships among the nodes into springs; and thirdly, setting the initial position and displaying speed of every node, calculating the position of the node at the moment of a next frame according to electrostatic repulsion and spring tension which are applied to the node, and displaying. By the method, the network relationship is simulated into a real physical system which consists of the mass points with the electric charges and the springs, so that a vivid and interesting manifestation mode capable of attracting the sight of users is provided to show the network relationship graph, and the network relationship graph can be shown more flexibly.

Description

technical field [0001] The invention relates to a graph representation method, in particular to a dynamic visualization display method of network relation graphs. Background technique [0002] Graph is a data structure widely used in many fields. Various complex relationships in the real world are often abstracted into network relationships and represented by network relationship graphs. [0003] Representation of complex networked relational graphs is a difficult problem. First of all, if the intricate network relationship is presented in front of the user regardless of primary and secondary, the user cannot see the connection of each node from the network relationship diagram, and thus cannot obtain the required information from the relationship diagram. Secondly, in the network relationship graph, the number of associated nodes and associated relationships of each node is different. When displaying network relationship graphs, if the nodes that the user cares about are...

Claims


Application Information

Patent Timeline
IPC IPC(8): G06T11/00
Inventor 代涛池慧高东平李扬孙晓北胡世平钱庆方安洪娜安新颖王敏钟华
Owner 中国医学科学院医学信息研究所
Why Eureka
Try Eureka