Method and device for completely displaying column diagram of measured data

A technology for measuring data and histograms, applied in the field of electrical variable testing, can solve problems such as the inability to accurately determine the center point of the abscissa of the histogram, and the number of histograms with limited integrity.

Active Publication Date: 2012-05-23
RIGOL
View PDF6 Cites 5 Cited by
  • Summary
  • Abstract
  • Description
  • Claims
  • Application Information

AI Technical Summary

Problems solved by technology

[0004] Can find out the shortcoming that prior art exists from the method for drawing histogram in prior art: one, the integrality of measurement data that prior art histogram shows is limited by the number of described histogram graph column, give a simple example , if a set of measurement data obtained is 0, 2, 5, 7, 6, the number of histogram columns in the display window is two, the average value of this set of data is 4, and the standard deviation value is 2.4 , taking the standard deviation value 2.4 as the step v

Method used


Image

  • Method and device for completely displaying column diagram of measured data
  • Method and device for completely displaying column diagram of measured data
  • Method and device for completely displaying column diagram of measured data

Examples


Embodiment Construction

[0030] Preferred embodiments of the present invention will be described in detail below in conjunction with the accompanying drawings,

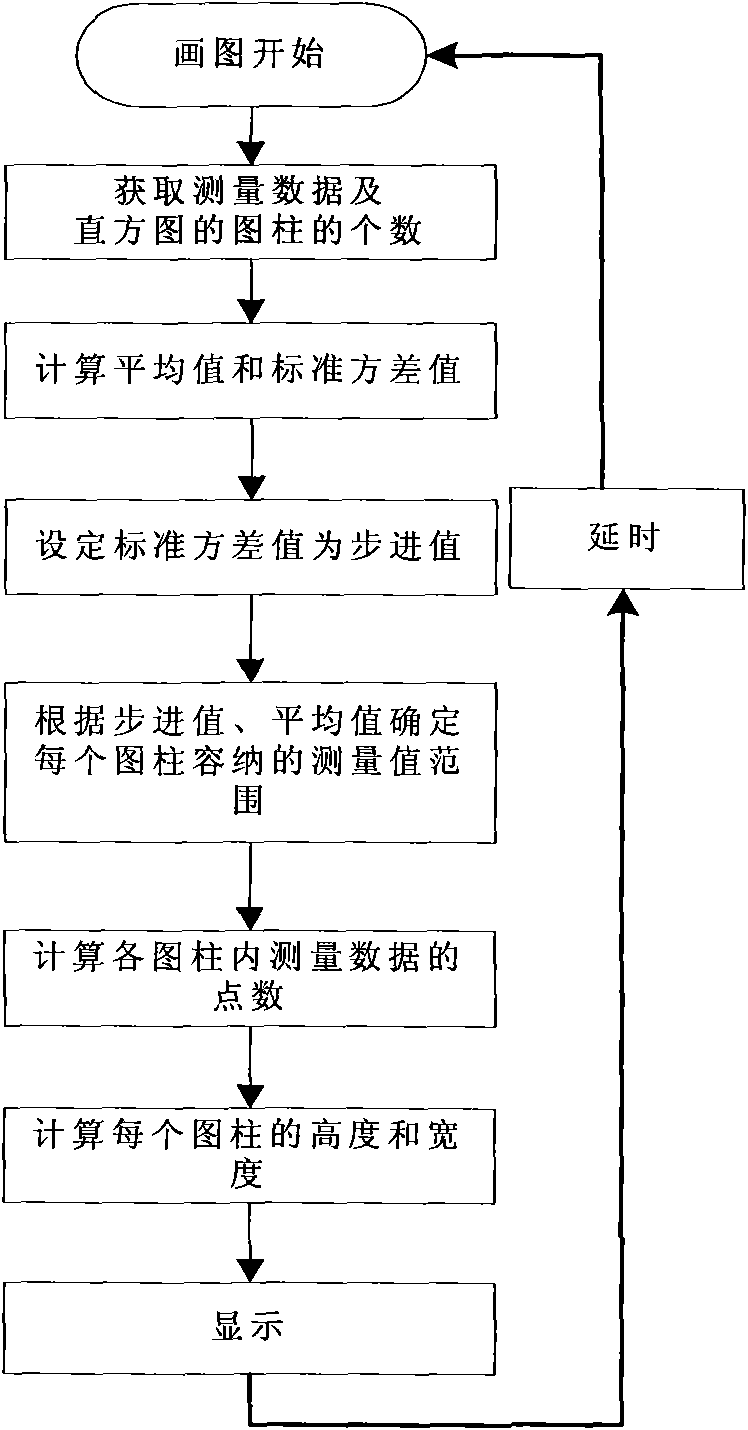
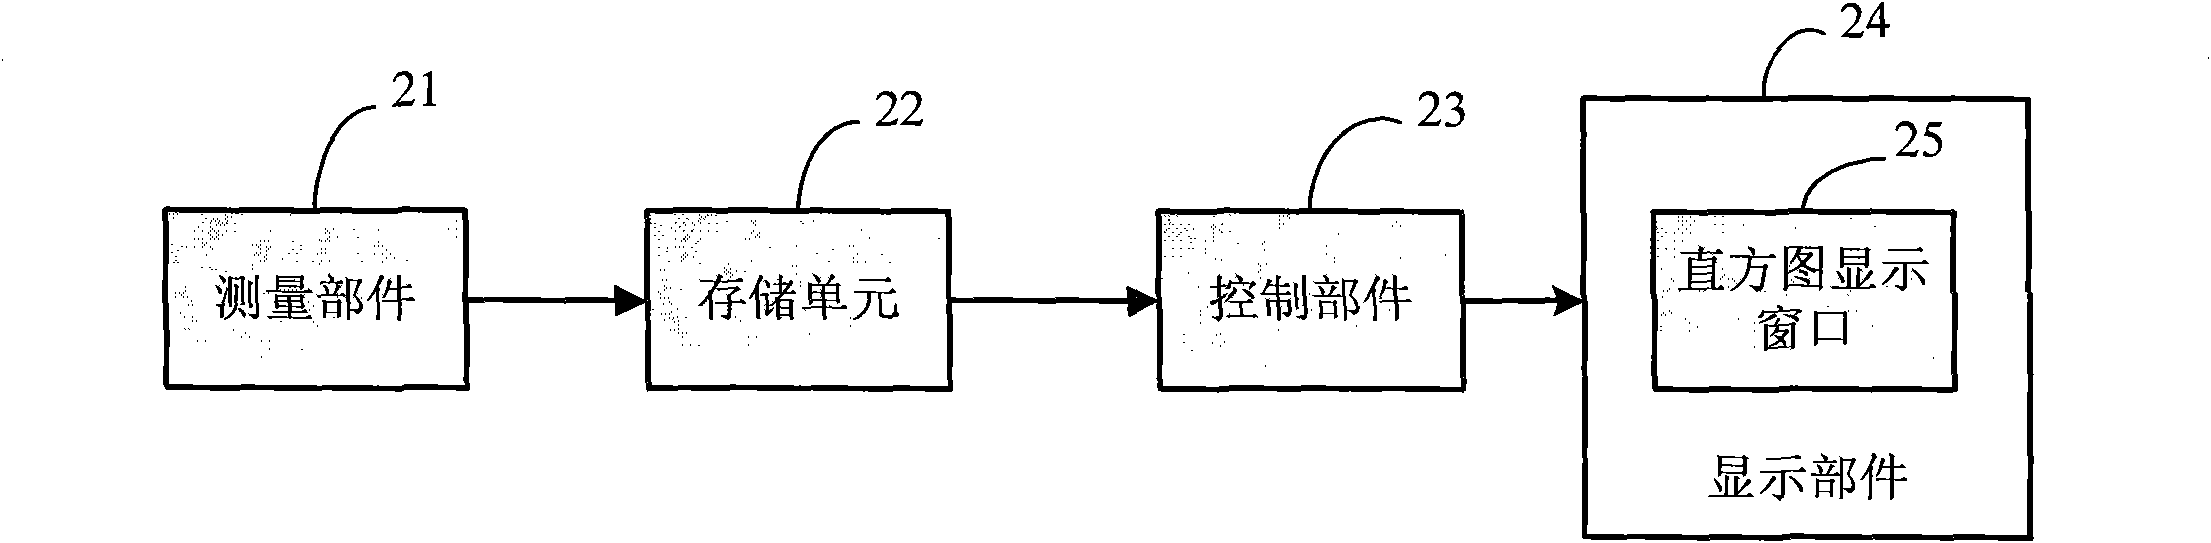
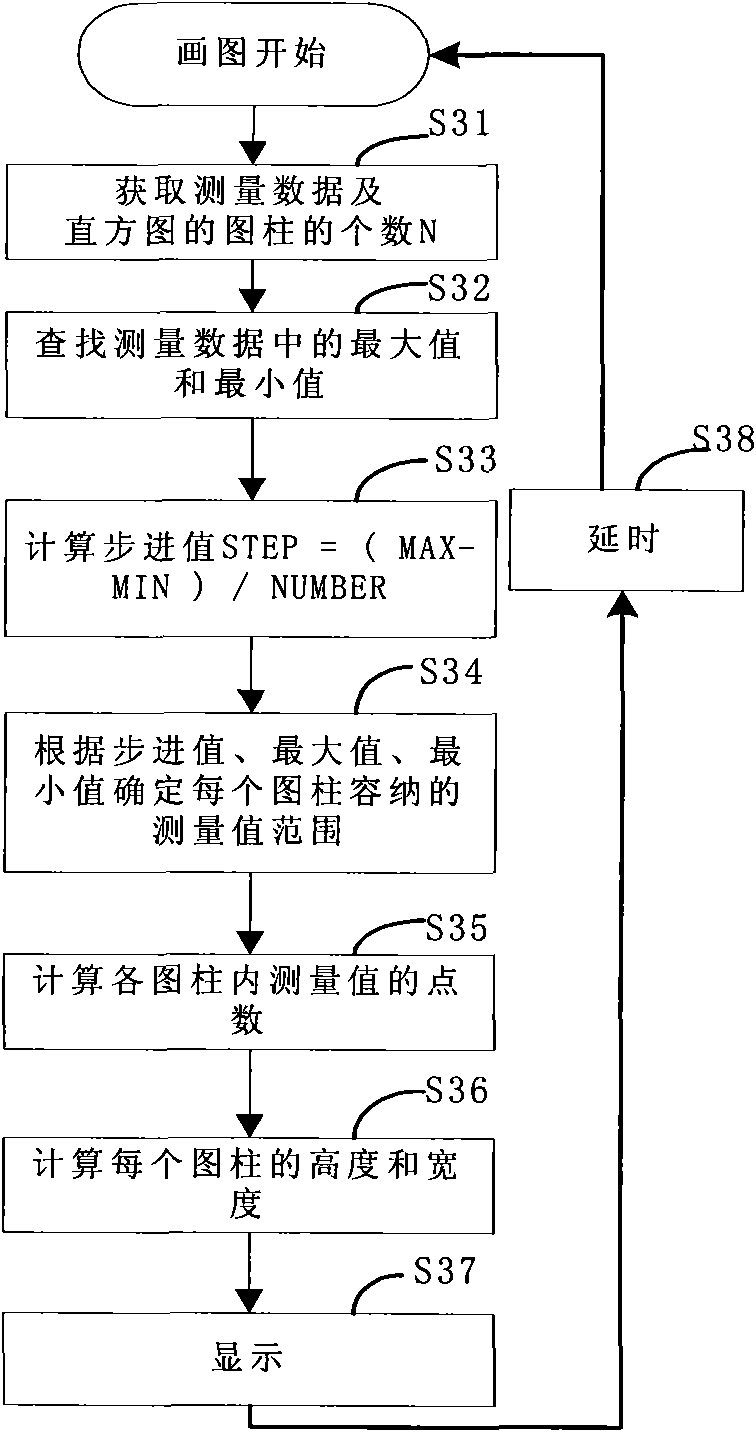
[0031] refer to figure 2 , is a device of the present invention to realize a preferred embodiment of a real-time histogram for complete display of measurement data, including a measurement unit 21, a storage unit 22, a control unit 23, and a display unit 24, and the measurement unit 21 is used for Generate measurement data, the storage unit 22 is used to save the measurement data, the control unit 23 is used to generate display data according to the measurement data, and the display unit 24 is used to present the Display data; described display part 24 comprises a histogram display window, and described control part 23 is used for obtaining a group of described measurement data, and the quantity of this group of measurement data can be any number, as long as satisfy control part 23 The processing capacity is enough, find the maximum and min...


PUM


Abstract

The invention provides a method and a device for completely displaying a column diagram of measured data. The device comprises a measurement part, a display part, a control part and a storage unit. The method comprises the following steps of: acquiring the measured data and the number of columns of the column diagram; searching the maximum value and the minimum value in the measured data; calculating a stepping value according to the maximum value, the minimum value and the number of the columns; determining a measured data range accommodated by each column according to the stepping value; calculating the number of points of the measured data in each column; calculating the height of each column according to the number of the points of the measured data, and taking a ratio of the width of a column diagram display window to the number of the columns as the width of each column; and drawing and displaying the column diagram according to the widths and the heights of the columns. By the method and the device, an effect of completely displaying the column diagram of the measured data, and the number of the columns of the column diagram can be freely set by a user.

Description

technical field [0001] The invention relates to the field of electric variable testing, in particular to a method and a device for displaying a histogram of measurement data in electric variable testing. Background technique [0002] With the continuous development of test and measurement technology, the functions of various measurement equipment are also increasing. For example, in the measurement equipment, the measurement data can be displayed in the form of a histogram. A histogram is a statistical tabular form in mathematics. The histogram uses multiple rectangles of different heights to represent the distribution of measured data. [0003] In the prior art, the histogram is mainly constructed based on the average value and standard deviation in the measurement data. The basic composition principle is: first obtain a set of measurement data, calculate the average value and standard deviation of the measurement data, and determine the histogram column number, and make t...

Claims


Application Information

Patent Timeline
IPC IPC(8): G01R13/00
Inventor 王悦王铁军李维森
Owner RIGOL
Why Eureka
Try Eureka