
Method for evaluating R value and power spectrums of electroencephalogram signals causing discomfort when people watch three-dimensional (3D) images

A technology of EEG signals and evaluation methods, applied in the direction of sensors, medical science, diagnostic recording/measurement, etc., can solve problems such as research work development, and achieve the effect of promoting development

Active Publication Date: 2012-09-12
INST OF BIOMEDICAL ENG CHINESE ACAD OF MEDICAL SCI
View PDF7 Cites 15 Cited by
  • Summary
  • Abstract
  • Description
  • Claims
  • Application Information

AI Technical Summary

Problems solved by technology

Regarding the discomfort such as visual fatigue caused by watching 3D images, corresponding research work has been carried out relatively little

Method used


Image

  • Method for evaluating R value and power spectrums of electroencephalogram signals causing discomfort when people watch three-dimensional (3D) images
  • Method for evaluating R value and power spectrums of electroencephalogram signals causing discomfort when people watch three-dimensional (3D) images
  • Method for evaluating R value and power spectrums of electroencephalogram signals causing discomfort when people watch three-dimensional (3D) images

Examples


Embodiment Construction

[0040] The method for evaluating the EEG signal power spectrum and R value of the discomfort caused by watching 3D images of the present invention will be described in detail below with reference to the embodiments and the accompanying drawings.

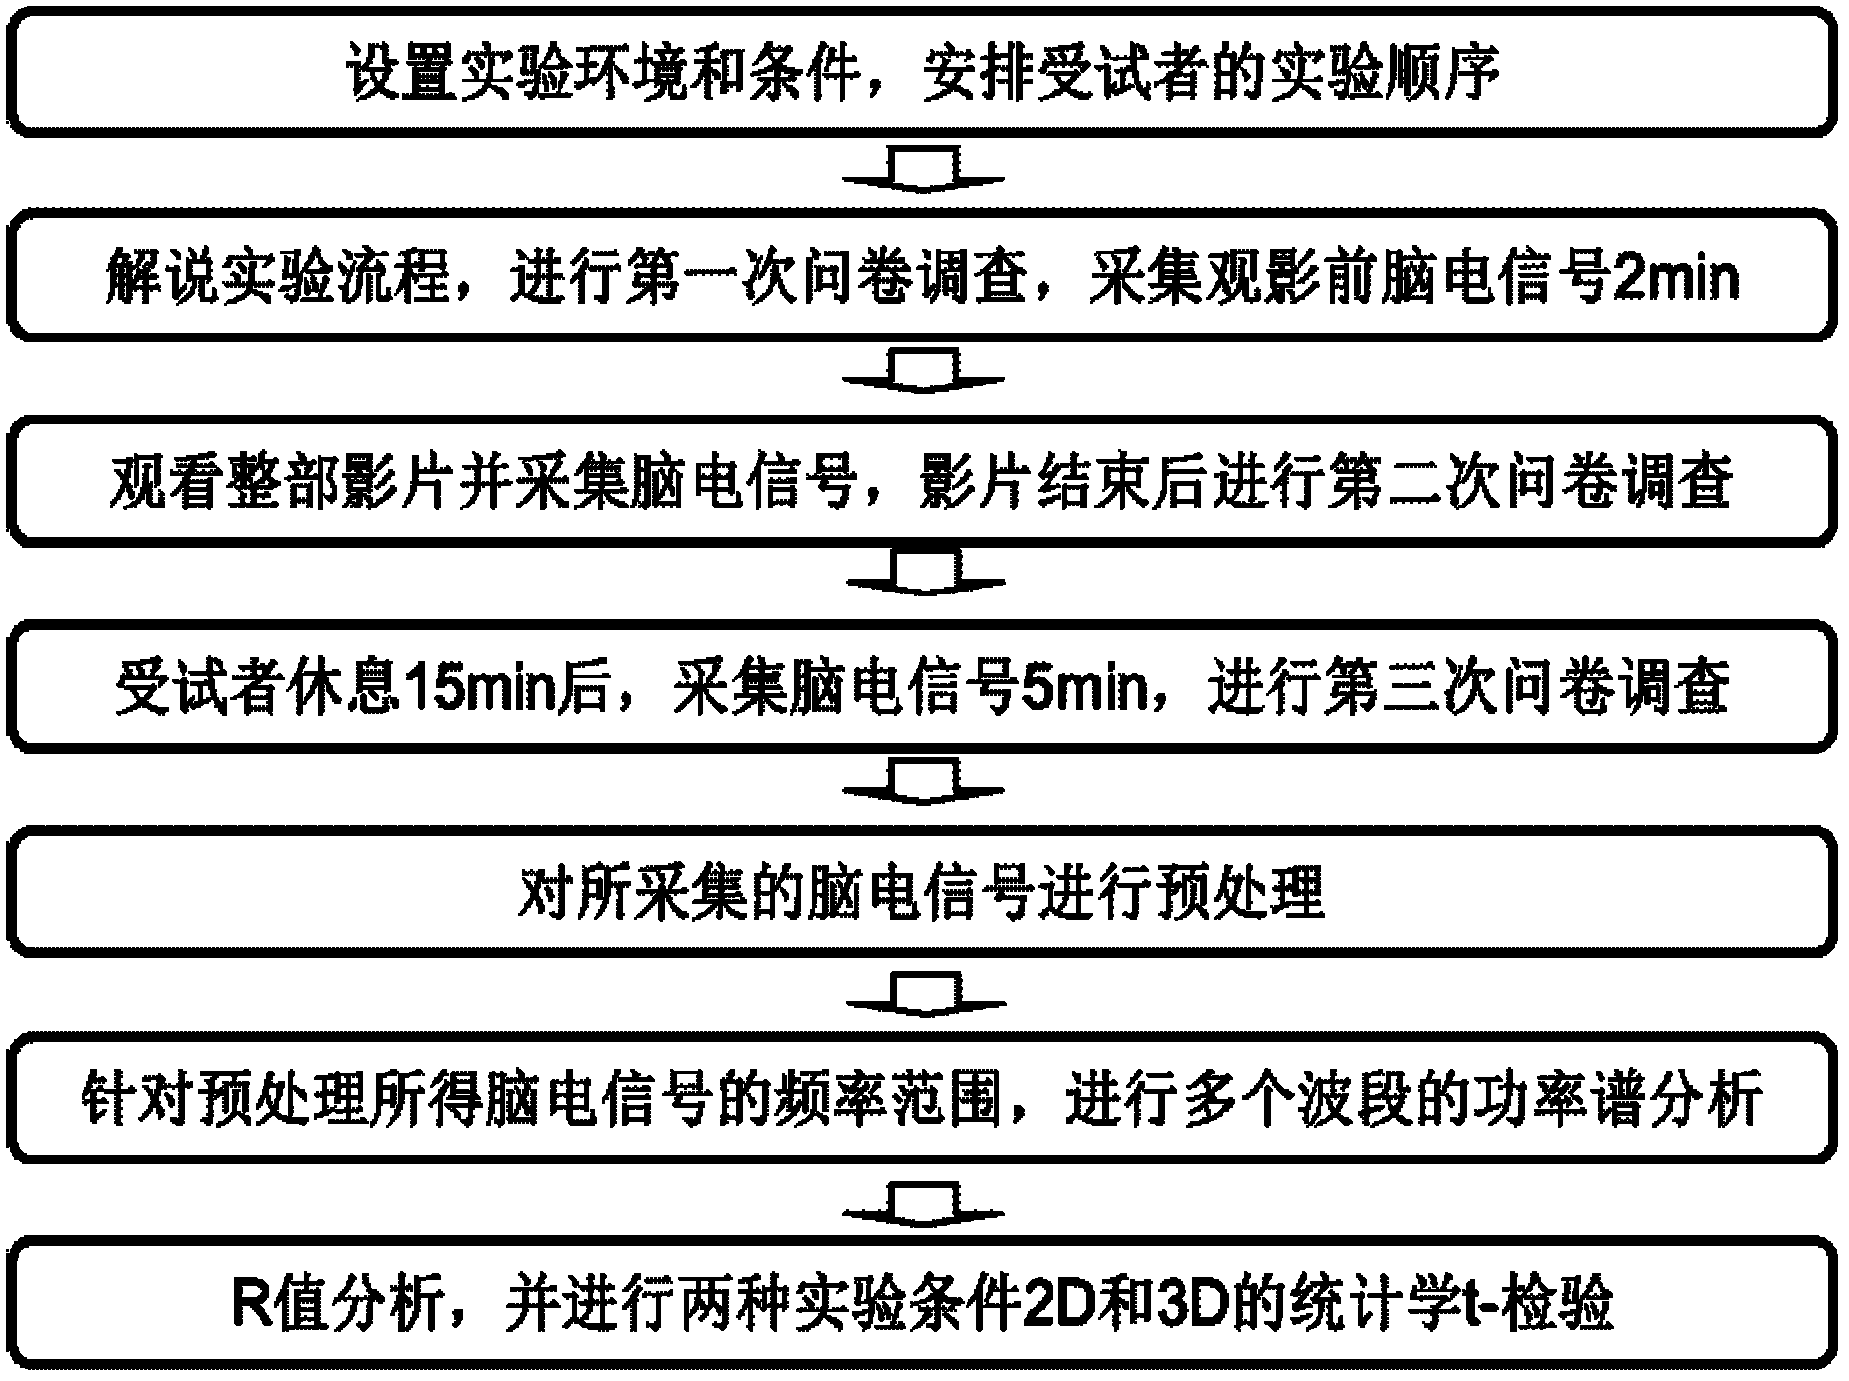
[0041] The EEG signal power spectrum and R value evaluation method of discomfort caused by viewing 3D images of the present invention, such as figure 2 shown, including the following steps:

[0042] (1) Set up the experimental environment and conditions, and arrange the experimental order of the subjects;

[0043] Including: setting the background illumination in the room to 2.5~3.5Lux, selecting the subject must be the first time to watch the image to be shown, the 3D TV is located 2.5~3.5m in front of the subject, and when watching the 3D video, wear a field Active shutter 3D glasses with a frequency of 120 fields / second, and the whole experiment time is 85-100 minutes.

[0044] It also includes: divide the subjects into two gro...


PUM


Abstract

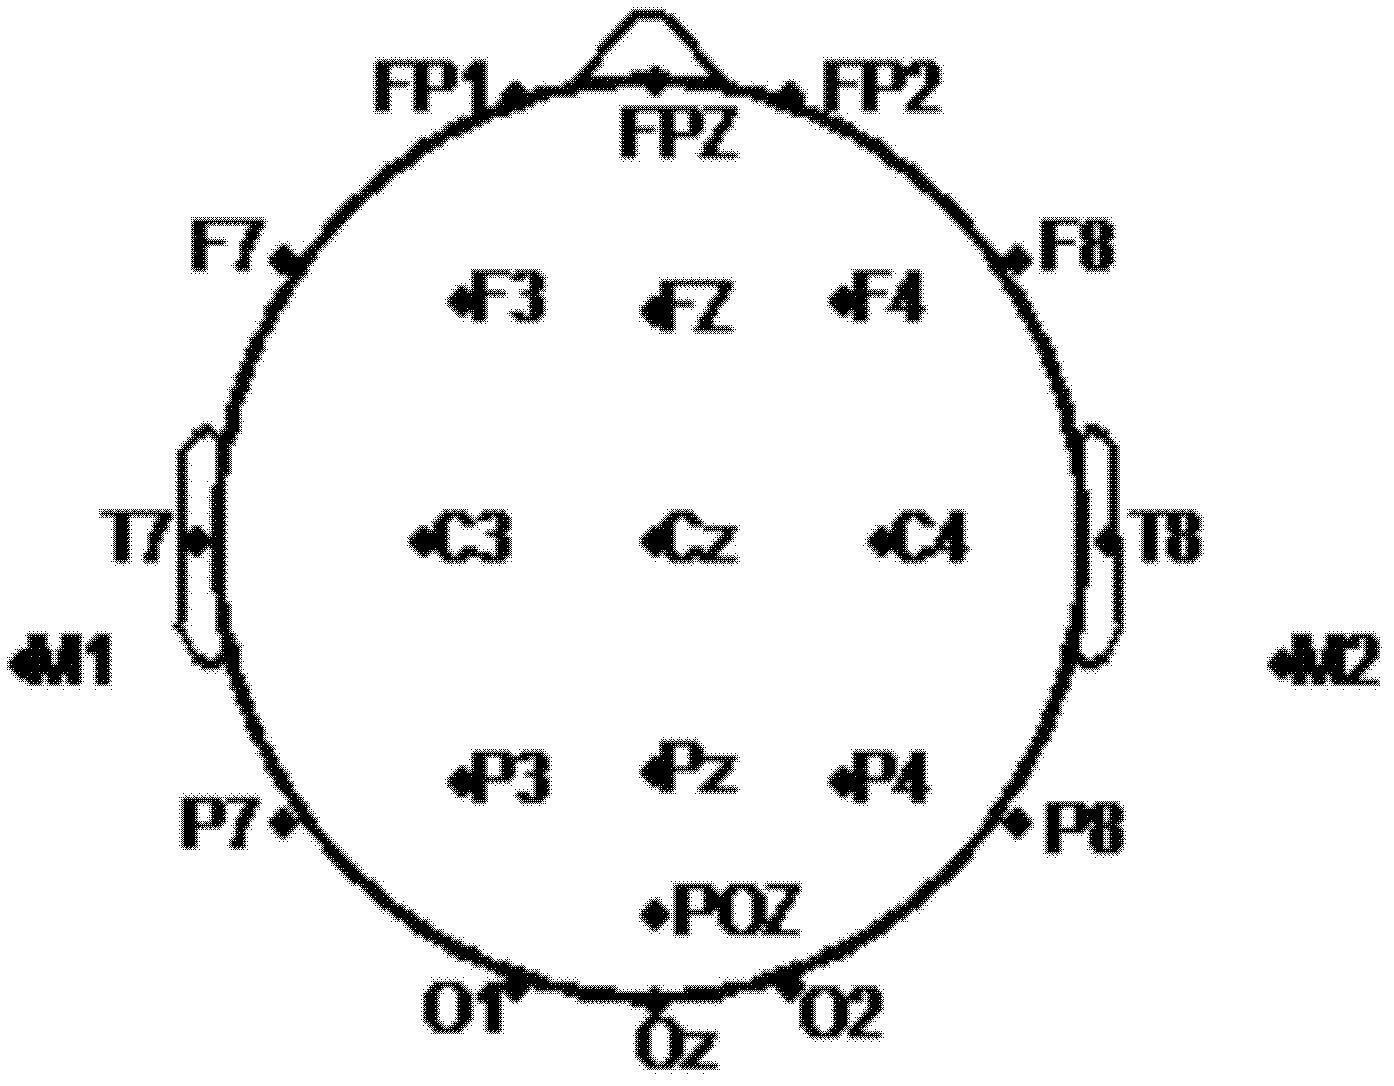
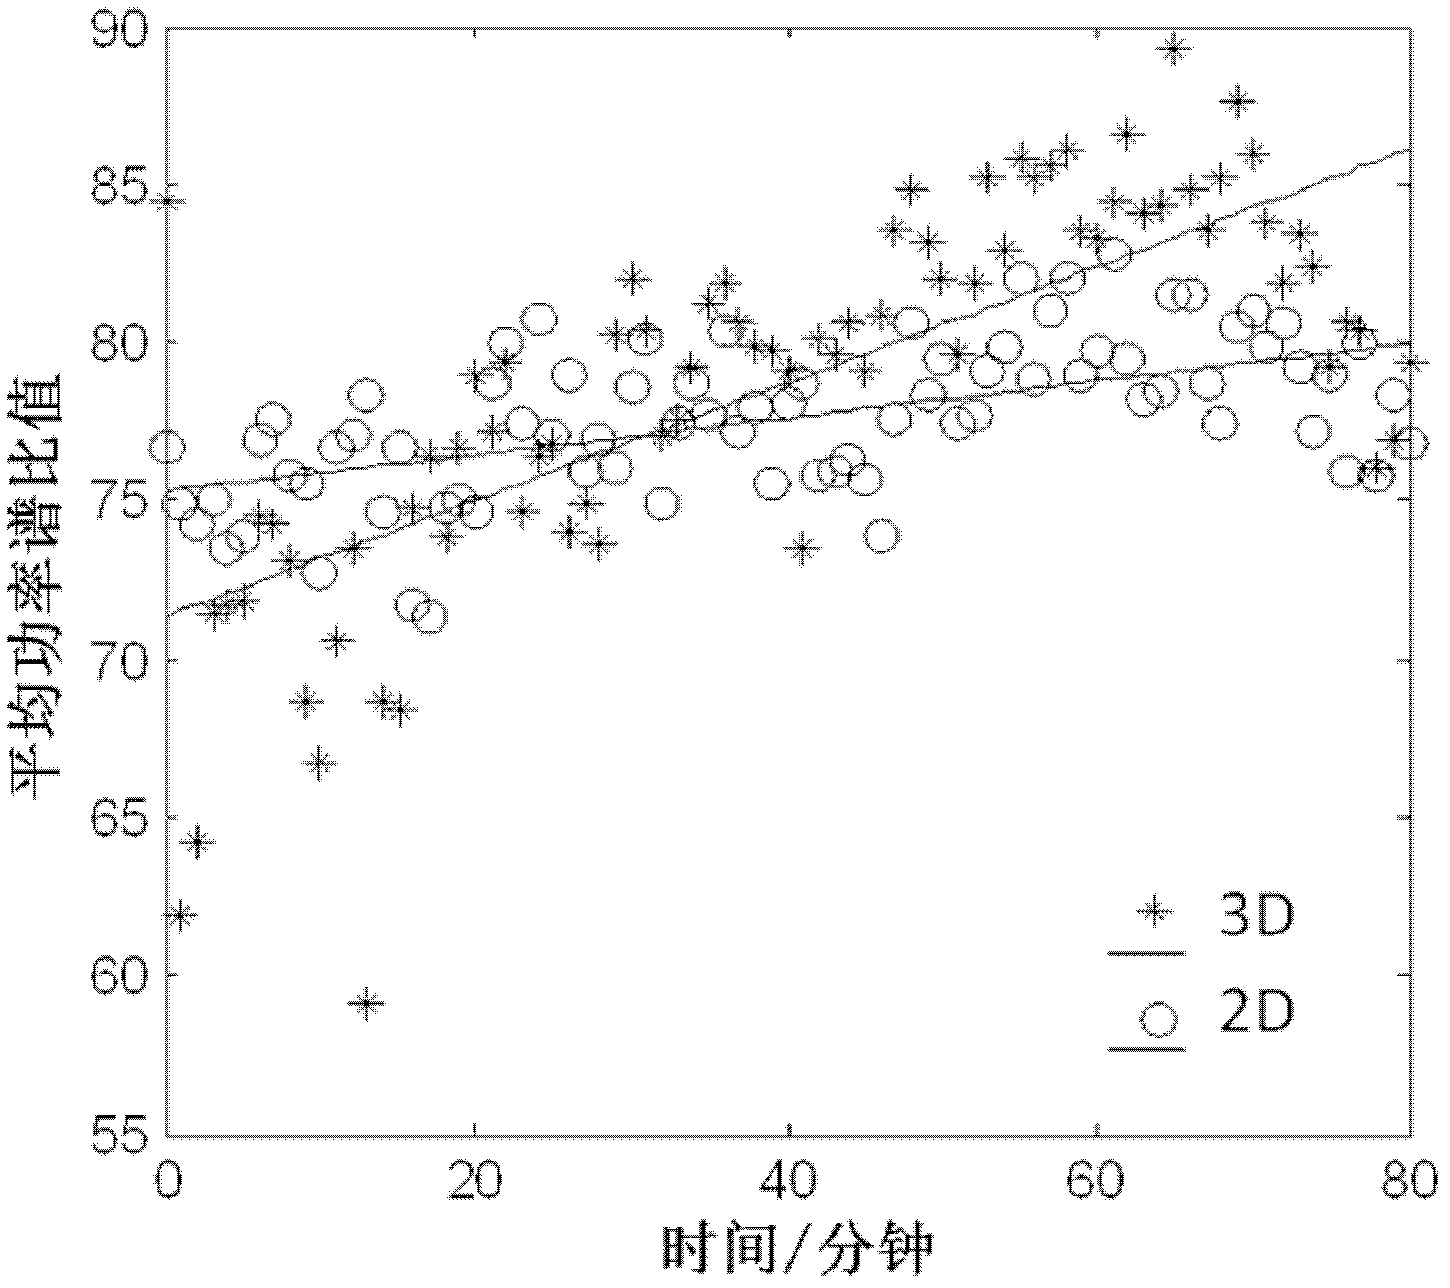
Provided is a method for evaluating an R value and power spectrums of electroencephalogram signals causing discomfort when people watch three-dimensional (3D) images. The method comprises arranging an experimental environment and experimental conditions, arranging experimental sequence of a subject, explaining the experiment process, arranging an electroencephalogram electrical electrode, collecting electroencephalogram signals of the subject before watching images for 2 minutes, and performing a first questionnaire survey; collecting electroencephalogram signals when the subject watches the whole movie and performing a second questionnaire survey after the movie is over; collecting electroencephalogram signals for 5 minutes when the subject rests for 10-20 minutes after watching the movie and performing a third questionnaire survey; preprocessing the collected electroencephalogram signals; analyzing the power spectrums in a plurality of wave bands according to the frequency range obtained by preprocessing the electroencephalogram signals; and analyzing the R value and performing statistics t-inspection under 2D experimental conditions and 3D experimental conditions. The method can perform comparison of 2D images and the 3D images, analyzes centralized brain regions of the electroencephalogram signals from the energy angle, provides an experimental basis for follow-up researches, and then provides thoughts for technical standards for evaluating the 3D images.

Description

technical field [0001] The invention relates to a collection and feature extraction method of electroencephalogram signals. In particular, it relates to an evaluation method of EEG signal power spectrum and R value for discomfort caused by watching 3D images Background technique [0002] 3D TV is the abbreviation of three-dimensional stereoscopic video TV. Three-dimensional stereoscopic video TV uses the slightly different angles of human eyes to observe objects, so it can distinguish the distance of objects and produce three-dimensional vision. This principle separates the images seen by the left and right eyes, so that users can experience naked eyes without using stereoscopic glasses. Stereoscopic feeling. The emergence of 3D TV is not only the improvement of image quality, but also the transformation of the image in the image. Although stereoscopic display technology has the advantages of strong stereoscopic and immersive feeling, if you watch stereoscopic images for ...

Claims


Application Information

Patent Timeline
Patent Type & Authority Applications(China)
IPC IPC(8): A61B5/0476
Inventor 殷涛刘志朋尹杰靳静娜
Owner INST OF BIOMEDICAL ENG CHINESE ACAD OF MEDICAL SCI
Learn More