Method for visually showing power grid dispatching businesses

A power grid dispatching and power grid technology, applied in image data processing, 3D modeling, instruments, etc., can solve problems such as inability to integrate relevant information for presentation, single presentation, long modeling period, etc., to achieve clear presentation effect and presentation. The effect of wide latitude

Inactive Publication Date: 2014-05-21
STATE GRID CORP OF CHINA +2
View PDF7 Cites 30 Cited by
  • Summary
  • Abstract
  • Description
  • Claims
  • Application Information

AI Technical Summary

Problems solved by technology

As well as the electronic sand table combined with the physical sand table and multimedia sound and light in the later period, it generally has defects such as single performance, long modeling cycle, inconvenient portability, single function, and simple geographical presentation.
[0004] The current power flow diagram of the existing power grid is flat, and the power flow diagram shows the main parameters of the operation of the

Method used


Image

  • Method for visually showing power grid dispatching businesses
  • Method for visually showing power grid dispatching businesses
  • Method for visually showing power grid dispatching businesses

Examples


Embodiment Construction

[0039] In order to make the technical problems, technical solutions and beneficial effects solved by the present invention clearer, the present invention will be further described in detail below in conjunction with the accompanying drawings and embodiments. It should be understood that the specific embodiments described here are only used to explain the present invention, not to limit the present invention.

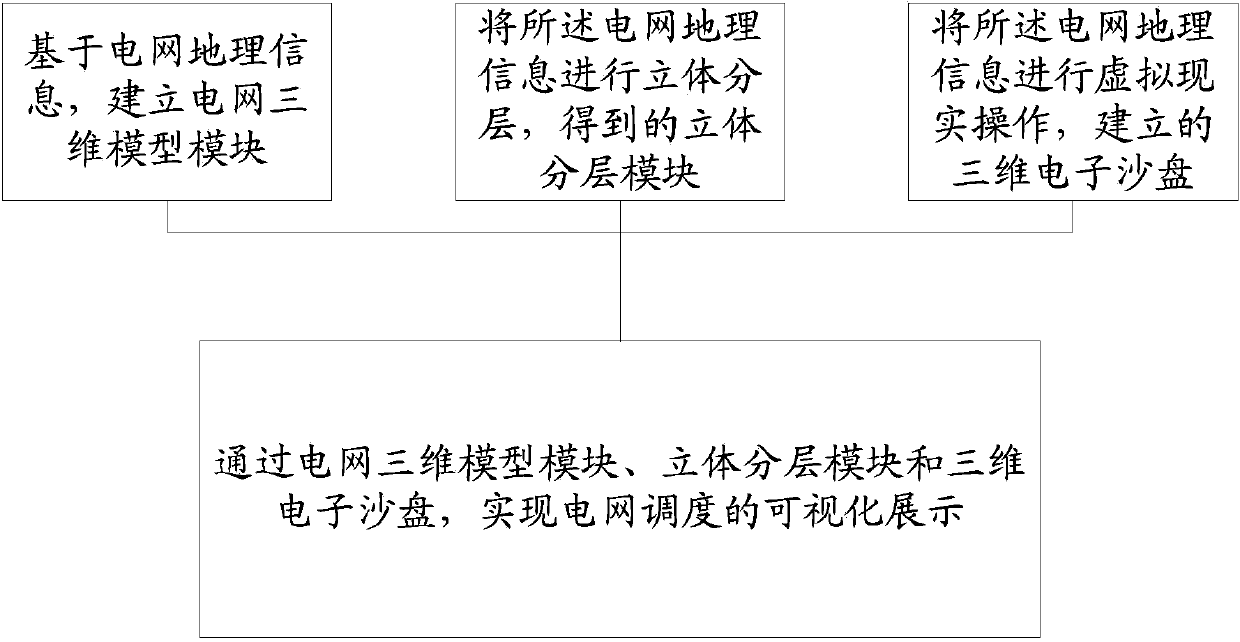
[0040] Such as figure 1 A method for visually displaying power grid dispatching business is shown, including:

[0041] Based on the geographical information of the power grid, the 3D model module of the power grid is established;

[0042] Performing three-dimensional layering on the grid geographic information to obtain a three-dimensional layering module;

[0043] The three-dimensional electronic sand table established by performing virtual reality operation on the geographical information of the power grid;

[0044] Through the three-dimensional model module of the ...


PUM


Abstract

Disclosed is a method for visually showing power grid dispatching businesses. The method includes that a power grid three-dimensional model module is established on the basis of power grid geographic information; the power grid geographic information is subjected to three-dimensional layering to obtain a three-dimensional layered module; the power grid geographic information is subjected to virtual reality operation to establish a three-dimensional electronic sand table; the power grid dispatching can be visually shown through the power grid three-dimensional model module, the three-dimensional layered module and the three-dimensional electronic sand table. A real sand table is changed to the virtual three-dimensional sand table, and thereby, internal omni-directional show can be achieved; compared with plane tidal current diagrams in the prior art, a three-dimensional layered tidal current diagram is wider in shown latitude; a traditional plane wiring diagram is made into a three-dimensional wiring diagram, the showing effect is clear, and situations in the field can be truly reflected.

Description

technical field [0001] The invention relates to the technical field of power grid scheduling information visualization, in particular to a method for visually displaying power grid scheduling services. Background technique [0002] In the existing technology, the traditional power grid wiring map can only be flattened, showing ground object information, and cannot intuitively show the real reality. For example, the display of elevation information relies on static and complex contour lines. This information is very unfavorable for quick decision-making. And the display ability is limited and the dimension is single. [0003] Existing sand tables include modules made of traditional physical sand tables based on topographic maps, aerial photos or on-site terrain, according to a certain proportion, with sand, wargames and other materials. As well as the later physical sand table combined with multimedia sound and light, the electronic sand table generally has defects such as s...

Claims


Application Information

Patent Timeline
IPC IPC(8): G06T17/00
Inventor 金晓明施毅斌姜枫马千曲祖义崔岱李大路陈晓东李铁丁涌陈建辉刘爱军刘建国
Owner STATE GRID CORP OF CHINA
Why Eureka
Try Eureka