
Method for presenting multi-dimensional data of regulation and control integrated systems of power grids

A technology for multi-dimensional data and power grid regulation, applied in multi-dimensional databases, electrical digital data processing, structured data retrieval, etc., can solve problems such as poor data intuition and difficulty in obtaining deep information

Inactive Publication Date: 2015-01-28
国家电网有限公司华北分部 +1
View PDF2 Cites 21 Cited by
  • Summary
  • Abstract
  • Description
  • Claims
  • Application Information

AI Technical Summary

Problems solved by technology

[0003] In order to solve the deficiencies in the prior art, the present invention provides a multi-dimensional data display method for the integrated system of power grid regulation and control, which applies multi-dimensional data linkage, multi-dimensional analysis and multi-dimensional drilling and display technologies to reports and Web, provides flexible query conditions, and Ability to slice and drill data, enabling reports and the Web to have data analysis functions, thereby solving the problems of poor data visibility and difficulty in obtaining in-depth information

Method used


Image

  • Method for presenting multi-dimensional data of regulation and control integrated systems of power grids
  • Method for presenting multi-dimensional data of regulation and control integrated systems of power grids
  • Method for presenting multi-dimensional data of regulation and control integrated systems of power grids

Examples


Embodiment Construction

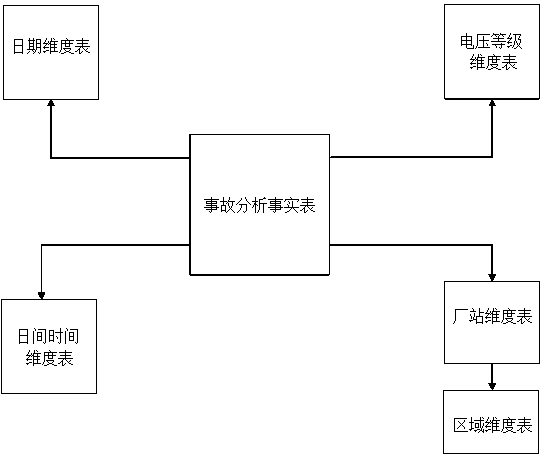
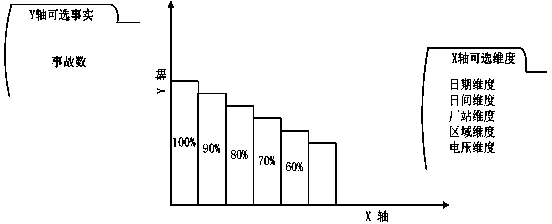
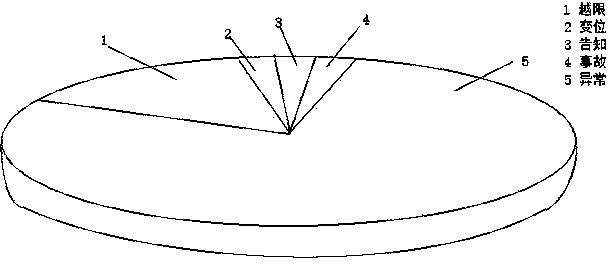
[0029] The present invention will be further described below by taking accident analysis as an example and in conjunction with the accompanying drawings.

[0030] The method for displaying multi-dimensional data of the integrated system of power grid regulation and control is characterized in that it includes the following steps:

[0031] Step 1), establish the multidimensional data model of the grid regulation integration system, in this step 1), establish the multidimensional data model of the grid regulation integration system, the detailed steps are as follows:

[0032] Step 11) Design the theme of the grid regulation integration system;

[0033] Combined with the characteristics of power grid dispatching and monitoring, the data in the existing relationship model of the power grid regulation integration system is analyzed, mainly based on the key index data of power grid regulation and combined with the data related to the index data in the power grid regulation integrati...


PUM


Abstract

The invention discloses a method for presenting multi-dimensional data of regulation and control integrated systems of power grids. The method has the advantages that multi-dimensional data models of the regulation and control integrated systems of the power grids are built to provide foundations for presenting the multi-dimensional data at first, then representation themes of the multi-dimensional data are established, rich presentation modes of presentation means such as WEB and reports are combined with comprehensive presentation dimensions provided by the multi-dimensional data models, and accordingly the data can be comprehensively and abundantly presented in a multi-level manner; the method is combined with multi-dimensional data linkage, multi-dimensional analysis and multi-dimensional drill-through presentation technologies, so that the theme data can be comprehensively presented and analyzed from multiple levels, multiple angles and multiple aspects.

Description

technical field [0001] The invention belongs to the technical field of electric power dispatching automation, and in particular relates to a method for displaying multi-dimensional data of an integrated system of power grid regulation and control. Background technique [0002] With the rapid development of the power system, people have higher and higher requirements for the monitoring and analysis of power grid operation data. At present, people use the object-oriented relational model of the power grid regulation integration system for data display, but this display method is not intuitive to the data, and it is difficult to obtain in-depth information, which is not conducive to comprehensive analysis and display of the data. Contents of the invention [0003] In order to solve the deficiencies in the prior art, the present invention provides a multi-dimensional data display method for the integrated system of power grid regulation and control, which applies multi-dimensi...

Claims


Application Information

Patent Timeline
IPC IPC(8): G06F17/30
CPCG06F16/2462G06F16/283
Inventor 郭骏宋鑫尹寿垚王茂海牛四清孟勇亮翟毅罗亚洲杨启京司佳伟季堃张勇张哲杨健宁剑王晓忠
Owner 国家电网有限公司华北分部
Learn More