
Method and system for displaying statistical chart on mobile webpage

A technology for statistical charts and web pages, applied in the Internet field, can solve the problems of single display effect and lack of dynamic display functions, and achieve the effect of avoiding single display, enhancing dynamic display effect, and improving display effect.

Pending Publication Date: 2018-03-27
TVM BEIJING TECH
View PDF4 Cites 0 Cited by
  • Summary
  • Abstract
  • Description
  • Claims
  • Application Information

AI Technical Summary

Problems solved by technology

[0008] At present, the scheme of displaying statistical charts on web pages displays statistical charts wi

Method used


Image

  • Method and system for displaying statistical chart on mobile webpage
  • Method and system for displaying statistical chart on mobile webpage

Examples


Embodiment Construction

[0044] The preferred embodiments of the present invention will be described below in conjunction with the accompanying drawings. It should be understood that the preferred embodiments described here are only used to illustrate and explain the present invention, and are not intended to limit the present invention.

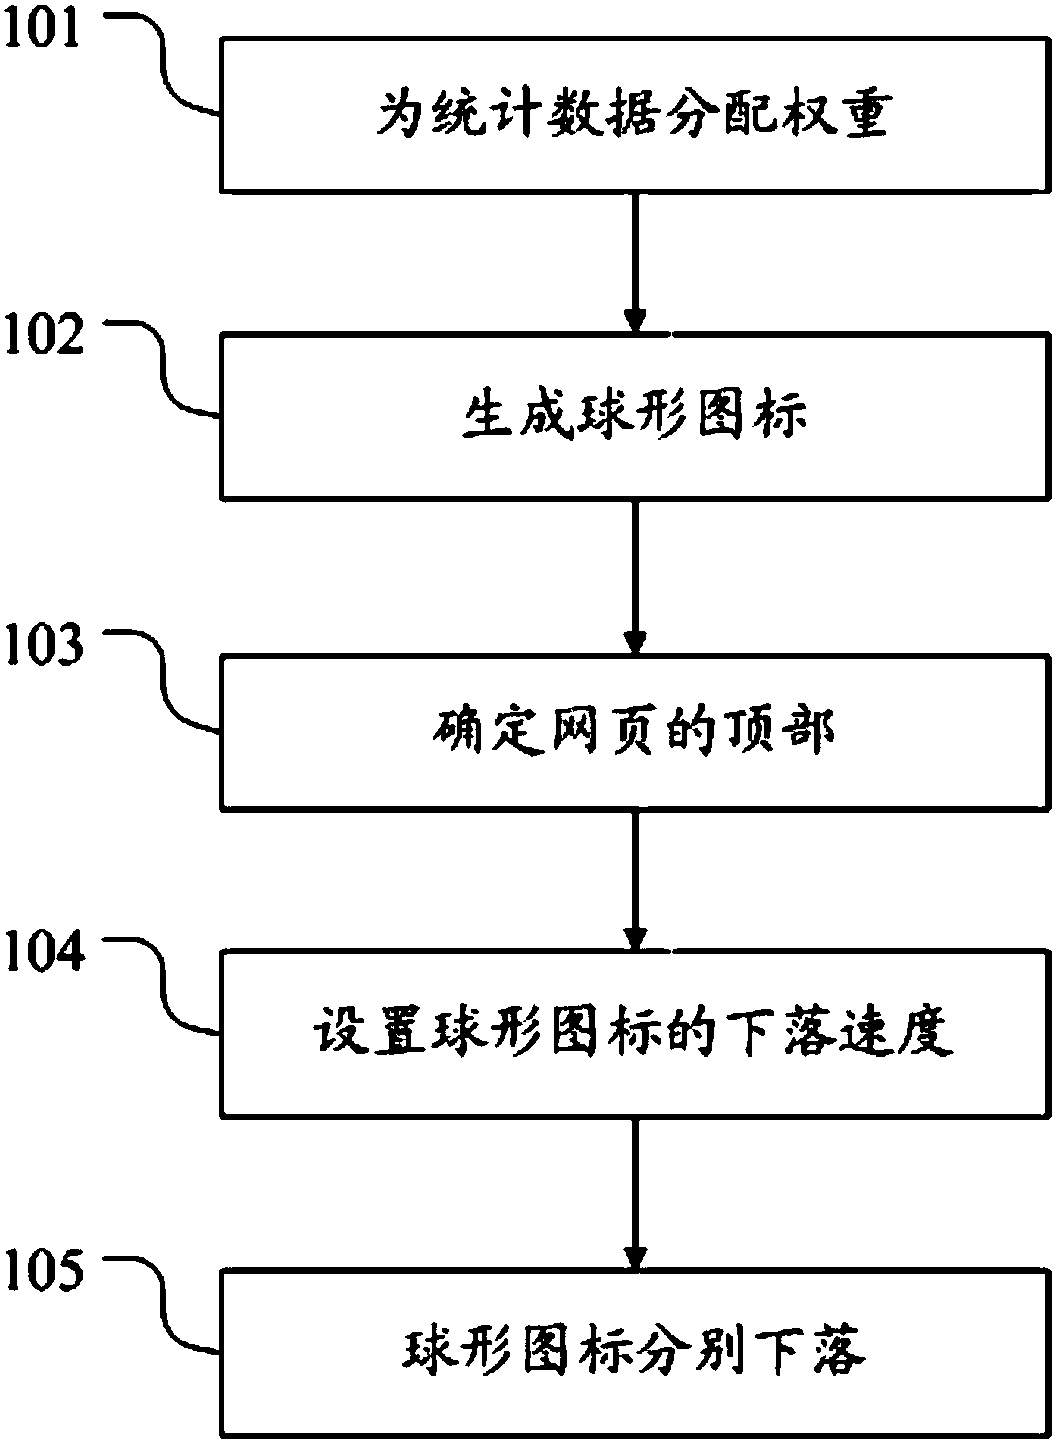
[0045] figure 1 It is a flow chart of a method for displaying statistical charts on a mobile webpage in Embodiment 1 of the present invention. like figure 1 As shown, the flow of the method for displaying statistical graphs on a mobile webpage includes the following steps:

[0046] Step 101: Assign weights to statistical data.

[0047] Read the maximum and minimum values ​​of statistical data to obtain the data interval;

[0048] Assign weights according to the position of statistical data in the data interval;

[0049] Statistics with large values ​​correspond to large weights.

[0050] Step 102: Generate a spherical icon to represent statistical data.

[005...


PUM


Abstract

The invention discloses a method and a system for displaying a statistical chart on a mobile webpage. The method comprises the steps of allocating weights to statistical data; generating spherical icons for representing the statistical data; determining the top of the webpage; randomly distributing the spherical icons at the top of the webpage; dropping the spherical icons; according to the weights of the statistical data, determining dropping speeds of the spherical icons; and dropping the spherical icons. According to the technical scheme, the dynamic display effect of the statistical chartis enhanced; the data chart is displayed diversely; dynamic attributes are added for the statistical chart; the characteristics of the statistical data are displayed in a highlighted manner; the intuitive visual effect of the statistical chart is enhanced; the vividness and visuality of the statistical chart are enhanced; the webpage display effect is improved; and the internet development is facilitated.

Description

technical field [0001] The invention relates to the technical field of the Internet, in particular to a method and system for displaying statistical charts on a mobile webpage. Background technique [0002] With the rapid development of the network, the Internet has become the carrier of a large amount of information. A large number of different types of data such as text, pictures, databases, audio, video and multimedia appear on the network. Coupled with various web page designs, human beings have entered the era of information explosion. . Internet information presents the characteristics of huge data, extensive content, diverse forms, and rapid growth. As of December 2015, the number of webpages in China was 212.3 billion, an annual increase of 11.8%; among them, the number of static webpages was 131.4 billion, accounting for 61.9% of the total number of webpages, and the number of dynamic webpages was 80.8 billion, accounting for 38.1% of the total number of webpages ...

Claims


Application Information

Patent Timeline
IPC IPC(8): G06F17/30
CPCG06F16/957
Inventor 陈杰
Owner TVM BEIJING TECH
Learn More