A Visual Analysis Method of Malicious Code Based on Space Filling Curve

A space-filling curve and malicious code technology, which is applied in the field of malicious code visualization analysis based on space-filling curves, can solve the problem of analysis program termination, inability to see grayscale images, and inability to intuitively reflect whether samples are encrypted or packed. and other problems to achieve the effect of reducing business level requirements and improving analysis efficiency

Active Publication Date: 2022-05-06
DONGHUA UNIV
View PDF3 Cites 0 Cited by
  • Summary
  • Abstract
  • Description
  • Claims
  • Application Information

AI Technical Summary

Problems solved by technology

[0004] Although the method of NatarajL, KarthikeyanS, JacobG, etal. Malware images: visualization and automatic classification [C]. International Symposium on Visualization for Cyber ​​Security. ACM, 2011: 1-7. can visually reflect that the malicious codes of the same family have similar patterns and textures, and have also obtained classification Better results, but this method has the following problems in the analysis of malicious samples: 1. The grayscale image generated by this method is proportional to the size of the original file of malicious samples. If the original file has a large amount of data, the large grayscale image file It will be misjudged by the system as a Decompression BombDosAttack (Decompression BombDosAttack), resulting in the termination of the analysis program; 2. The printable characters in the malicious code can prompt the function of the sample, but it cannot be seen from the representation of the grayscale image; and the malicious Code obfuscation technology is often used to hide its malicious activities, and the grayscale image cannot intuitively reflect whether the sample is encrypted or packed

Method used


Image

  • A Visual Analysis Method of Malicious Code Based on Space Filling Curve
  • A Visual Analysis Method of Malicious Code Based on Space Filling Curve
  • A Visual Analysis Method of Malicious Code Based on Space Filling Curve

Examples


Embodiment 1

[0026] A method for visual analysis of malicious code based on space-filling curves, specifically:

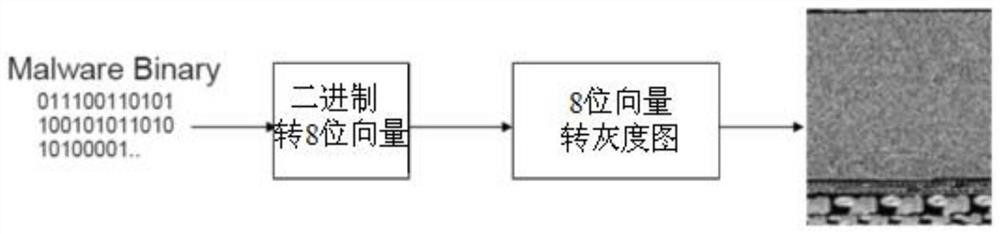
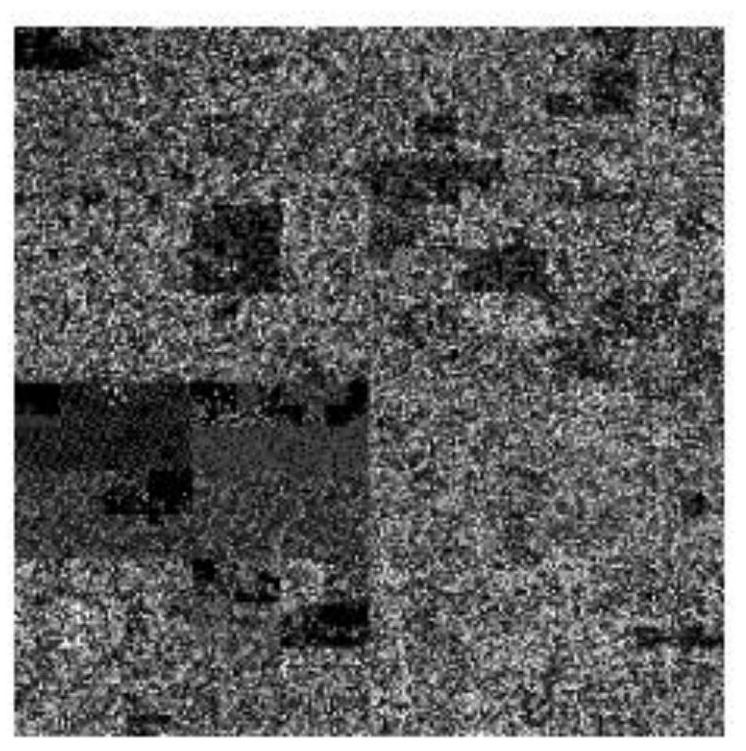
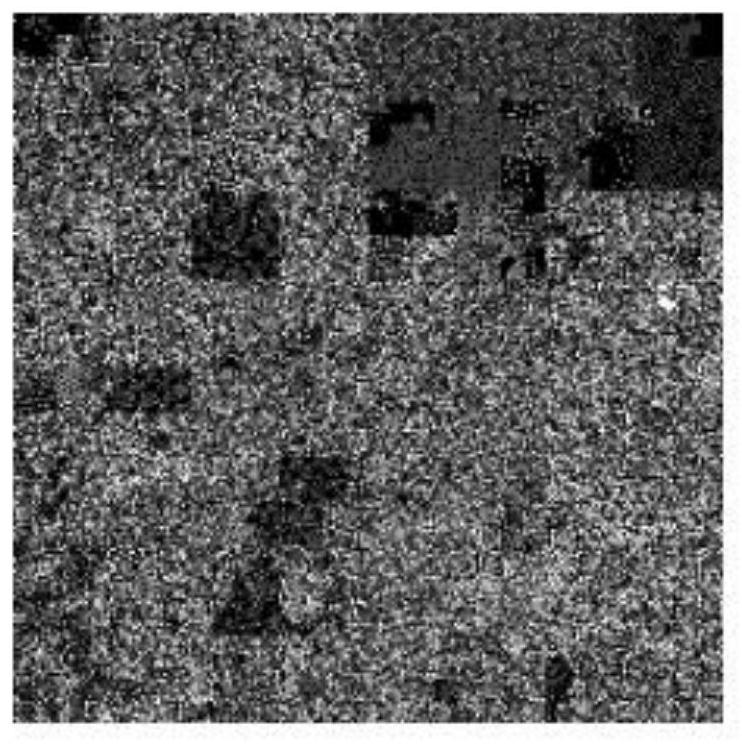
[0027] Step 1: Take Rootkit.Win32.Podnuha class sample.alo as an example, its file size is 205824 bytes, and the sequence is represented as 77-90-80-0-0-2-0-0-0-4- in decimal 0-15-0-255-255-0-0..., according to the step size Step=205824 / 65536=3.140625 sampling, then the new sequence is 77-0-0-4-0-0...; then give the byte Mark RGB value: Byte 77 is a printable character, using only the green channel, so the RGB value is marked as (0, 77, 0), byte 0 is a non-printable character, using both red and blue channels, so its RGB The value is marked as (0, 0, 0), and similarly byte 4 is a non-printable character, and its RGB value is marked as (4, 0, 4)...; finally, the pixel sequence of the marked RGB value is divided into 8-order Hilbert The order of the curve traversing the 256*256 two-dimensional plane fills the area and generates a Hilbert diagram, such as Figure 2A As shown, th...

Embodiment 2

[0032] The malicious code visual analysis method based on the space-filling curve described in Embodiment 1 is used to generate images of Backdoor.Win32.Rukap class samples .geu, .kl, and .lc, such as Figure 3A-Figure 3C , Figure 4A-Figure 4C ,as well as Figure 5A-Figure 5C As shown, the present invention can find subtle differences between images from multiple perspectives when analyzing malicious samples of the same family, which provides a basis for grasping the evolution of the variants of the family.


PUM


Abstract

The invention relates to a malicious code visualization analysis method based on a space-filling curve, comprising the following steps: generating a Hilbert graph and a Gray graph from the original file of the malicious code; generating a zigzag graph from the local entropy of the malicious code; The texture analysis method and the convolutional neural network extract the Gist features from the Hilbert image and the Gray image respectively, and implement classification based on the nearest neighbor principle, and use the VGG19 network to extract image features for the "Zigzag" image, and implement classification using the support vector machine . The invention can not only be used for detecting and classifying malicious codes, but also enables analysts to intuitively know whether a certain malicious sample has encryption or compression when analyzing malicious codes.

Description

technical field [0001] The invention relates to the technical field of malicious code visual analysis, in particular to a malicious code visual analysis method based on a space-filling curve. Background technique [0002] Extracting fingerprint features is a common method to identify malicious code. However, due to the rapid proliferation of malicious samples, if new fingerprint features are not updated in time, malicious code detection will be delayed. Traditional methods also include static and dynamic code analysis: static analysis is to check the control flow of the program through code disassembly to find malicious patterns; dynamic analysis is to run malicious code in a virtual environment and describe its properties through its behavior. However, the static method can only provide more comprehensive information when the malicious code does not use obfuscation techniques; the dynamic method can only observe the malicious behavior when the virtual environment meets the ...

Claims


Application Information

Patent Timeline
Patent Type & Authority Patents(China)
IPC IPC(8): G06F21/56
CPCG06F21/563
Inventor 任卓君陈光卢文科
Owner DONGHUA UNIV
Why Eureka
Try Eureka