Operation index abnormity monitoring method

An abnormality monitoring and index technology, applied in neural learning methods, biological neural network models, instruments, etc., can solve problems such as inability to detect business anomalies, business false alarms, etc., and achieve the effect of accurate capture and improved accuracy

Active Publication Date: 2019-04-12
FOCUS TECH
View PDF7 Cites 21 Cited by
  • Summary
  • Abstract
  • Description
  • Claims
  • Application Information

AI Technical Summary

Problems solved by technology

However, when the time series forecasting model is applied in practice, the deviation between the historical actual value and the predicted value of the operation index does not obey the normal distribution. If the fluctuation threshold is set according to the normal distribution, it will lead to false alarms under normal business conditions. , or business anomalies cannot be detected

Method used


Image

  • Operation index abnormity monitoring method
  • Operation index abnormity monitoring method
  • Operation index abnormity monitoring method

Examples


Embodiment Construction

[0029] Technical scheme of the present invention is as follows:

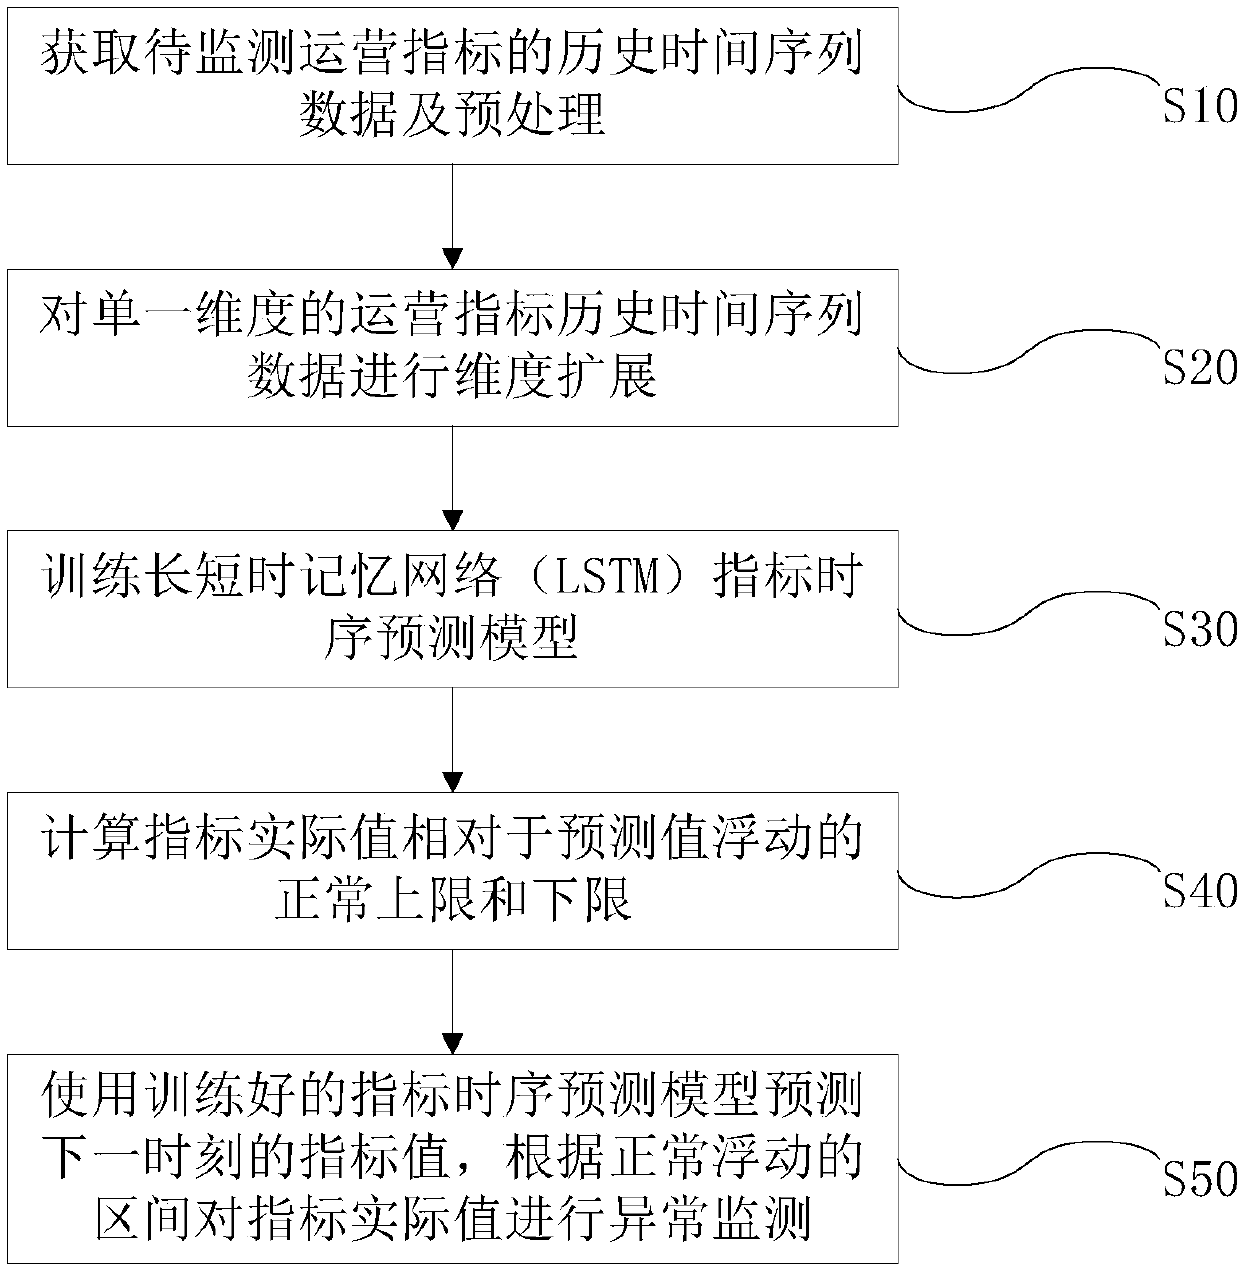
[0030] A method for abnormal monitoring of operational indicators, comprising the following steps:

[0031] Step 1), obtain the historical time series data of the operating indicators to be monitored, and preprocess the historical time series data;

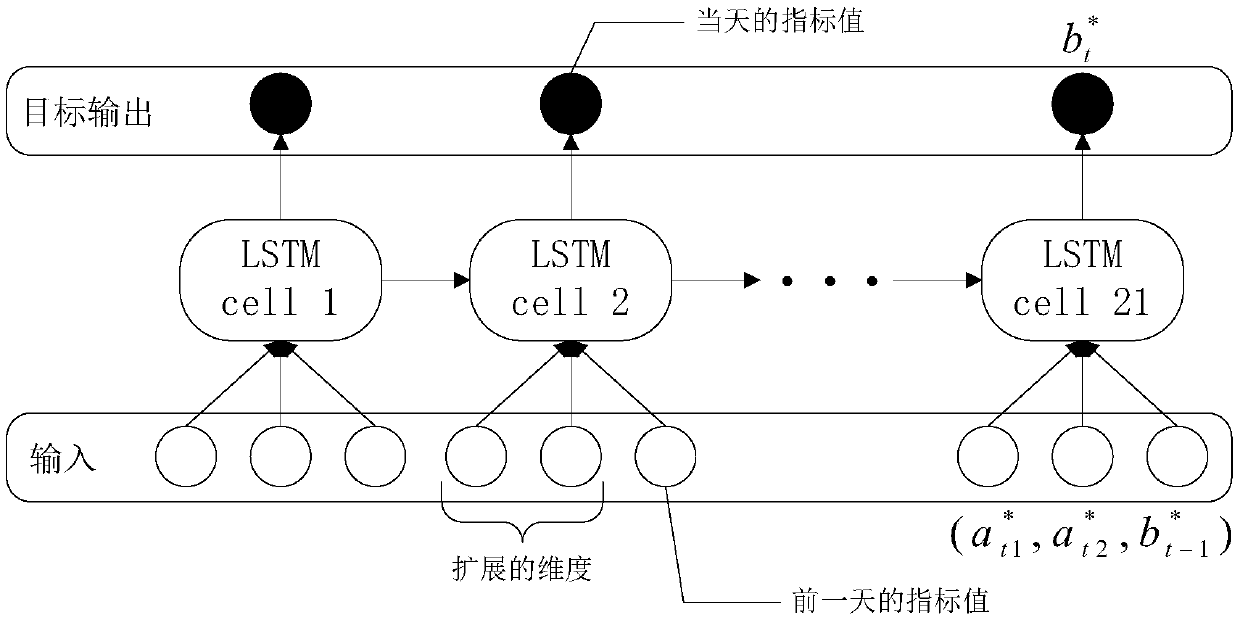
[0032] Step 2), perform dimension expansion on the historical time series data of single-dimensional operational indicators preprocessed in step 1), and increase the characteristic information contained in each time node itself;

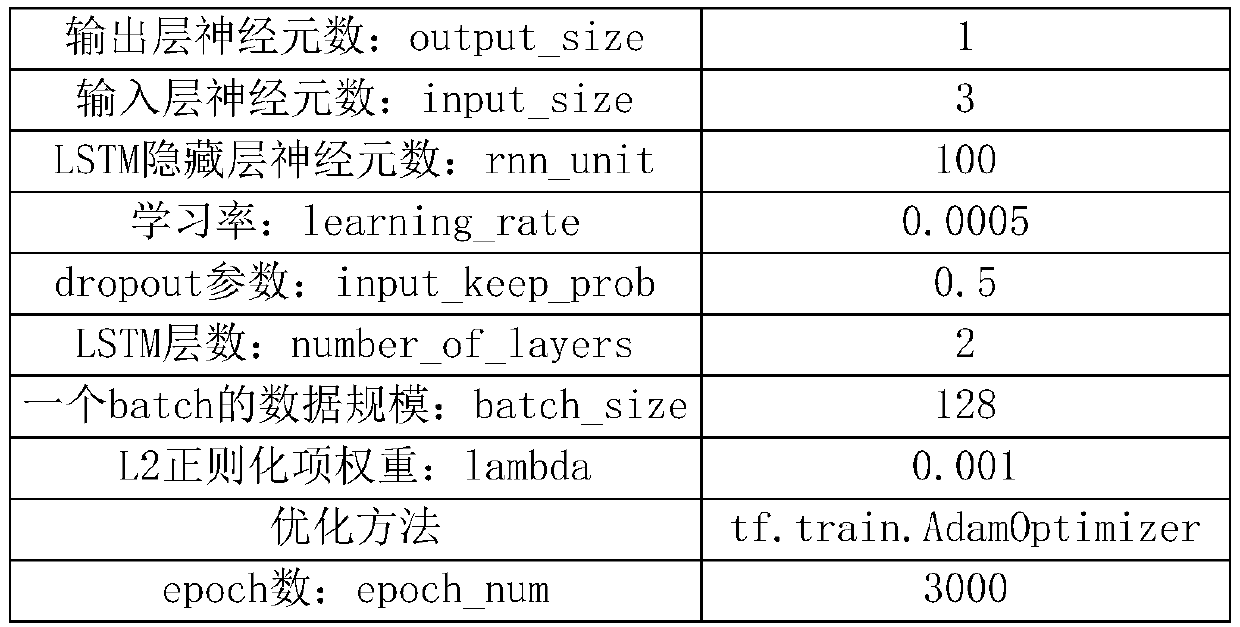
[0033] Step 3), after standardizing the historical time series data of the multi-dimensional operation indicators obtained in step 2), put them into the long-short-term memory network (LSTM) for training;

[0034] Step 4), use the long-short-term memory network model trained in step 3) to calculate the predicted value of the operation index at each historical time node, and use the box diagram to make statistics on the deviation between t...


PUM


Abstract

The invention discloses an operation index abnormity monitoring method, which is characterized by comprising the following steps of: 1) preprocessing historical time sequence data of an operation index; 2) performing dimension expansion on the historical time sequence data of the operation indexes, and adding feature information; step 3), putting the operation index historical time sequence data subjected to dimension extension into a long-short time memory network (LSTM) for training; 4) calculating the predicted value of the operation index on each historical time node by using the model, and counting the predicted deviation by using a box-type graph to obtain an upper limit value and a lower limit value of normal floating of the index; and 5) judging whether the operation index value atthe current moment is abnormal or not. According to the method, the change rule of the operation index can be efficiently and accurately captured, and whether the operation index value is abnormal ornot is judged according to the calculated fluctuation threshold value.

Description

technical field [0001] The invention relates to the fields of machine learning and data mining, in particular to a method for monitoring abnormality of operation indicators. Background technique [0002] With the popularization of big data technology and the improvement of social informatization, enterprises have accumulated more and more data in the process of development. These data contain various information in the history of enterprises, and each type of data can be used as a Indicators, such as: enterprise website hits per day, order volume, enterprise revenue, etc. These operating indicators of the enterprise reflect the business status of the enterprise, and in turn, once the business of the enterprise is abnormal, it will also be reflected in the operating indicators. Therefore, abnormal monitoring of the company's operating indicators can effectively quantify the historical and future business conditions, detect problems in a timely manner, and provide data suppor...

Claims


Application Information

Patent Timeline
Patent Type & Authority Applications(China)
IPC IPC(8): G06Q10/06G06N3/04G06N3/08
CPCG06N3/08G06Q10/06393G06N3/044G06N3/045
Inventor 邵文晔王婷
Owner FOCUS TECH
Why Eureka
Try Eureka