
Method and system for quantitatively evaluating urban green land cooling effects in different climatic areas

A quantitative evaluation and effect technology, applied in measurement devices, instruments, analytical materials, etc., can solve the problems of inability to directly obtain the temperature under forest, high cost, long monitoring period, etc.

Active Publication Date: 2020-02-04
GUANGZHOU INST OF GEOGRAPHY GUANGDONG ACAD OF SCI +1
View PDF2 Cites 1 Cited by
  • Summary
  • Abstract
  • Description
  • Claims
  • Application Information

AI Technical Summary

Problems solved by technology

Spot-based field observation is the most accurate research method at present. However, due to the limitation of time and space, there are problems such as long monitoring period, small coverage, high cost, high labor intensity, and slow data collection. Generally, it can only be used for one city or a certain Several sample plots were carried out, so the conclusions drawn are only representative of the local area
Satellite remote sensing technology can overcome the shortcomings of the above-mentioned on-the-spot observations, but satellite remote sensing images cannot directly obtain the temperature under the forest due to insufficient penetrating ability and being blocked by the upper tree canopy, which brings great obstacles to the research on the cooling effect of urban green space , but based on remote sensing technology to obtain vegetation index, landscape index, biomass, vegetation coverage, etc., it provides a new technical means for the study of green space cooling mechanism
At present, the technical methods for evaluating the cooling effect of urban green space in the existing technology are still limited by the space-time scale of field observations, and cannot well reflect the cooling situation of the actual urban green space.

Method used


Image

  • Method and system for quantitatively evaluating urban green land cooling effects in different climatic areas
  • Method and system for quantitatively evaluating urban green land cooling effects in different climatic areas
  • Method and system for quantitatively evaluating urban green land cooling effects in different climatic areas

Examples


Embodiment

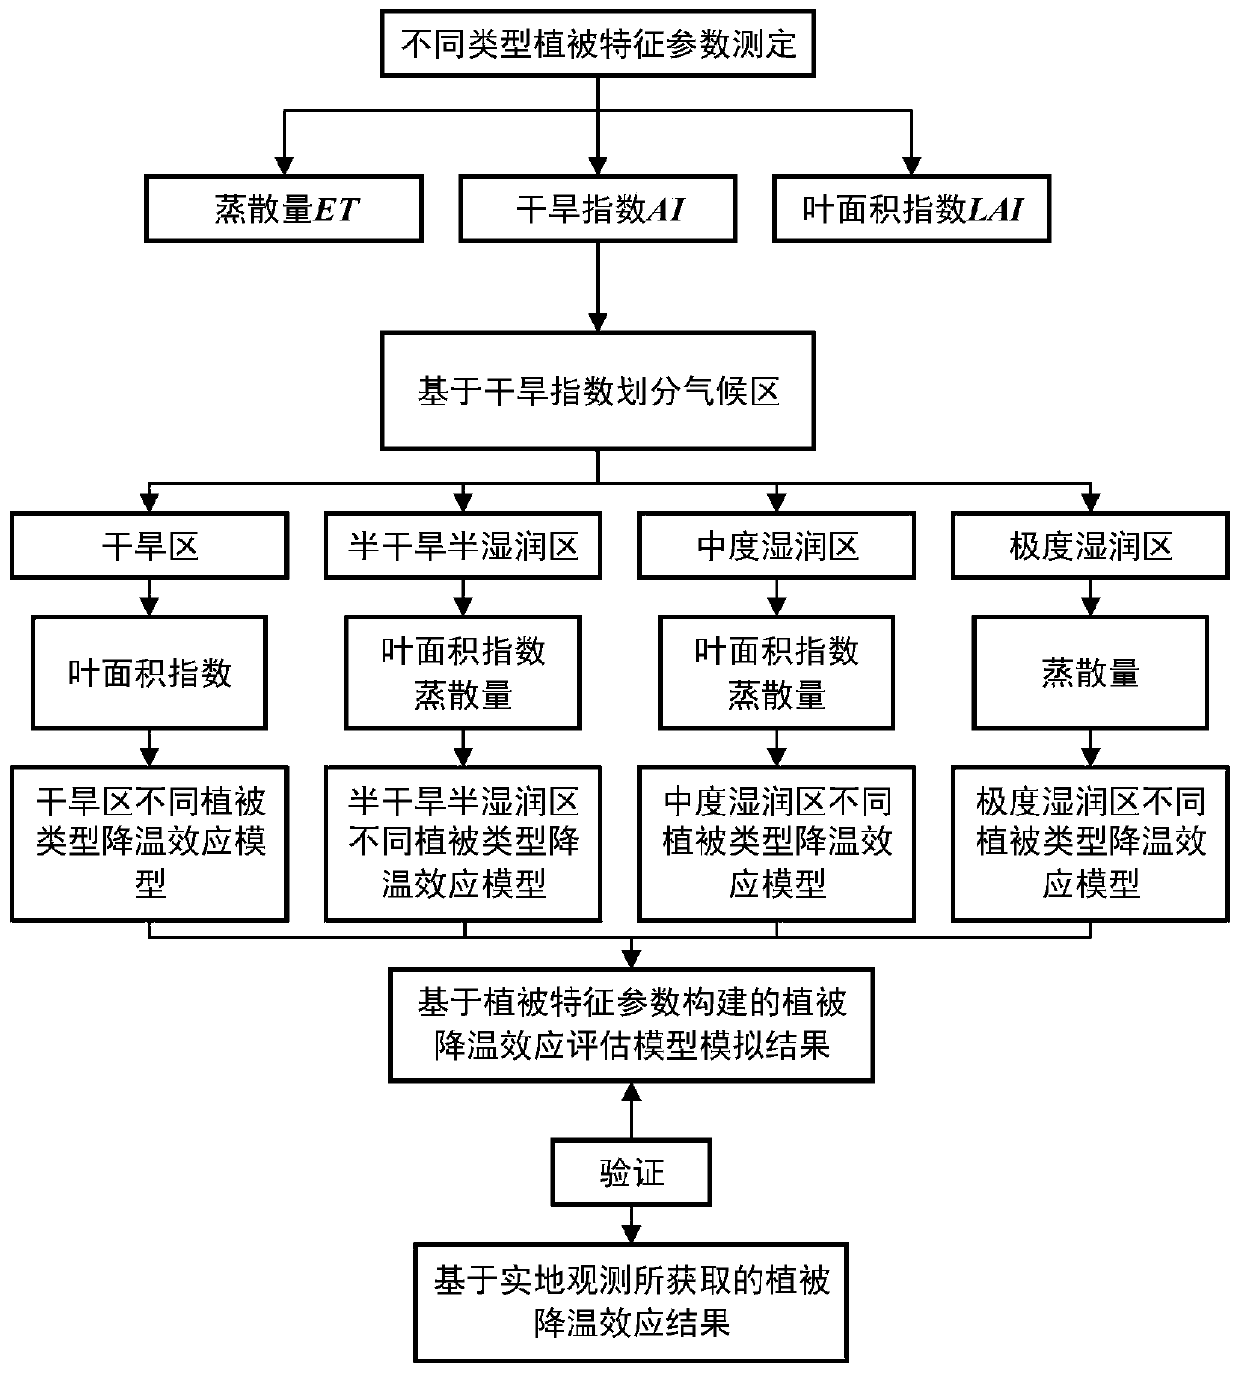
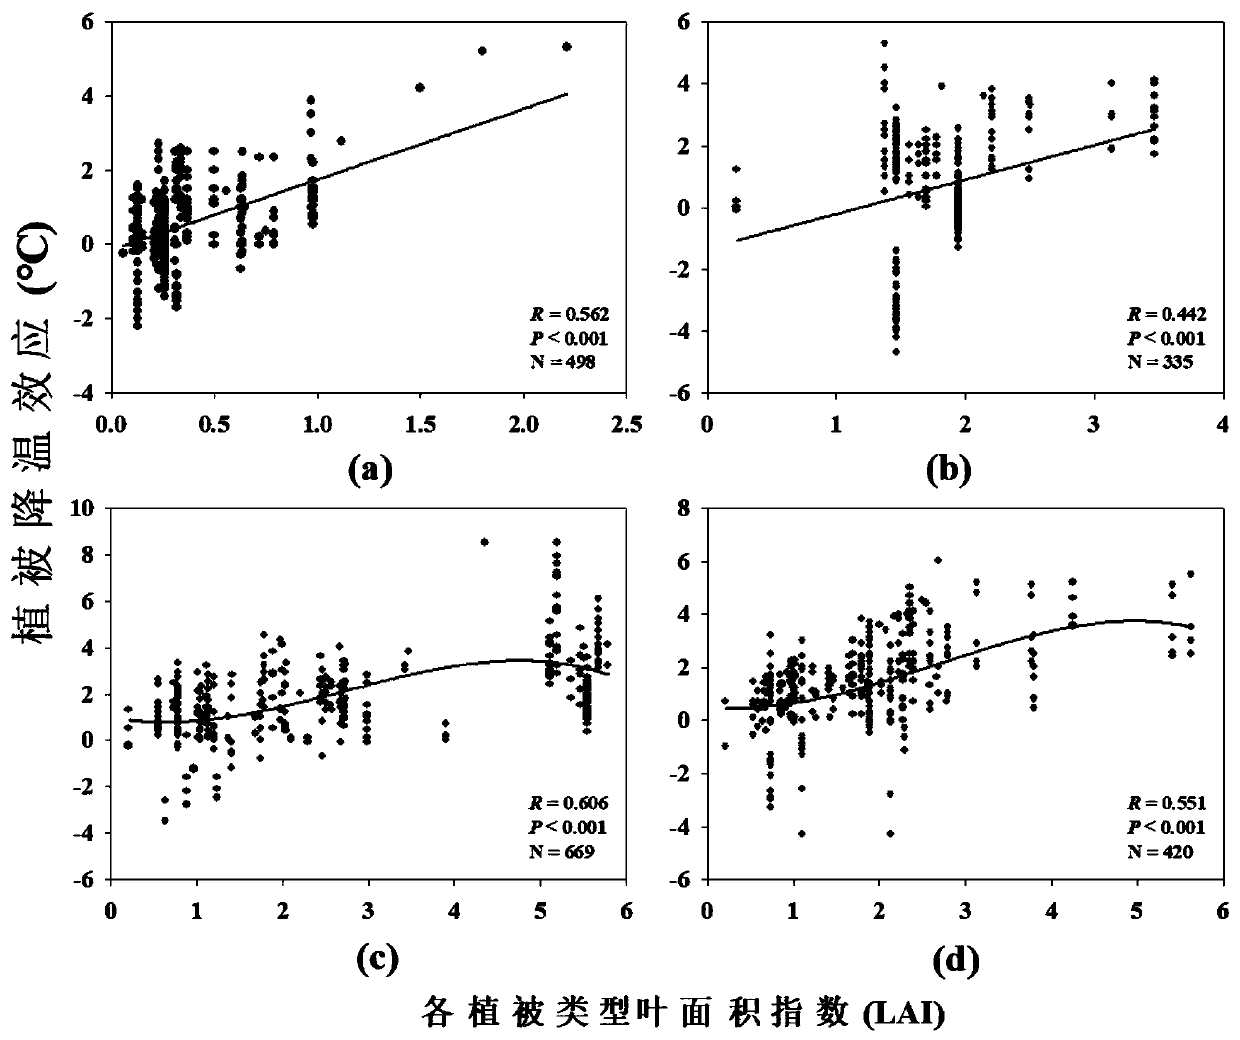
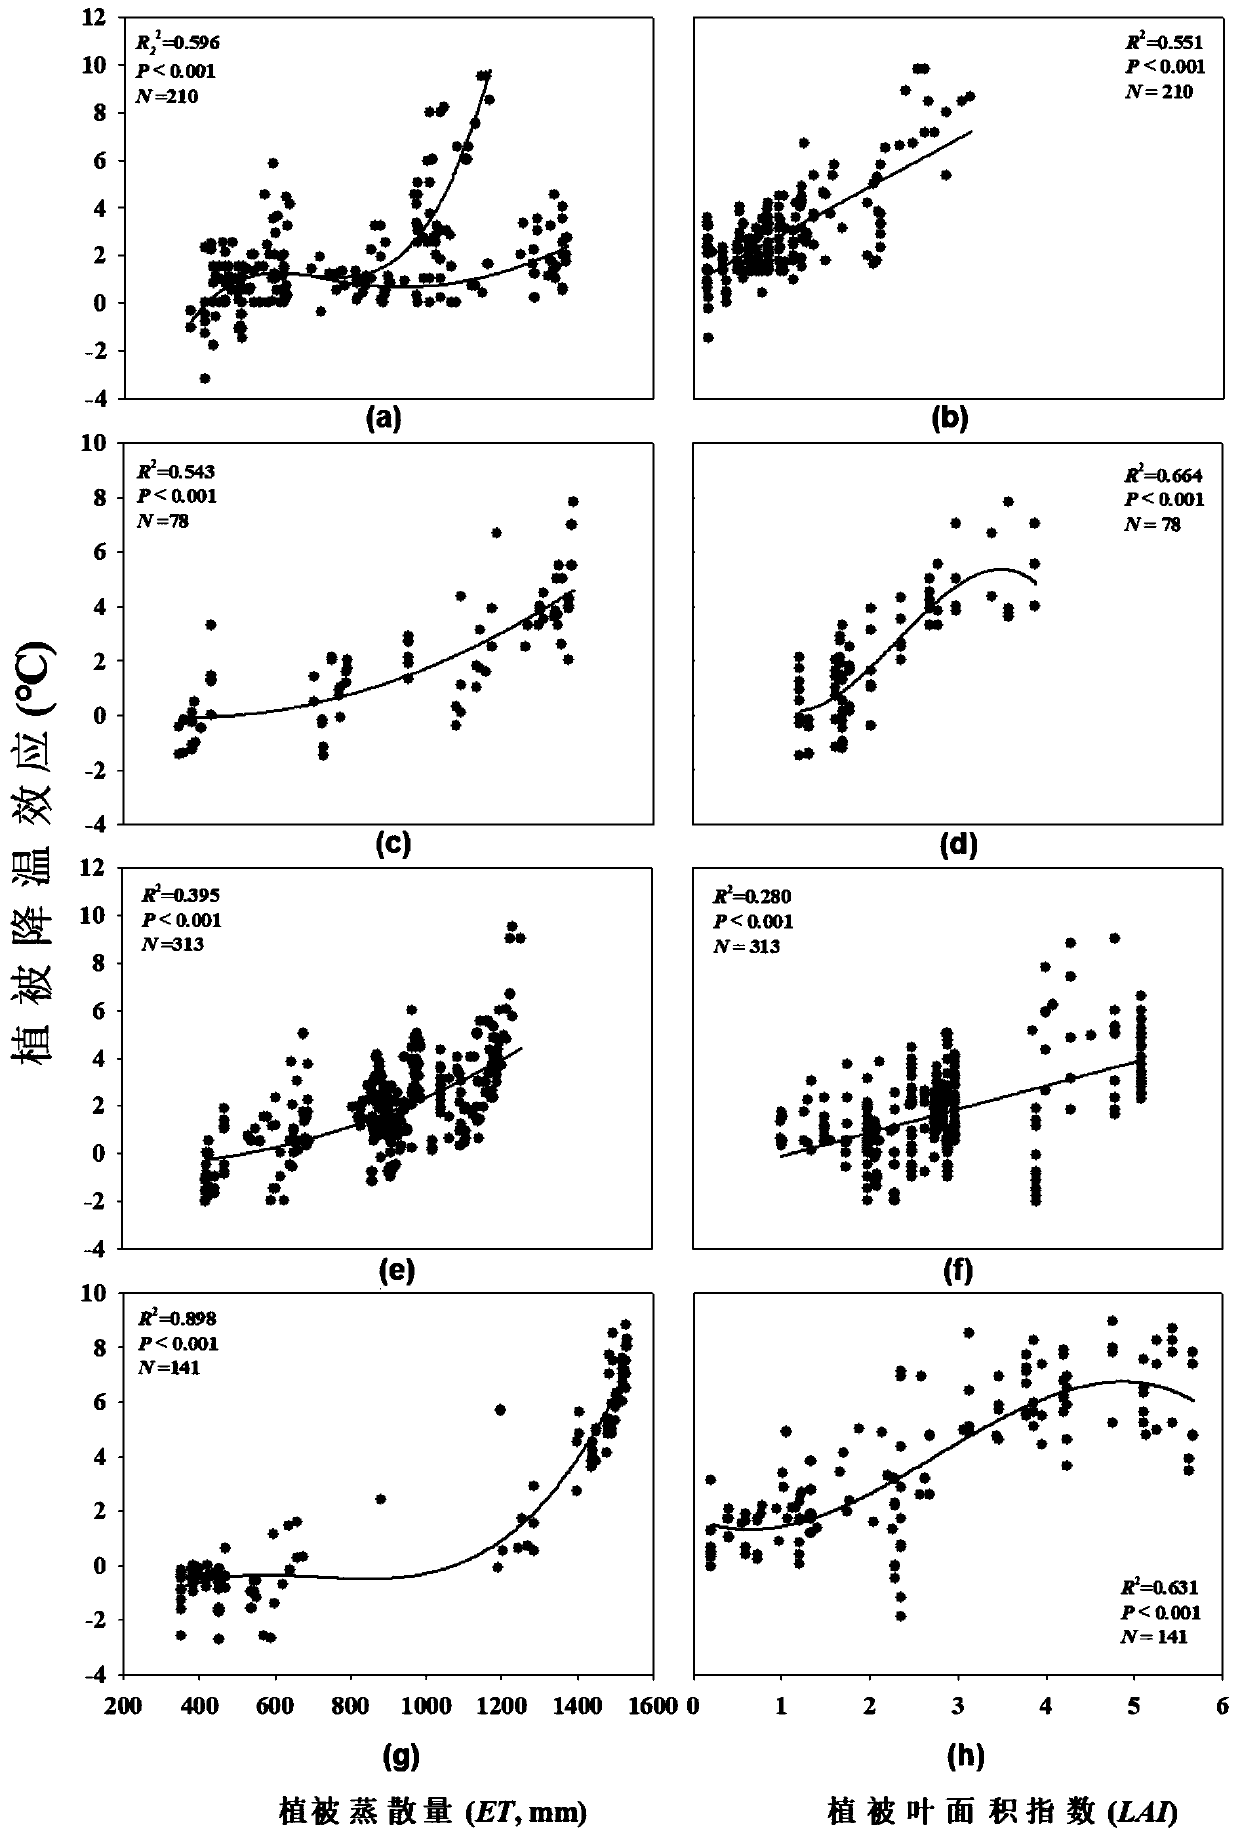
[0145] see Figure 1 to Figure 6 , a quantitative assessment method for the cooling effect of urban green spaces in different climate zones, including

[0146] Step 1: Obtain the monthly average temperature, normalized difference vegetation index, annual average rainfall, monthly average rainfall and monthly actual sunshine hours of the plot to be evaluated.

[0147] Step 2: Calculate the vegetation drought index based on the annual average rainfall, monthly actual sunshine hours and monthly average temperature.

[0148] According to the annual average rainfall, monthly actual sunshine hours and monthly average temperature, the vegetation drought index is calculated as:

[0149] AI=P a / PET

[0150] In the formula, P a represents the average annual rainfall (mm), PET represents the potential evapotranspiration (mm),

[0151] The potential evapotranspiration is:

[0152]

[0153] In the formula, T (°C) is the monthly average temperature, S is the actual monthly sunshin...


PUM


Abstract

The invention discloses a method and a system for quantitatively evaluating the cooling effect of urban greenbelts in different climatic areas in the technical field of urban greenbelt cooling evaluation. The method comprises the following steps of based on a drought index, dividing global observation sample points into an arid region, a semi-arid and semi-humid region, a moderate humid region and an extreme humid region; combining field observation and satellite remote sensing technologies; analyzing the relationship between evapotranspiration and cooling effects of different vegetation types and the relationship between the leaf area index and the cooling effects of different vegetation types in different climate regions on the basis. The cooling effect evaluation models of the grassland type, the shrub type, the arbor type and the arbor-shrub-grass composite structure type in an arid region, the semi-arid region and the semi-humid region, the moderate humid region and the extreme humid region with the evapotranspiration and / or the leaf area index as characterization parameters are comprehensively constructed.

Description

technical field [0001] The invention relates to the technical field of urban green space cooling evaluation technology, in particular to a method and system for quantitatively evaluating the cooling effect of urban green space in different climate zones. Background technique [0002] The rapid development of urbanization in China has caused a large number of man-made buildings to replace the natural surface, completely changing the natural heat pattern of the human living environment, and eventually resulting in the urban temperature being significantly higher than that in the suburbs, forming the so-called "heat island effect". Foreign researchers have found that, Urban green space vegetation can effectively alleviate the urban "heat island effect". At present, there are three main research methods for green space cooling research at home and abroad: spot observation, satellite remote sensing technology, and green space cooling model. Spot-based field observation is the mo...

Claims


Application Information

Patent Timeline
Patent Type & Authority Applications(China)
IPC IPC(8): G06F30/20G01N21/17G01W1/00G06F119/08
CPCG01N21/17G01W1/00G01N2021/1793
Inventor 苏泳娴陈修治吴建平刘礼杨
Owner GUANGZHOU INST OF GEOGRAPHY GUANGDONG ACAD OF SCI
Learn More