A dual-field optical coherence tomography imaging system and material thickness detection method
A technology of optical coherence tomography and scanning imaging, which is applied in the direction of measuring devices, optical devices, instruments, etc.
- Summary
- Abstract
- Description
- Claims
- Application Information
AI Technical Summary
Problems solved by technology
Method used
Image
Examples
Embodiment 1
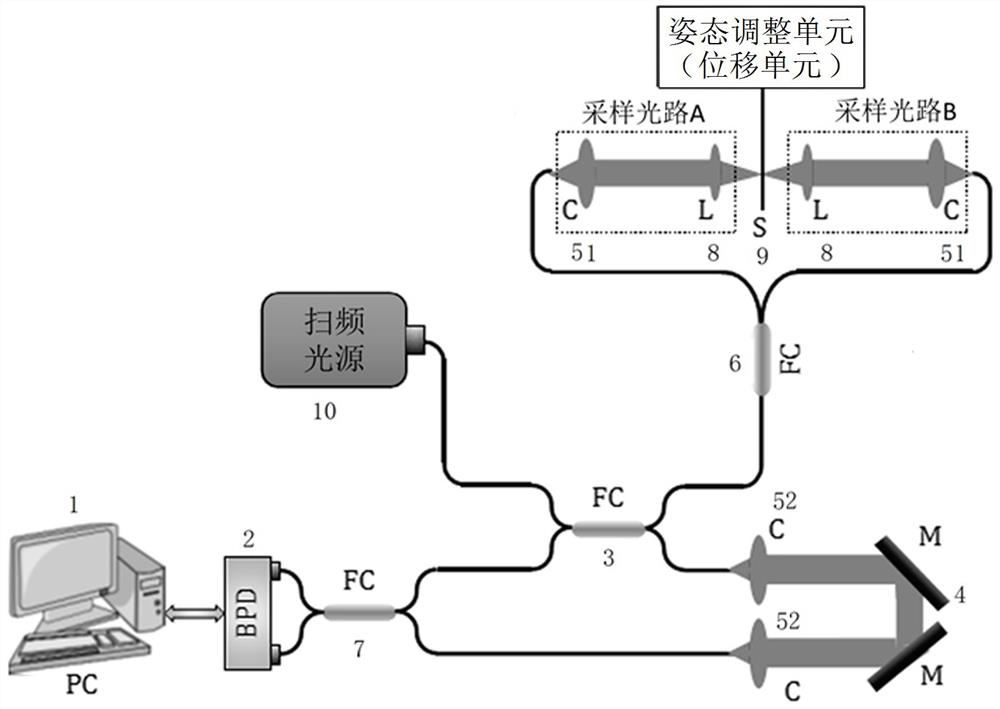
[0080] The PC 1 cooperates with the sample arm in the DSV-OCT system and the attitude adjustment unit of the sample placement platform to perform B-scan and C-scan, and realize data acquisition and processing. The data acquisition card set in the PC 1 uses the external k clock provided by the laser source as the sampling clock to perform analog-to-digital conversion on the signal output by the balanced detector, and the obtained interference spectrum signals are evenly distributed in the wave number space and stored in the Computer memory for subsequent Fourier transform calculations. The data acquisition program is built on the LabVIEW platform, which is used to collect data and control the movement of the electric translation platform to realize B-scan and C-scan. Data processing is mainly to convert the interference signal into a signal in the sample depth domain by performing spectral shaping, Fourier transform and removing fixed pattern noise on the detected interference ...
Embodiment 2
[0095] On the basis of Embodiment 1, the ability of the DSV-OCT system to generate a two-dimensional thickness map. Customize a 1-inch opaque disc engraved with a circular wall (inner diameter: 2mm, outer diameter: 3mm, height: 0.3mm) as a sample. A 4mm square area was scanned with the DSV-OCT system, and the scanned original 3D image is as follows Figure 7 As shown in (a) figure. The overall contours of the two surfaces can be clearly seen from the 3D graphics. Figure 7 The picture in (b) is Figure 7 An example of a cross-sectional image at the dotted rectangular box in (a) panel. Before computing the thickness, mean filtering was used to further reduce noise. Figure 8 Figure (a) plots the contours of the two surfaces, and the material thickness calculated using formula (4) as Figure 8 As shown in (b) figure. There are some slight fluctuations in the thickness, indicating that the surface roughness of the material is not very good.
[0096] In addition, DSV-OCT sy...
PUM
 Abstract
Description
Claims
Application Information
 - R&D
- Intellectual Property
- Life Sciences
- Materials
- Tech Scout
- Unparalleled Data Quality
- Higher Quality Content
- 60% Fewer Hallucinations
Browse by: Latest US Patents, China's latest patents, Technical Efficacy Thesaurus, Application Domain, Technology Topic, Popular Technical Reports.
© 2025 PatSnap. All rights reserved.Legal|Privacy policy|Modern Slavery Act Transparency Statement|Sitemap|About US| Contact US: help@patsnap.com


