Oscilloscope signal display processing method and oscilloscope
An oscilloscope and signal data technology, which is applied in the direction of digital variable/waveform display, digital variable display, instruments, etc., can solve the problems of oscilloscope screen display preview waveform slowness and long time, and achieve the effect of avoiding slow display and shortening the display
- Summary
- Abstract
- Description
- Claims
- Application Information
AI Technical Summary
Problems solved by technology
Method used
Image

Examples
Embodiment 1
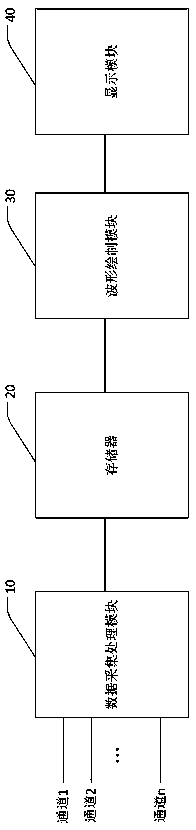
[0056] Please refer to figure 1 , figure 1 It is a schematic structural diagram of an oscilloscope in an embodiment, and the oscilloscope includes a data acquisition and processing module 10 , a memory 20 , a waveform drawing module 30 and a display module 40 .
[0057] The data collection and processing module 10 is used to collect signal data of each channel, and convert the signal data of each channel into waveform data. The data acquisition and processing module 10 converts the analog signal data of each channel into digital signal data, and processes the digital signal data into waveform data through coordinate conversion, color conversion and other methods.
[0058] The memory 20 is used to store waveform data in units of frames. The memory 20 in this embodiment is an external memory, such as DDR.
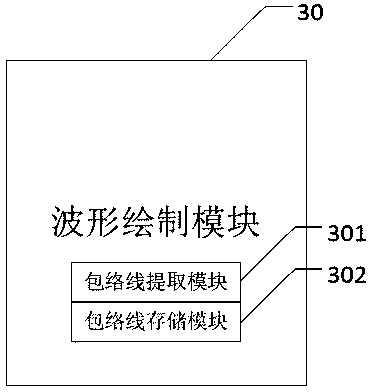
[0059] The waveform drawing module 30 is used to read the waveform data from the memory 20 in units of frames and draw the waveform data as a waveform image, extract the e...
Embodiment approach
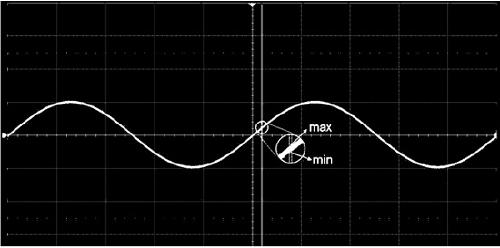
[0073] When adjusting the time base of the oscilloscope, if the time base becomes larger, the waveform needs to be compressed. In one embodiment, assuming that the original compression ratio is an integer multiple of D: 1, the new compression ratio for envelope compression is also D: 1, that is, the envelope information of each D column of the original waveform is compressed to 1 column, Specifically, compare all the minimum values min in each D-column waveform of the original waveform to obtain the minimum value min' among all the minimum values min in each D-column waveform. For example, compare min1, min2...minD, if the minimum value is min2, then the minimum min' is min2. In the same way, compare all the maximum values max in each D column waveform of the original waveform to obtain the maximum value max' of all the maximum value max in each D column waveform. For example, compare max1, max2...maxD, if the maximum The value is max2, then the maximum value max' is ma...
PUM
 Abstract
Description
Claims
Application Information
 - R&D
- Intellectual Property
- Life Sciences
- Materials
- Tech Scout
- Unparalleled Data Quality
- Higher Quality Content
- 60% Fewer Hallucinations
Browse by: Latest US Patents, China's latest patents, Technical Efficacy Thesaurus, Application Domain, Technology Topic, Popular Technical Reports.
© 2025 PatSnap. All rights reserved.Legal|Privacy policy|Modern Slavery Act Transparency Statement|Sitemap|About US| Contact US: help@patsnap.com