PLC channel pulse noise detection method and system using F square module
A noise detection and impulse noise technology, applied in the field of communication, can solve problems such as low signal-to-noise ratio, high noise intensity, and low transmission power
Active Publication Date: 2020-10-09
GUANGDONG UNIV OF PETROCHEMICAL TECH
6 Cites 6 Cited by
AI-Extracted Technical Summary
Problems solved by technology
[0003] Although the power line communication system has a wide range of applications and the technology is relatively mature, a large number of branches and electrical equipment in the power line communication system will generate a lot of noise in the power line channel; among them, random impulse noise has great randomness, and the noise intensity High, causing serious damage to the power line communication system, therefore, the suppression technology for random impulse noise has been the focus of research by domestic and foreign scholars; and the noise model does not conform to the Gaussian distribution
Therefore, the traditional communication system designed for Gaussian noise is no longer applicable to the power line carrier communication system, and the corresponding noise suppression technology must be studied to ...
Abstract
An embodiment of the invention discloses a PLC channel pulse noise detection method and a PLC channel pulse noise detection system using an F square module. The PLC channel pulse noise detection method comprises the steps of: 101, acquiring a signal sequence S collected according to a time sequence; 102, solving a data delay factor K; 103, generating an n-th signal delay sequence delta S<n>; 104,solving a Gaussian initial matrix Q<0>; step 105, initializing an iterative control parameter k; step 106, solving a Gaussian optimization updating matrix Q<k+1>; 107, solving an F square modulus error epsilon<k+1>; 108, judging whether the F square modulus error epsilon<k+1> is greater than or equal to a preset threshold epsilon<0> or not; 109, solving an F square modulus optimization factor H<n>; and 110, judging PLC impulse noise.
Application Domain
Power distribution line transmissionLine-transmission monitoring/testing
Technology Topic
Impulse noise detectionEngineering +4
Image
Examples
- Experimental program(1)
Example Embodiment
[0036] The technical solutions in the embodiments of the present invention will be clearly and completely described below in conjunction with the drawings in the embodiments of the present invention. Obviously, the described embodiments are only a part of the embodiments of the present invention, rather than all the embodiments. Based on the embodiments of the present invention, all other embodiments obtained by those of ordinary skill in the art without creative work shall fall within the protection scope of the present invention.
[0037] In order to make the above-mentioned objects, features and advantages of the present invention more obvious and easy to understand, the present invention will be further described in detail below in conjunction with the accompanying drawings and specific embodiments.
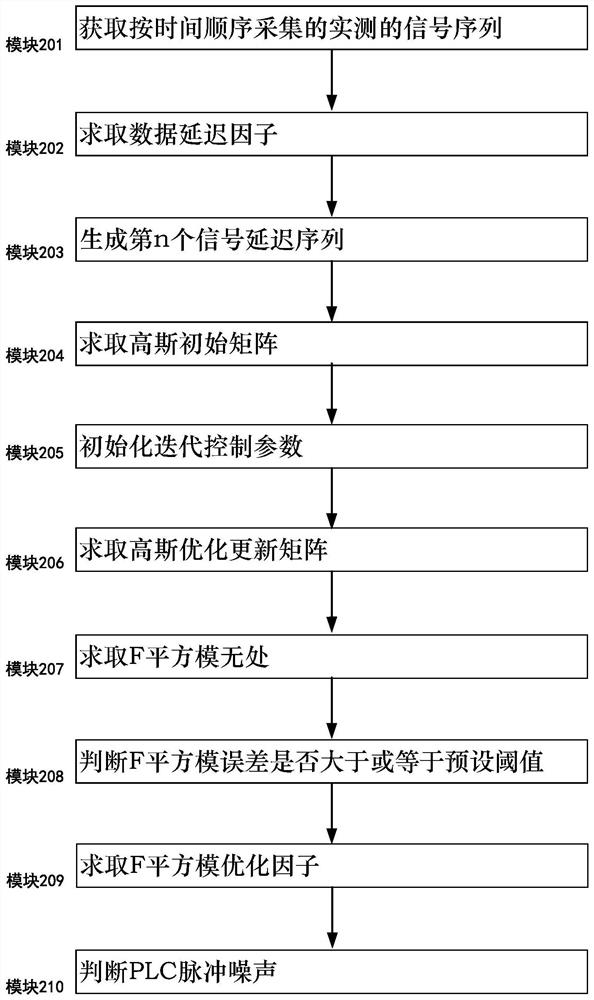
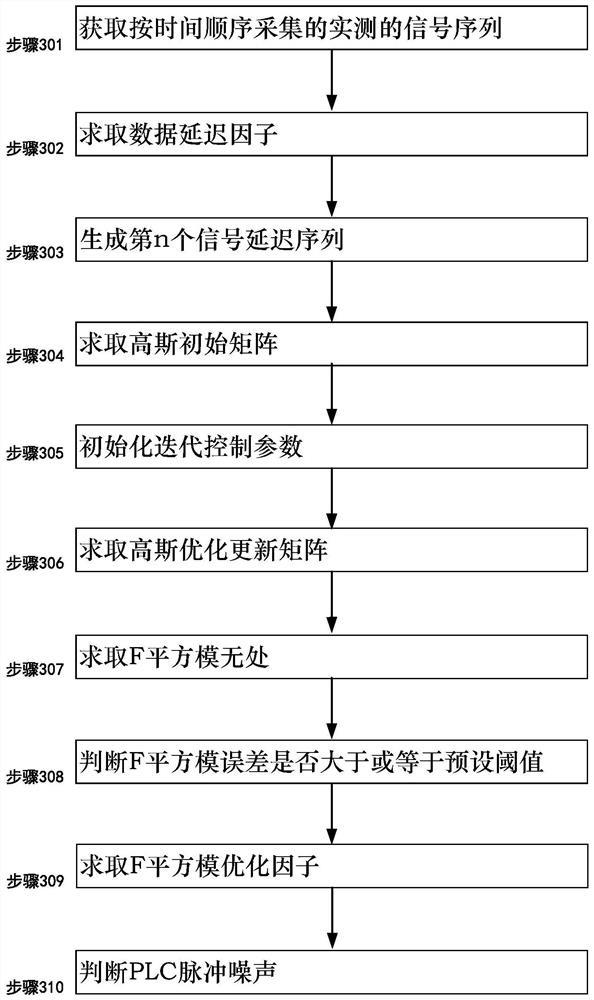
[0038] figure 1 A schematic flow diagram of a PLC channel impulse noise detection method using F square mode
[0039] figure 1 It is a schematic flow diagram of a PLC channel impulse noise detection method using F-squared mode of the present invention. Such as figure 1 As shown, the method for detecting impulse noise in PLC channels using F-squared mode specifically includes the following steps:
[0040] Step 101: Obtain a signal sequence S collected in time sequence;
[0041] Step 102: Obtain the data delay factor K, specifically: the data delay factor K calculation formula is Wherein, snr is the signal-to-noise ratio of the signal sequence S; N is the length of the signal sequence S; Is the round-down operation;
[0042] Step 103 Generate the nth signal delay sequence ΔS n , Specifically: the nth signal delay sequence ΔS n The i-th element is i is the sequence number of the first element, and its value range is i=1, 2, ..., n; the nth signal delay sequence ΔS n The j-th element of is 0; j is the second element number, and its value range is j=i+1,i+2,···,N; Is the first |i+K| of the signal sequence S N Elements; || N Represents the operation of taking the remainder with N as the modulus; n is the sequence number of the delay sequence, and its value range is n=1, 2, ···,N;
[0043] Step 104 Find the initial Gaussian matrix Q 0 , Specifically: the Gaussian initial matrix Q 0 Element in row o and column z The calculation formula is Among them, rand[0,1] is a random function of uniform distribution in the interval [0,1]; randG[0,1] is a random function of Gaussian distribution with a mean value of 0 and a mean square error of 1; m 0 Is the mean value of the signal sequence S; σ 2 Is the variance of the signal sequence S; o is the row number, and its value range is o=1, 2, ···, N; z is the column number, and its value range is z=1, 2, ··· ,N;
[0044] Step 105 Initialize the iteration control parameter k, specifically: the value of the iteration control parameter k is initialized to 0;
[0045] Step 106 Find the Gaussian optimization update matrix Q k+1 , Specifically: the Gaussian optimization update matrix Q k+1 The calculation formula is Where a l Is the l-th eigenvector of the correlation matrix B; l is the eigenvector number, and its value range is h=1, 2, ···, N; the calculation formula of the correlation matrix B is B=[ΔS N -m 0 ] T [ΔS N -m 0 ]; λ is the optimization factor, and the calculation formula of the optimization factor λ is I is the identity matrix;
[0046] Step 107 Find the F square modulus error ε k+1 , Specifically: the F square modulus error ε k+1 The calculation formula is Where |||| F Represents the Frobenius module;
[0047] Step 108: Determine the F square modulus error ε k+1 Is greater than or equal to the preset threshold ε 0 , Specifically: if the F square modulus error ε k+1 Greater than or equal to the preset threshold ε 0 , The value of the iterative control parameter k is increased by 1, and the step 106, the step 107, and the step 108 are iterated again until the F square modulus error ε k+1 Less than the preset threshold ε 0 So far, the iterative process ends, and the Gaussian optimization update matrix Q k+1 The value of is recorded as the best Gaussian optimization matrix Q opt; Wherein the preset threshold ε 0 Is ε 0 =0.001;
[0048] Step 109 Calculate the F square modulus optimization factor H n , Specifically: the F square modulus optimization factor H n The formula for obtaining is
[0049] Step 110 Determine the PLC impulse noise, specifically: if the F square modulus H n Greater than or equal to the impulse noise judgment threshold κ 0 , Then impulse noise is detected at the nth point of the signal sequence S; if the F-squared modulus optimization factor H n Less than the impulse noise judgment threshold κ 0 , Then no impulse noise is detected at the nth point of the signal sequence S; wherein, the impulse noise judgment threshold κ 0 The calculation formula is
[0050] figure 2 The structural intention of a PLC channel impulse noise detection system using F-square mode
[0051] figure 2 It is a schematic diagram of the structure of a PLC channel impulse noise detection system using F square mode of the present invention. Such as figure 2 As shown, the PLC channel impulse noise detection system using F square mode includes the following structure:
[0052] The module 201 obtains the signal sequence S collected in time sequence;
[0053] The module 202 obtains the data delay factor K, specifically: the data delay factor K calculation formula is Wherein, snr is the signal-to-noise ratio of the signal sequence S; N is the length of the signal sequence S; Is the round-down operation;
[0054] Module 203 generates the nth signal delay sequence ΔS n , Specifically: the nth signal delay sequence ΔS n The i-th element is i is the sequence number of the first element, and its value range is i=1, 2, ..., n; the nth signal delay sequence ΔS n The j-th element of is 0; j is the second element number, and its value range is j=i+1,i+2,···,N; Is the first |i+K| of the signal sequence S N Elements; || N Represents the operation of taking the remainder with N as the modulus; n is the sequence number of the delay sequence, and its value range is n=1, 2, ···,N;
[0055] Module 204 Get the initial Gaussian matrix Q 0 , Specifically: the Gaussian initial matrix Q 0 Element in row o and column z The calculation formula is Among them, rand[0,1] is a random function of uniform distribution in the interval [0,1]; randG[0,1] is a random function of Gaussian distribution with a mean value of 0 and a mean square error of 1; m 0 Is the mean value of the signal sequence S; σ 2 Is the variance of the signal sequence S; o is the row number, and its value range is o=1, 2, ···, N; z is the column number, and its value range is z=1, 2, ··· ,N;
[0056] The module 205 initializes the iteration control parameter k, specifically: the value of the iteration control parameter k is initialized to 0;
[0057] Module 206 Obtain Gaussian optimization update matrix Q k+1 , Specifically: the Gaussian optimization update matrix Q k+1 The calculation formula is Where a l Is the l-th eigenvector of the correlation matrix B; l is the eigenvector number, and its value range is h=1, 2, ···, N; the calculation formula of the correlation matrix B is B=[ΔS N -m 0 ] T [ΔS N -m 0 ]; λ is the optimization factor, and the calculation formula of the optimization factor λ is I is the identity matrix;
[0058] Module 207 finds F square modulus error ε k+1 , Specifically: the F square modulus error ε k+1 The calculation formula is Where |||| F Represents the Frobenius module;
[0059] The module 208 determines the F square modulus error ε k+1 Is greater than or equal to the preset threshold ε 0 , Specifically: if the F square modulus error ε k+1 Greater than or equal to the preset threshold ε 0 , The value of the iteration control parameter k is increased by 1 and the module 206, the module 207, and the module 208 are iterated again until the F square modulus error ε k+1 Less than the preset threshold ε 0 So far, the iterative process ends, and the Gaussian optimization update matrix Q k+1 The value of is recorded as the best Gaussian optimization matrix Q opt; Wherein the preset threshold ε 0 Is ε 0 =0.001;
[0060] Module 209 Obtain F square modulus optimization factor H n , Specifically: the F square modulus optimization factor H n The formula for obtaining is
[0061] The module 210 judges the PLC impulse noise, specifically: if the F square modulus H n Greater than or equal to the impulse noise judgment threshold κ 0 , Then impulse noise is detected at the nth point of the signal sequence S; if the F-squared modulus optimization factor H n Less than the impulse noise judgment threshold κ 0 , Then no impulse noise is detected at the nth point of the signal sequence S; wherein the impulse noise judgment threshold κ 0 The calculation formula is
[0062] A specific implementation case is provided below to further illustrate the scheme of the present invention
[0063] image 3 It is a schematic flow diagram of a specific implementation case of the present invention. Such as image 3 As shown, it specifically includes the following steps:
[0064] Step 301: Obtain the signal sequence S collected in time sequence;
[0065] Step 302 Calculate the data delay factor K, specifically: the data delay factor K calculation formula is Wherein, snr is the signal-to-noise ratio of the signal sequence S; N is the length of the signal sequence S; Is the round-down operation;
[0066] Step 303 Generate the nth signal delay sequence ΔS n , Specifically: the nth signal delay sequence ΔS n The i-th element is i is the sequence number of the first element, and its value range is i=1, 2, ..., n; the nth signal delay sequence ΔS n The j-th element of is 0; j is the second element number, and its value range is j=i+1,i+2,···,N; Is the first |i+K| of the signal sequence S N Elements; || N Represents the operation of taking the remainder with N as the modulus; n is the sequence number of the delay sequence, and the value range is n=1, 2, ···,N;
[0067] Step 304 Find the initial Gaussian matrix Q 0 , Specifically: the Gaussian initial matrix Q 0 Element in row o and column z The calculation formula is Among them, rand[0,1] is a random function of uniform distribution in the interval [0,1]; randG[0,1] is a random function of Gaussian distribution with a mean value of 0 and a mean square error of 1; m 0 Is the mean value of the signal sequence S; σ 2 Is the variance of the signal sequence S; o is the row number, and its value range is o=1, 2, ···, N; z is the column number, and its value range is z=1, 2, ··· ,N;
[0068] Step 305 Initialize the iteration control parameter k, specifically: the value of the iteration control parameter k is initialized to 0;
[0069] Step 306 Find the Gaussian optimization update matrix Q k+1 , Specifically: the Gaussian optimization update matrix Q k+1 The calculation formula is Where a l Is the l-th eigenvector of the correlation matrix B; l is the eigenvector number, and its value range is h=1, 2, ···, N; the calculation formula of the correlation matrix B is B=[ΔS N -m 0 ] T [ΔS N -m 0 ]; λ is the optimization factor, and the calculation formula of the optimization factor λ is I is the identity matrix;
[0070] Step 307 Find the F square modulus error ε k+1 , Specifically: the F square modulus error ε k+1 The calculation formula is Where |||| F Represents the Frobenius module;
[0071] Step 308 Determine the F square modulus error ε k+1 Is greater than or equal to the preset threshold ε 0 , Specifically: if the F square modulus error ε k+1 Greater than or equal to the preset threshold ε 0 , The value of the iterative control parameter k is increased by 1, and the step 306, the step 307, and the step 308 are re-iterated until the F square modulus error ε k+1 Less than the preset threshold ε 0 So far, the iterative process ends, and the Gaussian optimization update matrix Q k+1 The value of is recorded as the best Gaussian optimization matrix Q opt; Wherein the preset threshold ε 0 Is ε 0 =0.001;
[0072] Step 309 Calculate the F square modulus optimization factor H n , Specifically: the F square modulus optimization factor H n The formula for obtaining is
[0073] Step 310 Determine the PLC impulse noise, specifically: if the F square modulus H n Greater than or equal to the impulse noise judgment threshold κ 0 , Then impulse noise is detected at the nth point of the signal sequence S; if the F-squared modulus optimization factor H n Less than the impulse noise judgment threshold κ 0 , Then no impulse noise is detected at the nth point of the signal sequence S; wherein the impulse noise judgment threshold κ 0 The calculation formula is
[0074] The various embodiments in this specification are described in a progressive manner. Each embodiment focuses on the differences from other embodiments, and the same or similar parts between the various embodiments can be referred to each other. For the system disclosed in the embodiment, since it corresponds to the method disclosed in the embodiment, the description is relatively simple, and the relevant information can be referred to the description of the method part.
[0075] Specific examples are used in this article to illustrate the principles and implementation of the present invention. The description of the above examples is only used to help understand the method and core idea of the present invention; at the same time, for those of ordinary skill in the art, according to the present invention There will be changes in the specific implementation and scope of application. In summary, the content of this specification should not be construed as limiting the present invention.
PUM


Description & Claims & Application Information
We can also present the details of the Description, Claims and Application information to help users get a comprehensive understanding of the technical details of the patent, such as background art, summary of invention, brief description of drawings, description of embodiments, and other original content. On the other hand, users can also determine the specific scope of protection of the technology through the list of claims; as well as understand the changes in the life cycle of the technology with the presentation of the patent timeline. Login to view more.