
Oil sand interlayer quantitative identification method and system based on electric imaging logging

A quantitative identification and electrical imaging technology, applied in radio wave measurement systems, electrical/magnetic detection for logging records, measurement devices, etc. Distinguish the special lithology of mud-conglomerate and other problems to achieve the effect of reducing drilling coring and exploration and development costs

Active Publication Date: 2020-11-24
CNOOC TIANJIN BRANCH +1
View PDF8 Cites 0 Cited by
  • Summary
  • Abstract
  • Description
  • Claims
  • Application Information

AI Technical Summary

Problems solved by technology

Therefore, the identification of oil-sand interlayers is mainly the identification of lithology (facies), especially for the special lithology of mud conglomerate, but it is difficult to accurately identify mud conglomerate based on conventional well logging.
[0004] Through the investigation of existing literature, it is found that at present, there are few studies on the identification of oil-sand interlayers using well logging data at home and abroad. Restricted by conventional logging resolution, it is difficult to identify thin interlayers, and thin interlayers are common in oil sands, which has an important impact on SAGD development. At the same time, this method cannot distinguish the special lithology of mud conglomerate, often resulting in Misjudgment or omission of this type of interlayer; some scholars also calculate the mean value of porosity spectrum distribution to identify reservoir effectiveness based on electrical imaging logging data, but this is not applicable to the identification of oil-sand interlayers
Therefore, various oil sand companies mainly use a large number of full-section coring to characterize interlayers, but a high coring rate will inevitably lead to high development costs, and the continued low international oil price will inevitably bring huge costs to the development of oil sands. challenge

Method used


Image

  • Oil sand interlayer quantitative identification method and system based on electric imaging logging
  • Oil sand interlayer quantitative identification method and system based on electric imaging logging
  • Oil sand interlayer quantitative identification method and system based on electric imaging logging

Examples


Embodiment

[0064] Step 1. Electrical imaging logging data preprocessing

[0065] Use the electrical imaging logging processing module of the logging data processing software to preprocess the electrical imaging logging data, including: plate alignment, electrical button alignment, bad electrical button removal and image enhancement, etc., to obtain accurate electrical imaging logging 192 curves (FMI Instruments).

[0066] Step 2. Calculate the variance of vertical and lateral difference based on electrical imaging logging data

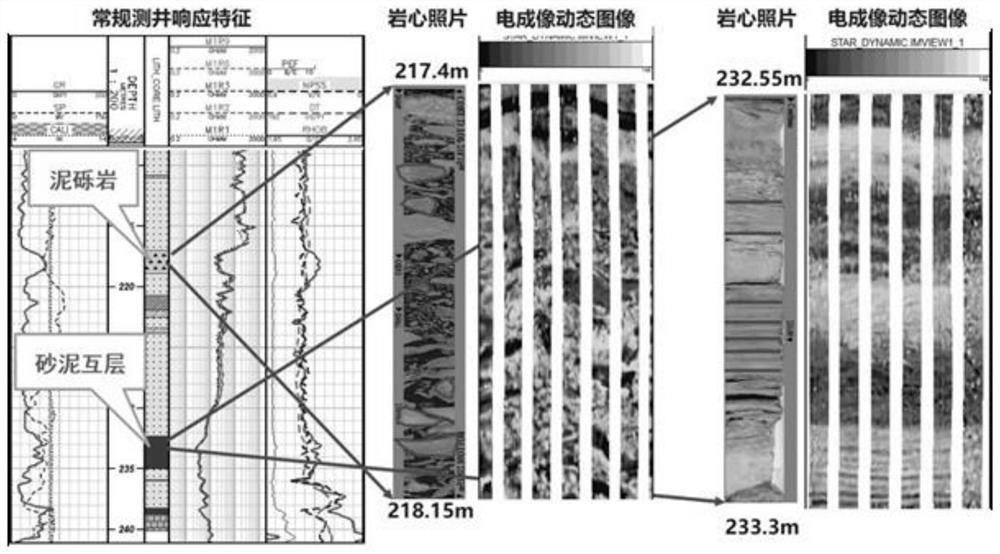
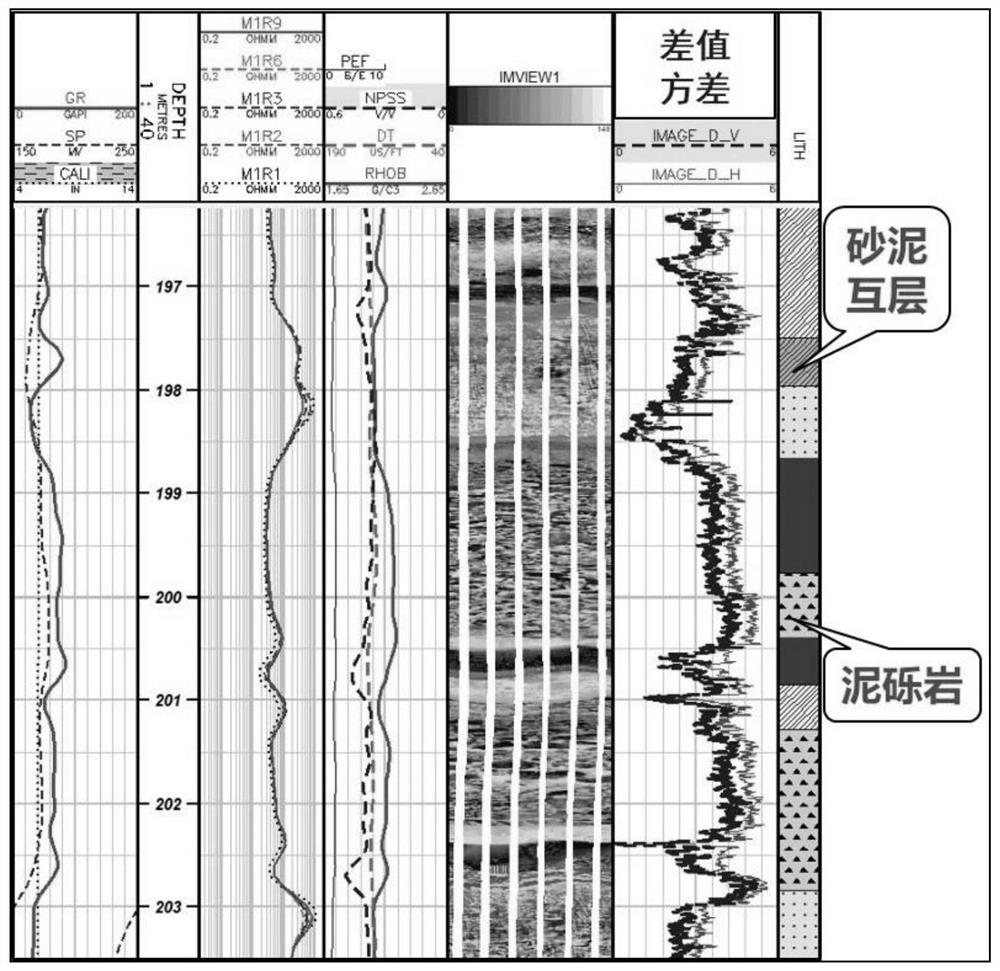
[0067] Because the conventional logging response characteristics of mud conglomerate and sand-mud interbed in oil sands are very similar, they cannot be distinguished by conventional logging, but the core and electrical imaging logging images show obvious differences between the two, as shown in figure 1 shown. In order to quantitatively identify these two important lithologies, based on 192 electrical imaging logging curves (FMI instrument), two characteristic...


PUM


Abstract

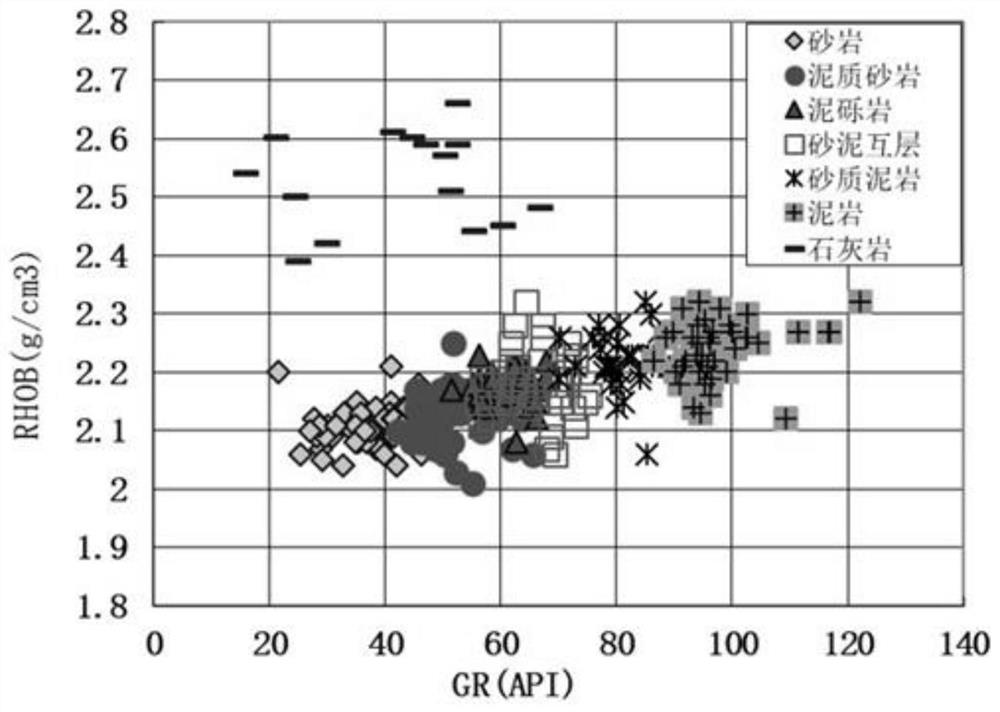
The invention relates to an oil sand interlayer quantitative recognition method and system based on electric imaging logging. The method comprises the steps that electric imaging logging data are preprocessed; two parameters of longitudinal and transverse difference variance of the 192 curves are calculated based on 192 curves of electric imaging logging; logging response characteristic analysis is carried out on the seven lithology, and lithology sensitive parameters are selected; respectively reading natural gamma, lithology density, photoelectric section indexes, longitudinal difference variance and transverse difference variance values corresponding to the seven lithology on the basis of rock core lithology, and establishing a lithology identification model by utilizing a support vector machine in a classified manner; taking natural gamma, lithologic density, a photoelectric section index, a longitudinal difference method and a transverse difference variance value as input curves;and calling a lithology identification model, utilizing a support vector machine to classify and identify lithology, dividing the types of the mud conglomerate through the mud content, and taking themud conglomerate with the mud content of more than 30% as an interlayer to realize quantitative identification of the oil sand interlayer based on electric imaging logging.

Description

technical field [0001] The invention relates to the field of identification of oil-sand interlayers, in particular to a quantitative identification method and system for oil-sand interlayers based on electrical imaging logging. Background technique [0002] Oil sands belong to unconventional oil and gas, and are an important part of global oil and gas resources, with a large amount of resources. With the increasing demand for energy in the world, the position of oil sands in the energy structure is becoming more and more important. Oil sand, also known as tar sand, tar sand or natural asphalt, usually refers to a mixture of sand, bitumen, minerals, clay and water. Oil sand oil has a higher viscosity and poor fluidity than ordinary crude oil. At the temperature of the oil layer, the viscosity is greater than 10000mpa. s, the relative density is greater than 0.95g / cm 3 . Steam-assisted gravity drainage (SAGD) is widely used in oil sands production. By injecting high-temperat...

Claims


Application Information

Patent Timeline
IPC IPC(8): G01V3/18G01V3/38
CPCG01V3/18G01V3/38Y02A90/30
Inventor 黄涛秦瑞宝田冀余杰魏丹王晖李利李铭宇
Owner CNOOC TIANJIN BRANCH
Learn More