Electronic map making method and system for partitioning and cutting based on discrete data
An electronic map and discrete data technology, applied in image data processing, image enhancement, image analysis, etc., can solve the problems of lack of display range, attention, poor drawing results, etc., and achieve the effect of improving map output efficiency and high map output efficiency
- Summary
- Abstract
- Description
- Claims
- Application Information
AI Technical Summary
Benefits of technology
Problems solved by technology
Method used
Image
Examples
Embodiment 1
[0047] This embodiment provides an electronic map drawing method for partitioning and clipping based on discrete data;
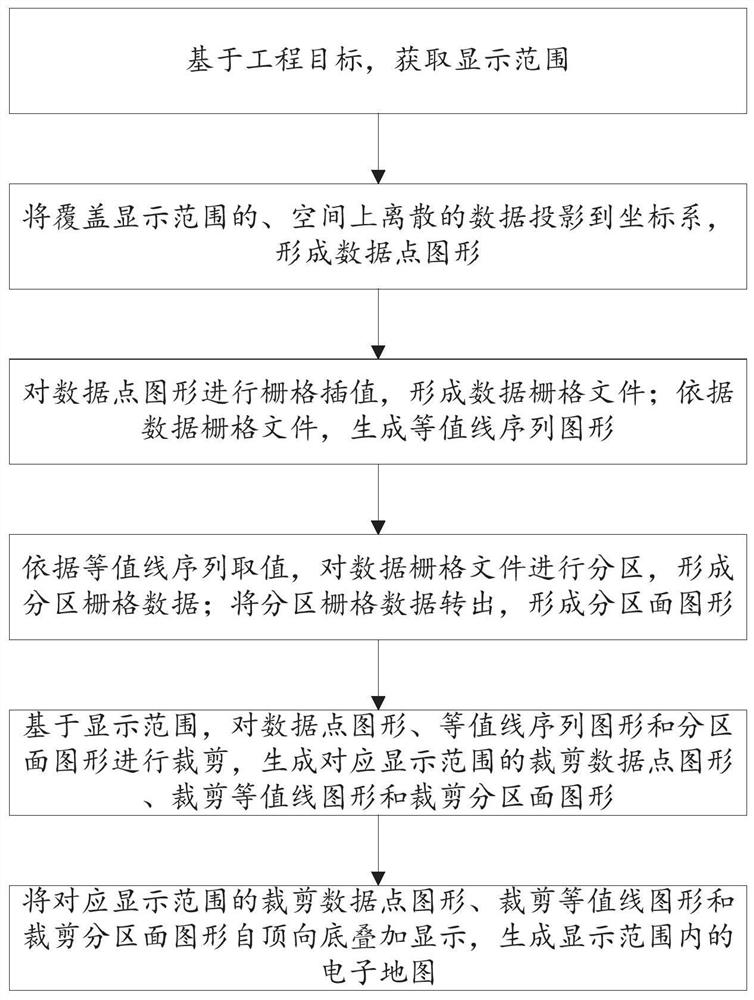
[0048] Such as figure 1 As shown, the electronic map mapping method based on discrete data partitioning and clipping includes:
[0049] S101: Obtain a display range based on the engineering target;
[0050]S102: Project the spatially discrete data covering the display range to the coordinate system to form a data point graph;
[0051] S103: Perform grid interpolation on the data point graphics to form a data grid file; according to the data grid file and the value of the contour sequence, generate a contour sequence graph;
[0052] S104: partition the data raster file according to the values of the contour sequence to form partitioned raster data; transfer the partitioned raster data to form a partitioned surface graph;
[0053] S105: Based on the display range, clipping the data point graphics, contour sequence graphics and partition surface graphics,...
Embodiment 11
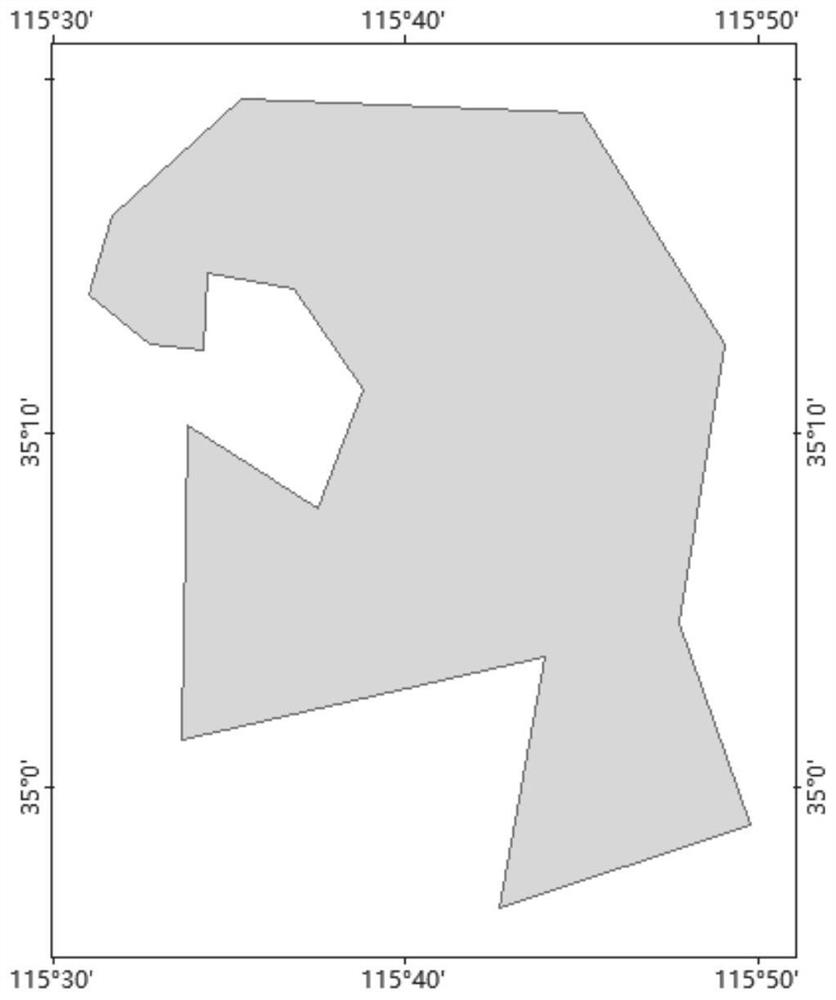
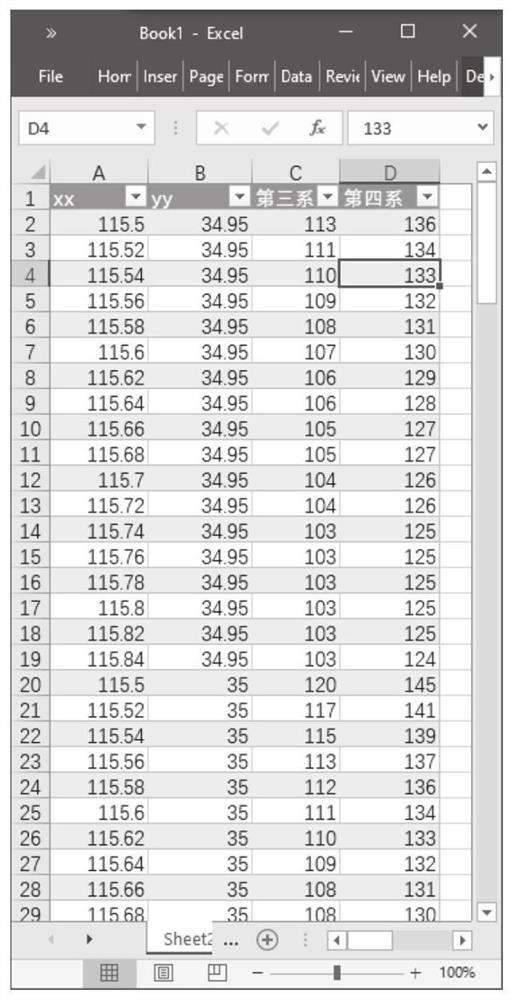
[0117] As shown in Figure 2(a) and Figure 2(b), Figure 3(a) and Figure 3(b), Figure 4 , Figure 5 , Figure 6(a) and Figure 6(b), Figure 7 As shown, this embodiment is the Quaternary formation thickness division, and the engineering target is planar. The target area is the display range without buffering. Figure 2(a) and Figure 2(b) are the source data, including the geographic location and shape of the target area (surface.shp) and the formation thickness table, the four columns of which are longitude, latitude, Tertiary thickness and Quaternary thickness . The displayed results are Quaternary thickness partitions.
[0118] Step 1. As shown in Figure 3(a) and Figure 3(b), the geographic information data is stored as a "data point.shp" point feature class file, which has the following fields: FID, shape, longitude, latitude, The thickness of the third series and the thickness of the fourth series.
[0119] Step 2. If Figure 4 As shown, kriging interpolation is performe...
Embodiment 12
[0126] As shown in Figure 9(a) and Figure 9(b), Figure 10 , Figure 11(a) and Figure 11(b) and Figure 12 As shown, this embodiment is an embodiment of land subsidence rate zoning, and the engineering target is point-shaped, which must be buffered to generate a display range.
[0127] Figure 9(a) and Figure 9(b) are the source data, including (1) the geographic location of the target area (point.shp) and (2) the subsidence rate table, the three columns of which are longitude, latitude, and subsidence rate. The results are displayed as sedimentation rate partitions.
[0128] Step 1. If Figure 10 As shown, according to the project target "point.shp", the display range "buffer.shp" is obtained. In this example, the display range is the engineering target extension buffer of 10km. This step can be realized with the buffer analysis function arcpy.Buffer_analysis() provided by the arcpy package.
[0129] Step 2. The discrete point data is stored as a "data point.shp" point feat...
PUM
 Abstract
Description
Claims
Application Information
 - R&D
- Intellectual Property
- Life Sciences
- Materials
- Tech Scout
- Unparalleled Data Quality
- Higher Quality Content
- 60% Fewer Hallucinations
Browse by: Latest US Patents, China's latest patents, Technical Efficacy Thesaurus, Application Domain, Technology Topic, Popular Technical Reports.
© 2025 PatSnap. All rights reserved.Legal|Privacy policy|Modern Slavery Act Transparency Statement|Sitemap|About US| Contact US: help@patsnap.com


