
Chart generation method and device and storage medium

A technology of charts and tables, which is applied in the computer field, can solve problems such as low chart efficiency and inconformity with user display effects, and achieve the effect of reducing modification operations and improving generation efficiency

Pending Publication Date: 2021-05-11
ZHUHAI KINGSOFT OFFICE SOFTWARE +1
View PDF0 Cites 1 Cited by
  • Summary
  • Abstract
  • Description
  • Claims
  • Application Information

AI Technical Summary

Problems solved by technology

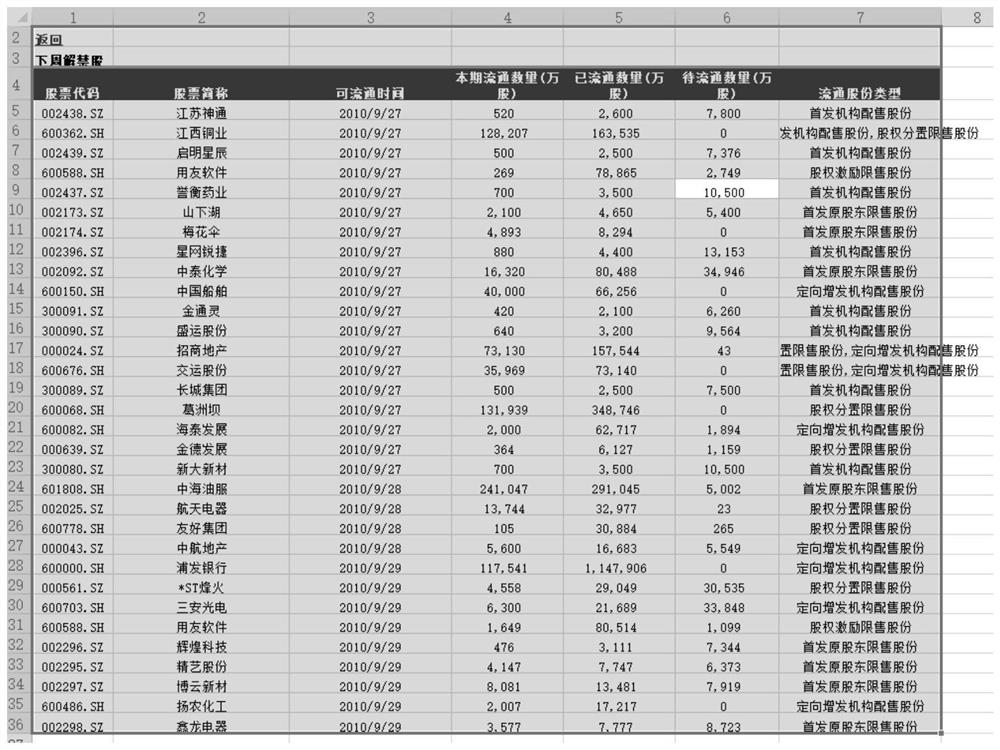
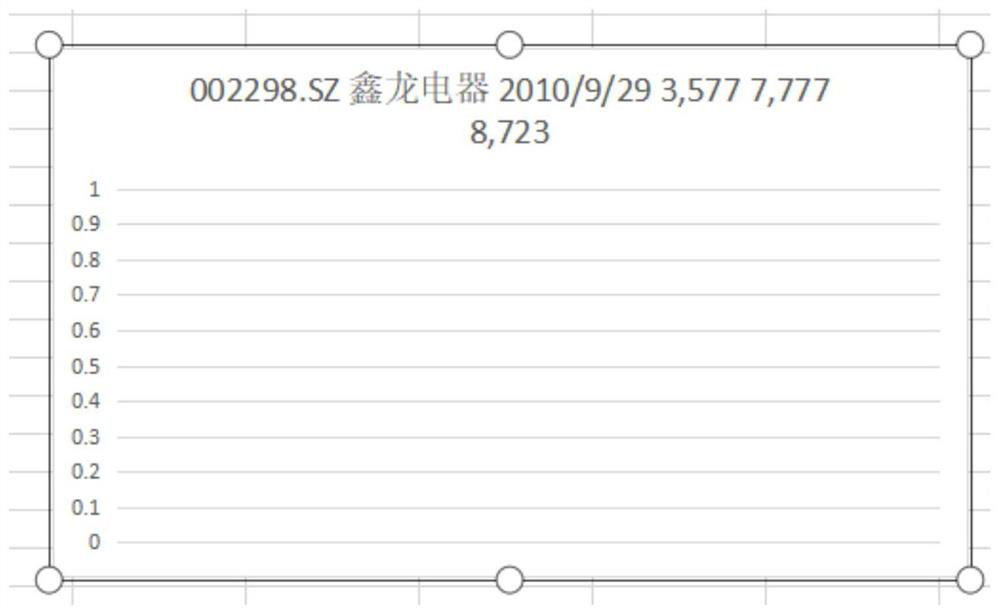
[0004] However, when there are multiple columns in the tabular data, the columns that are suitable for series value data columns and category data columns are not fixed columns. At the same time, different tabular data may be applicable to different chart types, which causes the user to select the chart type. The resulting charts often do not meet the user's desired presentation
In order to achieve the display effect required by the user, the user needs to modify the data source repeatedly and try various chart types, which undoubtedly leads to low efficiency of chart generation

Method used


Image

  • Chart generation method and device and storage medium
  • Chart generation method and device and storage medium
  • Chart generation method and device and storage medium

Examples


Embodiment Construction

[0031]This application describes at least one embodiment, but this description is illustrative rather than restrictive, and it will be obvious to those of ordinary skill in the art that within the scope of the embodiments described in this application, the There are many more embodiments and implementations. Although many possible combinations of features are shown in the drawings and discussed in the detailed description, many other combinations of the disclosed features are possible. Except where expressly limited, any feature or element of any embodiment may be used in combination with, or substituted for, any other feature or element of any other embodiment.

[0032] This application includes and contemplates combinations of features and elements known to those of ordinary skill in the art. The disclosed embodiments, features and elements of this application can also be combined with any conventional features or elements to form unique inventive solutions as defined by th...


PUM


Abstract

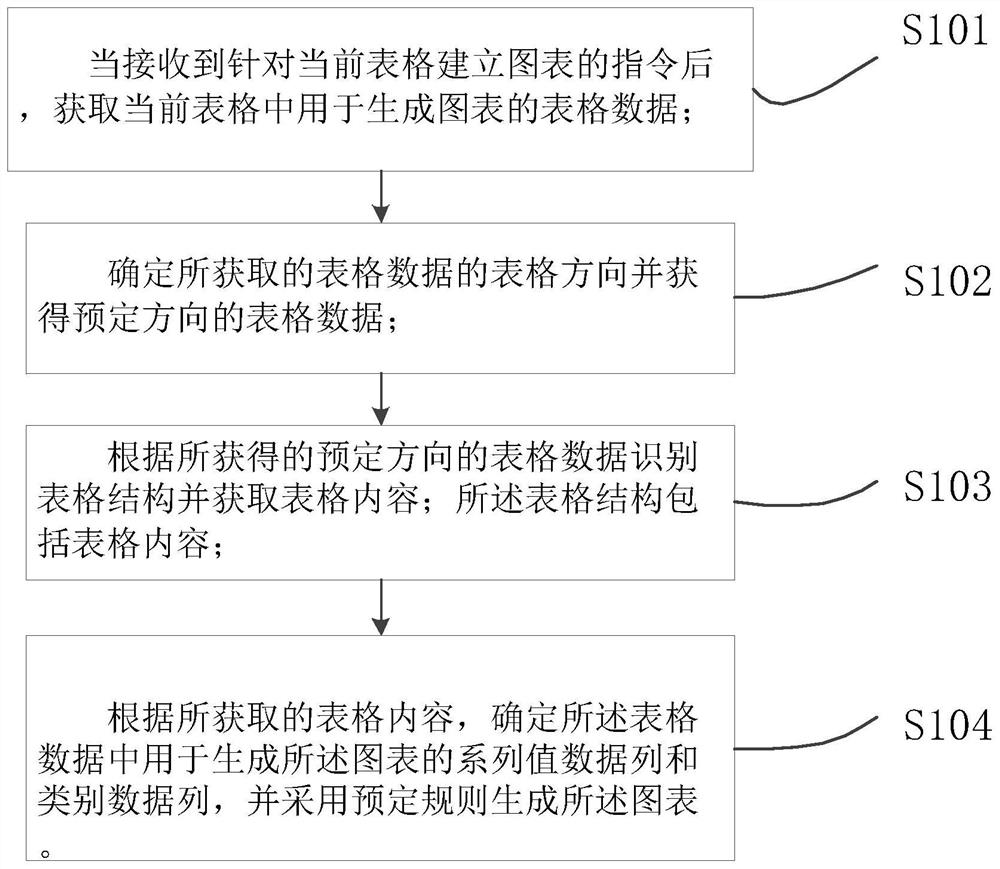
The method for generating the chart comprises the steps of obtaining table data used for generating the chart in a current table; determining a table direction of the obtained table data and obtaining table data in a predetermined direction; according to the obtained table data in the preset direction, identifying a table structure and obtaining table content; and according to the obtained table content, determining a series value data column and a category data column used for generating the chart in the table data, and generating the chart by adopting a preset rule. The method can automatically recommend the chart to the user, reduces the repeated modification operation of the user, and improves the chart generation efficiency.

Description

technical field [0001] This article relates to computer technology, especially a method, device, and storage medium for generating charts. Background technique [0002] Charts can display tabular data in a visual way, so they play an important role in office work. Among them, the chart includes two parts: the image area and the label area. The image in the image area is drawn based on the series value data column, and the labels in the label area are named based on the category data column. The series value data column and the category data column are from the chart to be generated. identified in each column of the tabular data. At the same time, the types of charts are divided into column charts, line charts, scatter charts, pie charts, etc. The number of series value data columns and the type of data in the category data columns will lead to different types of charts suitable for drawing. For example, if the number of series value data columns is greater than one, the ta...

Claims


Application Information

Patent Timeline
IPC IPC(8): G06F40/174G06F40/183
Inventor 辛洋苏奕虹皮霞林
Owner ZHUHAI KINGSOFT OFFICE SOFTWARE
Learn More