Big data visualization method and system based on database SQL graphing, and medium

A big data and database technology, applied in the database field, can solve problems such as products that have not yet been formed to meet the full process line, insufficient analysis functions, etc., to achieve an efficient solution and reduce the threshold.

Active Publication Date: 2021-12-14
CHINA ACAD OF URBAN PLANNING & DESIGN
View PDF7 Cites 0 Cited by
  • Summary
  • Abstract
  • Description
  • Claims
  • Application Information

AI Technical Summary

Problems solved by technology

[0003] When analyzing these big data, planners need to master visualization technologies such as GIS or SQL and python, which creates a certain threshold
Moreover, most of the existing technical services currently revolve around the visual display of fixed data, lack of analysis functions, and have not yet formed a full-process line product from big data to visualized drawing that meets the low threshold of planners.

Method used


Image

  • Big data visualization method and system based on database SQL graphing, and medium
  • Big data visualization method and system based on database SQL graphing, and medium
  • Big data visualization method and system based on database SQL graphing, and medium

Examples


Embodiment 1

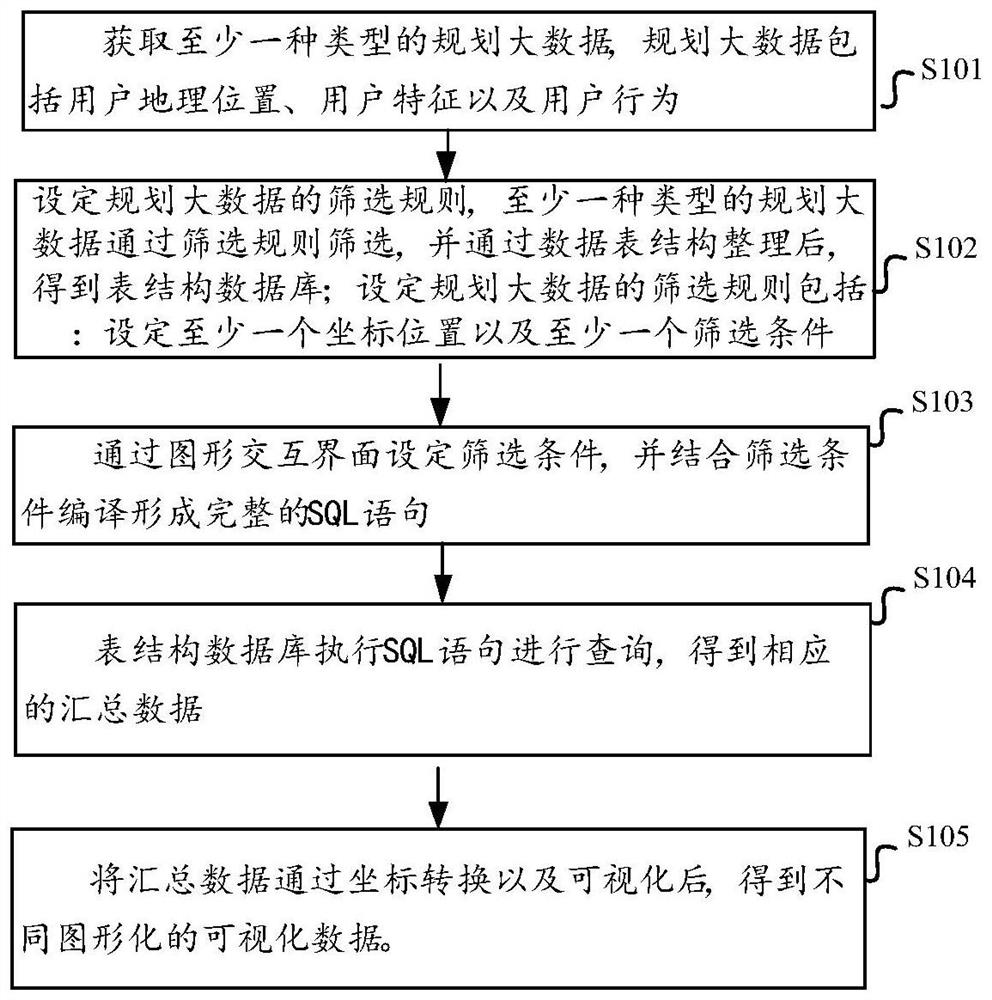
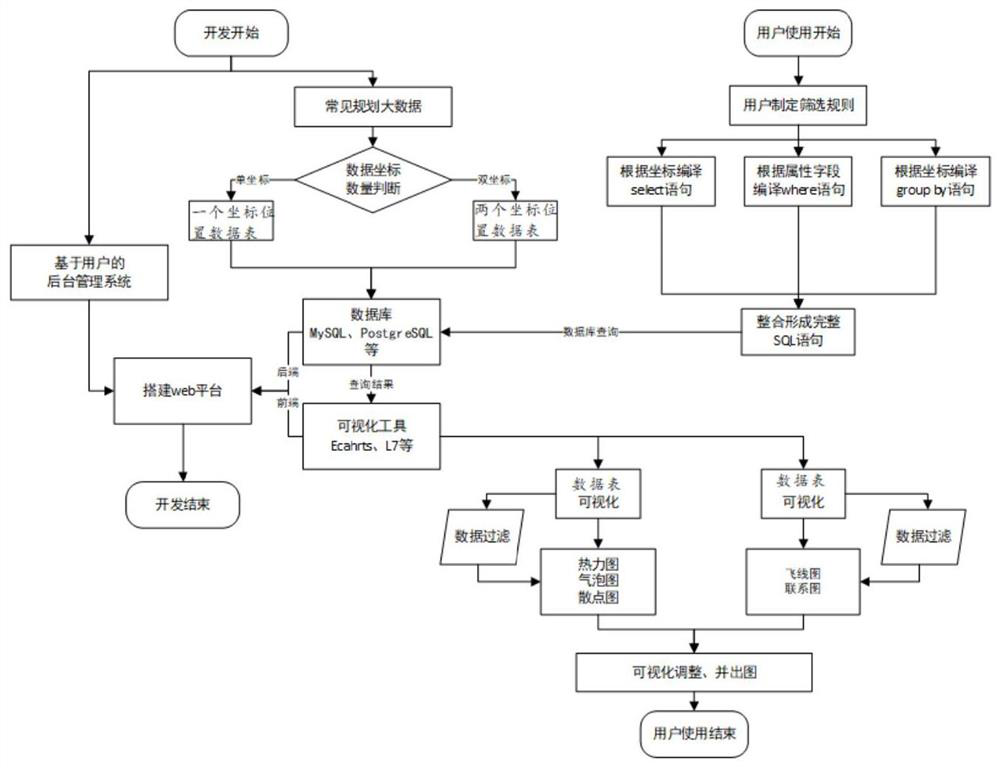
[0051] figure 1 shows a schematic diagram of the steps of the big data visualization method based on database SQL graphing according to the embodiment of the present application.

[0052] Such as figure 1 As shown, the big data visualization method based on database SQL graphics in the embodiment of the present application specifically includes the following steps:

[0053] According to the first aspect of the embodiment of the present application, a big data visualization method based on database SQL graphics is provided, which specifically includes the following steps:

[0054] S101: Obtain at least one type of planning big data, where the planning big data includes user geographic location, user characteristics, and user behavior.

[0055] Among them, planning big data includes location-based service data, mobile phone signaling data, enterprise data and / or map data.

[0056] Specific commonly used types of planning big data: one is LBS or mobile phone signaling data rep...

Embodiment 2

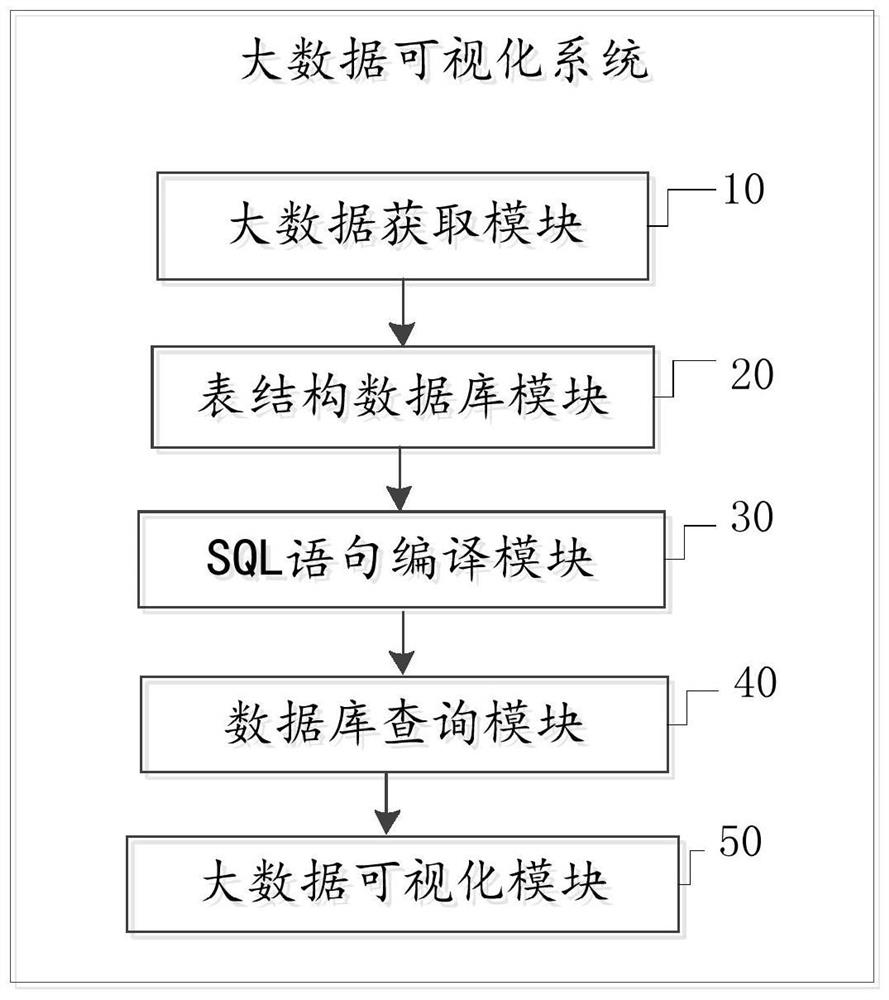
[0110] This embodiment provides a big data visualization system based on database SQL graphics. For details not disclosed in the big data visualization system based on database SQL graphics in this embodiment, please refer to database SQL graphics in other embodiments. The specific implementation content of the big data visualization method.

[0111] image 3 A schematic structural diagram of a big data visualization system based on database SQL graphing according to an embodiment of the present application is shown in .

[0112] Such as image 3 As shown, the big data visualization system based on database SQL graphics in the embodiment of the present application specifically includes a big data acquisition module 10, a table structure database module 20, an SQL statement compilation module 30, a database query module 40 and a big data visualization module 50.

[0113] specific,

[0114] Big data acquisition module 10: used to acquire at least one type of planning big data...

Embodiment 3

[0136] This embodiment provides a big data visualization device based on database SQL graphics. For details not disclosed in the big data visualization device based on database SQL graphics in this embodiment, please refer to the database SQL graphics based on other embodiments. The specific implementation content of the visualized big data method or system.

[0137] Figure 4 A schematic structural diagram of a big data visualization device 400 according to an embodiment of the present application is shown in .

[0138] Such as Figure 4 As shown, the big data visualization device 400 includes:

[0139] Memory 402: for storing executable instructions; and

[0140] Processor 401: used to connect with memory 402 to execute executable instructions so as to complete the motion vector prediction method.

[0141] Those skilled in the art can understand that the Figure 4 It is only an example of the big data visualization device 400, and does not constitute a limitation to the...


PUM


Abstract

The invention provides a big data visualization method and system based on database SQL graphing, and a medium. The method comprises the following steps: acquiring at least one type of planning big data; setting screening rules of the planning big data, screening the planning big data through the screening rules, and performing data table structure arrangement to obtain a table structure database, wherein the steps of setting the screening rules of the planning big data comprises: setting at least one coordinate position and at least one screening condition; setting a screening condition through a graphical interaction interface, and compiling in combination with the screening condition to form complete SQL statements; executing, by the table structure database, the SQL statements for querying to obtain corresponding summarized data; carrying out coordinate conversion and visualization on the summarized data to obtain different graphical visual data. According to the method, the database statements are converted into graphical expressions according to common business logic, the threshold of big data analysis is greatly reduced, and analysis results can be quickly converted into required graphical expressions in combination with a visual platform.

Description

technical field [0001] The present application belongs to the technical field of databases, and in particular relates to a big data visualization method, system and medium based on database SQL graphics. Background technique [0002] With the rise of big data in recent years, planning big data has become an important analysis dimension for planners when analyzing urban problems and preparing planning plans because of its convenience, more intuitiveness, and the ability to more accurately reflect the real situation of the city. Planning big data mainly includes LBS or mobile phone signaling data reflecting population or crowd characteristics, enterprise data provided by enterprise information service providers, and map data such as POI provided by map service providers. [0003] When analyzing these big data, planners need to master visualization technologies such as GIS or SQL and python, so a certain threshold has been formed. Moreover, most of the existing technical servi...

Claims


Application Information

Patent Timeline
Patent Type & Authority Applications(China)
IPC IPC(8): G06F16/26G06F16/29G06F16/242
CPCG06F16/26G06F16/29G06F16/2448Y02D10/00
Inventor 郑德高孙娟李鹏飞马璇杨娜娜林辰辉华沅张永波
Owner CHINA ACAD OF URBAN PLANNING & DESIGN
Why Eureka
Try Eureka