Data processing method and related device
A technology of data processing and attribute data, applied in the field of artificial intelligence, can solve the problem of inability to guarantee the consistency of sample data distribution, and achieve the effect of balanced data distribution
- Summary
- Abstract
- Description
- Claims
- Application Information
AI Technical Summary
Problems solved by technology
Method used
Image

Examples
Embodiment Construction
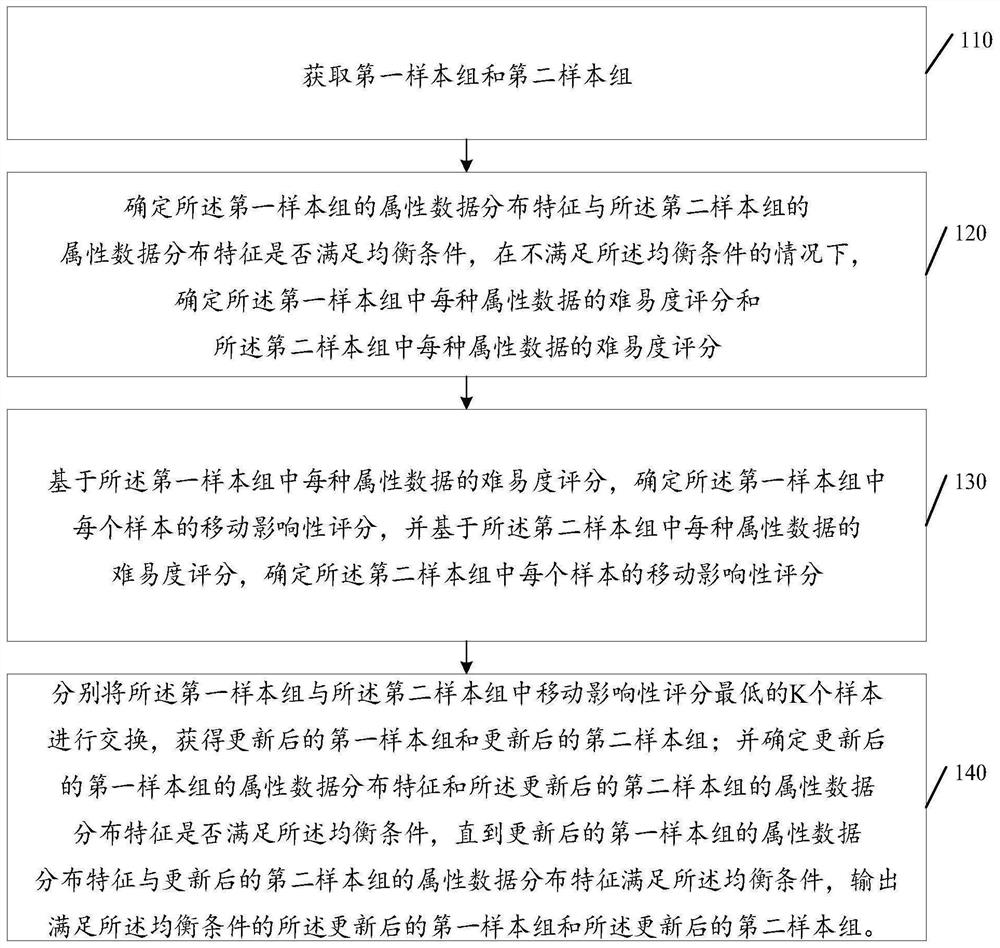
[0056] The application will be described in further detail below in conjunction with the accompanying drawings.
[0057] The terms used in the following embodiments of the present application are only for the purpose of describing specific embodiments, and are not intended to limit the present application. As used in the specification and appended claims of this application, the singular expressions "a", "an", "said", "above", "the" and "this" are intended to also Plural expressions are included unless the context clearly indicates otherwise.
[0058] In this application, "at least one (item)" means one or more, "multiple" means two or more, "at least two (items)" means two or three and three Above, "and / or" is used to describe the association relationship of associated objects, which means that there can be three kinds of relationships, for example, "A and / or B" can mean: only A exists, only B exists, and A and B exist at the same time A case where A and B can be singular o...
PUM
 Abstract
Description
Claims
Application Information
PatSnap Eureka turns technology decisions into work you can execute. Powered by our Innovation Knowledge Graph, it runs expert workflows across engineering, life sciences, materials and intellectual property. Get your review-ready output in minutes.


