3D visualization and management of reservoir monitoring data

a reservoir monitoring and 3d visualization technology, applied in the field of 3d visualization and management of reservoir monitoring data, can solve the problems of inefficient methods of analyzing such large volume of data, and relatively inaccurate interpretation and analysis, so as to maintain the integrity of original data

Active Publication Date: 2019-10-22
SRISTY TECH
View PDF17 Cites 2 Cited by
  • Summary
  • Abstract
  • Description
  • Claims
  • Application Information

AI Technical Summary

Benefits of technology

[0011]In one embodiment, a method of analyzing measurements taken in a wellbore includes defining a page size for visualizing portions of the measurements, dividing the measurements into a number of pages, wherein each page corresponds to the page size, and rendering at least one page from the number of pages for visual analysis without any downsampling and, thereby, maintaining the integrity of the original data.

Problems solved by technology

Downhole monitoring with distributed sensing systems may generate large amounts of data.
Although this time-based data may provide insight into fluid flow inside the wellbore, methods of analyzing such large volume of data have been inefficient because, in most solutions, data is significantly down sampled and, therefore, the interpretation and analysis is relatively inaccurate.

Method used


Image

  • 3D visualization and management of reservoir monitoring data
  • 3D visualization and management of reservoir monitoring data
  • 3D visualization and management of reservoir monitoring data

Examples


Embodiment Construction

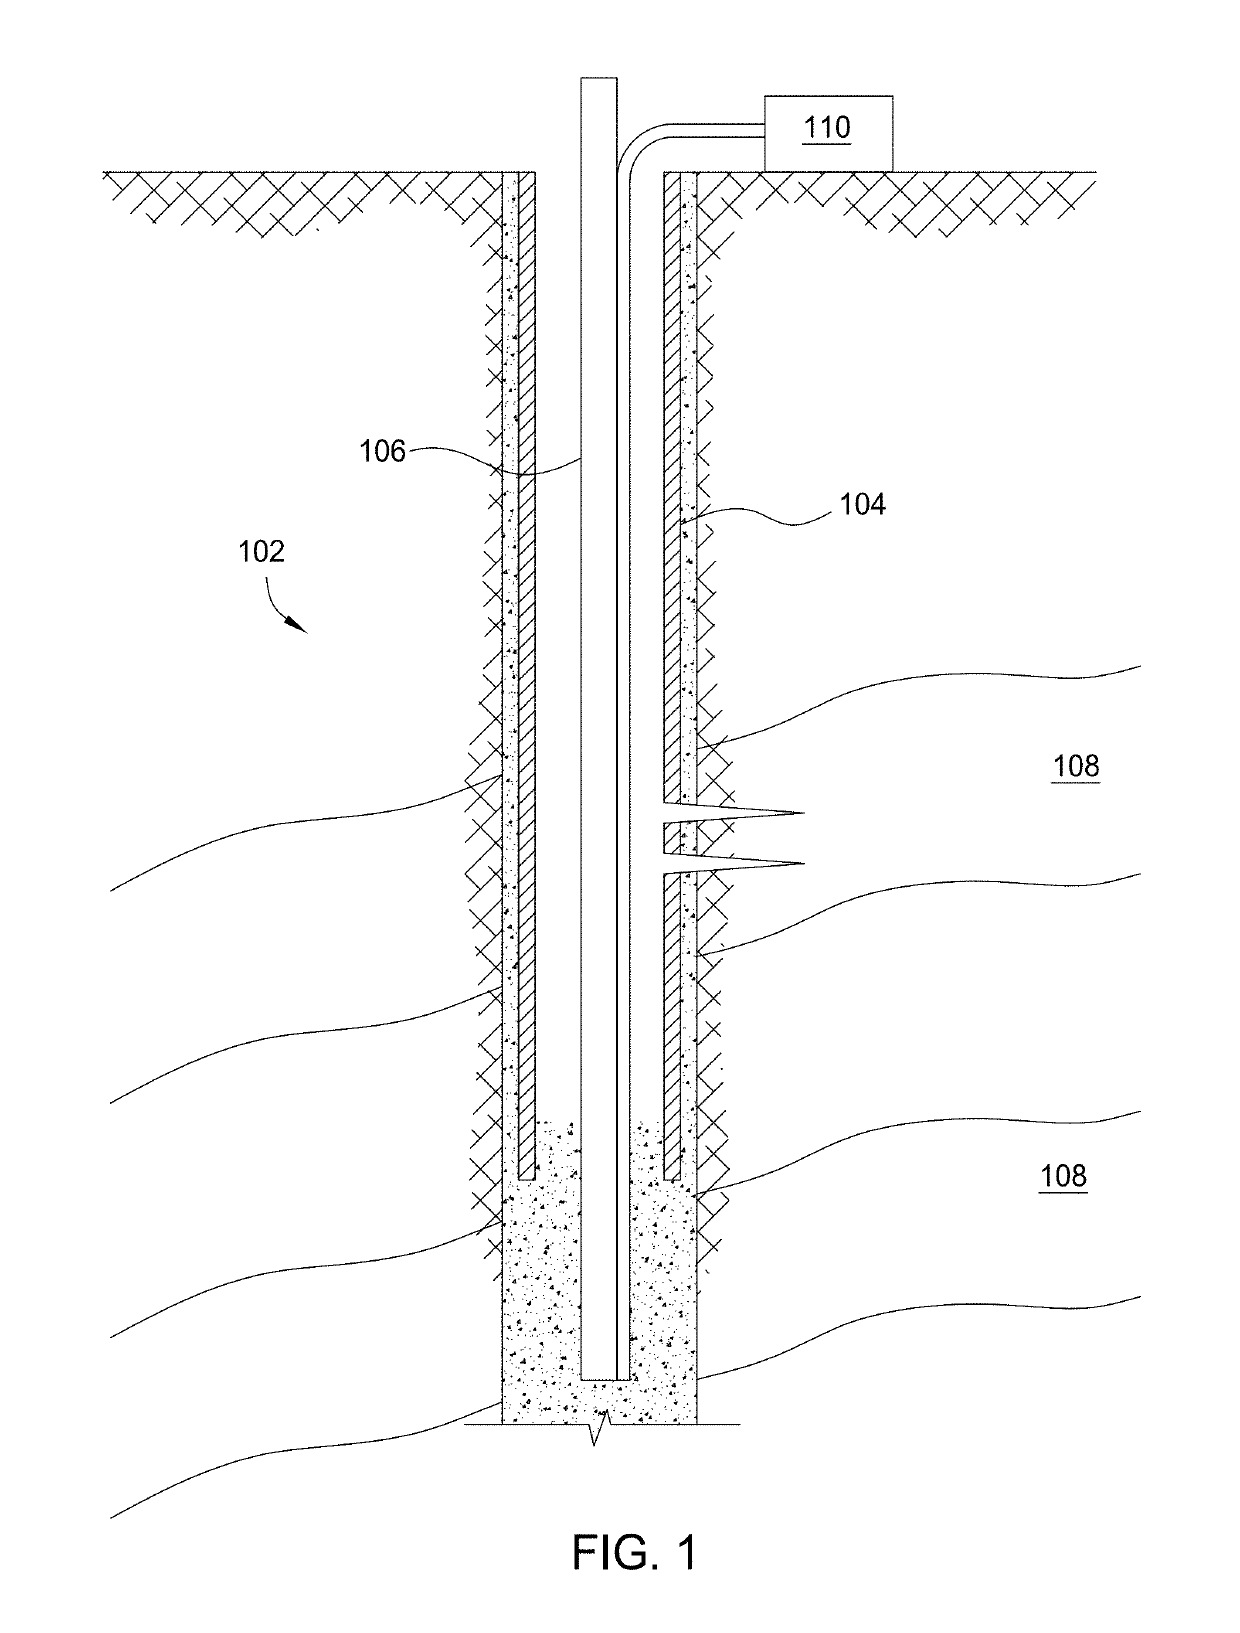
[0018]Data collected during reservoir monitoring may include fiber optic measurements utilizing a distributed sensing system, such as distributed temperature sensing (DTS) or distributed acoustic sensing (DAS). DTS may be based on distributed temperature derived from Raman back-scattered light from the sensor. DAS may be based on Coherent Optical time delay reflectometry (COTDR). Downhole monitoring with the distributed sensing system may generate large amounts of data, depending on the time interval and frequency of data measurements. Integrated sensing systems like distributed temperature and acoustic sensing (DTS and DAS) may also generate large data. For example, DAS data, when gathered at high frequency may generate in the order of 200 GB in a single day. As another example, distributed temperature measured along the length of the wellbore every minute, would generate 1,440 temperature profiles (24 hours×60 minutes=1,440 profiles), where each profile includes tens, hundreds, or...


PUM


Abstract

Data collected during reservoir monitoring may include fiber optic measurements utilizing a distributed sensing system. Downhole monitoring with the distributed sensing system may generate large amounts of data. For example, the system may be capable of producing the functional equivalent of tens, hundreds, or even thousands of sensors along a length of a wellbore. Continuous monitoring of various properties, including temperature, pressure, Bragg gradient, acoustic, and strain, may create a large volume of data, possibly spanning into several gigabytes. Embodiments of the present invention provide techniques for analyzing a large volume of measurements taken in a wellbore without compromising on the integrity of data.

Description

BACKGROUND OF THE INVENTION[0001]Field of the Invention[0002]Embodiments of the present invention generally relate to methods and apparatus for analyzing measurements taken in a wellbore. In particular, embodiments of the present invention generally relate to methods and apparatus for visually analyzing measurements taken in a well during its life cycle until abandonement.[0003]Description of the Related Art[0004]Various reservoir monitoring systems have been used to measure important properties such as pressure, temperature, acoustic, strain, and Bragg gradient along the wellbore. Formation properties at downhole subsurface conditions, like porosity, permeability, density, mineral content, electrical conductivity, and bed thickness, and computed fluid properties such as viscosity, chemical elements, and the content of oil, water, and / or gas are essential. Monitoring such properties and conditions, either instantaneously or by determining trends over time, may have significant value...

Claims


Application Information

Patent Timeline
Patent Type & Authority Patents(United States)
IPC IPC(8): G06F17/00G06F17/21G06T11/20G06T19/00G01V1/34
CPCG06F17/217G06T11/206G06T19/00G01V1/345G06F40/114
Inventor GUNTURU, SASHI B.
Owner SRISTY TECH
Why Eureka
Try Eureka