
Accessing data in a multi-level display for large data sets

a multi-level display and data technology, applied in the field can solve the problems of large data sets, time-consuming and time-consuming processes, and inability to analyze information and present information to users in a way that enables interpretation, so as to facilitate the access of large data sets and facilitate the use of large data sets.

Active Publication Date: 2021-11-23
IBM CORP
View PDF19 Cites 1 Cited by
  • Summary
  • Abstract
  • Description
  • Claims
  • Application Information

AI Technical Summary

Benefits of technology

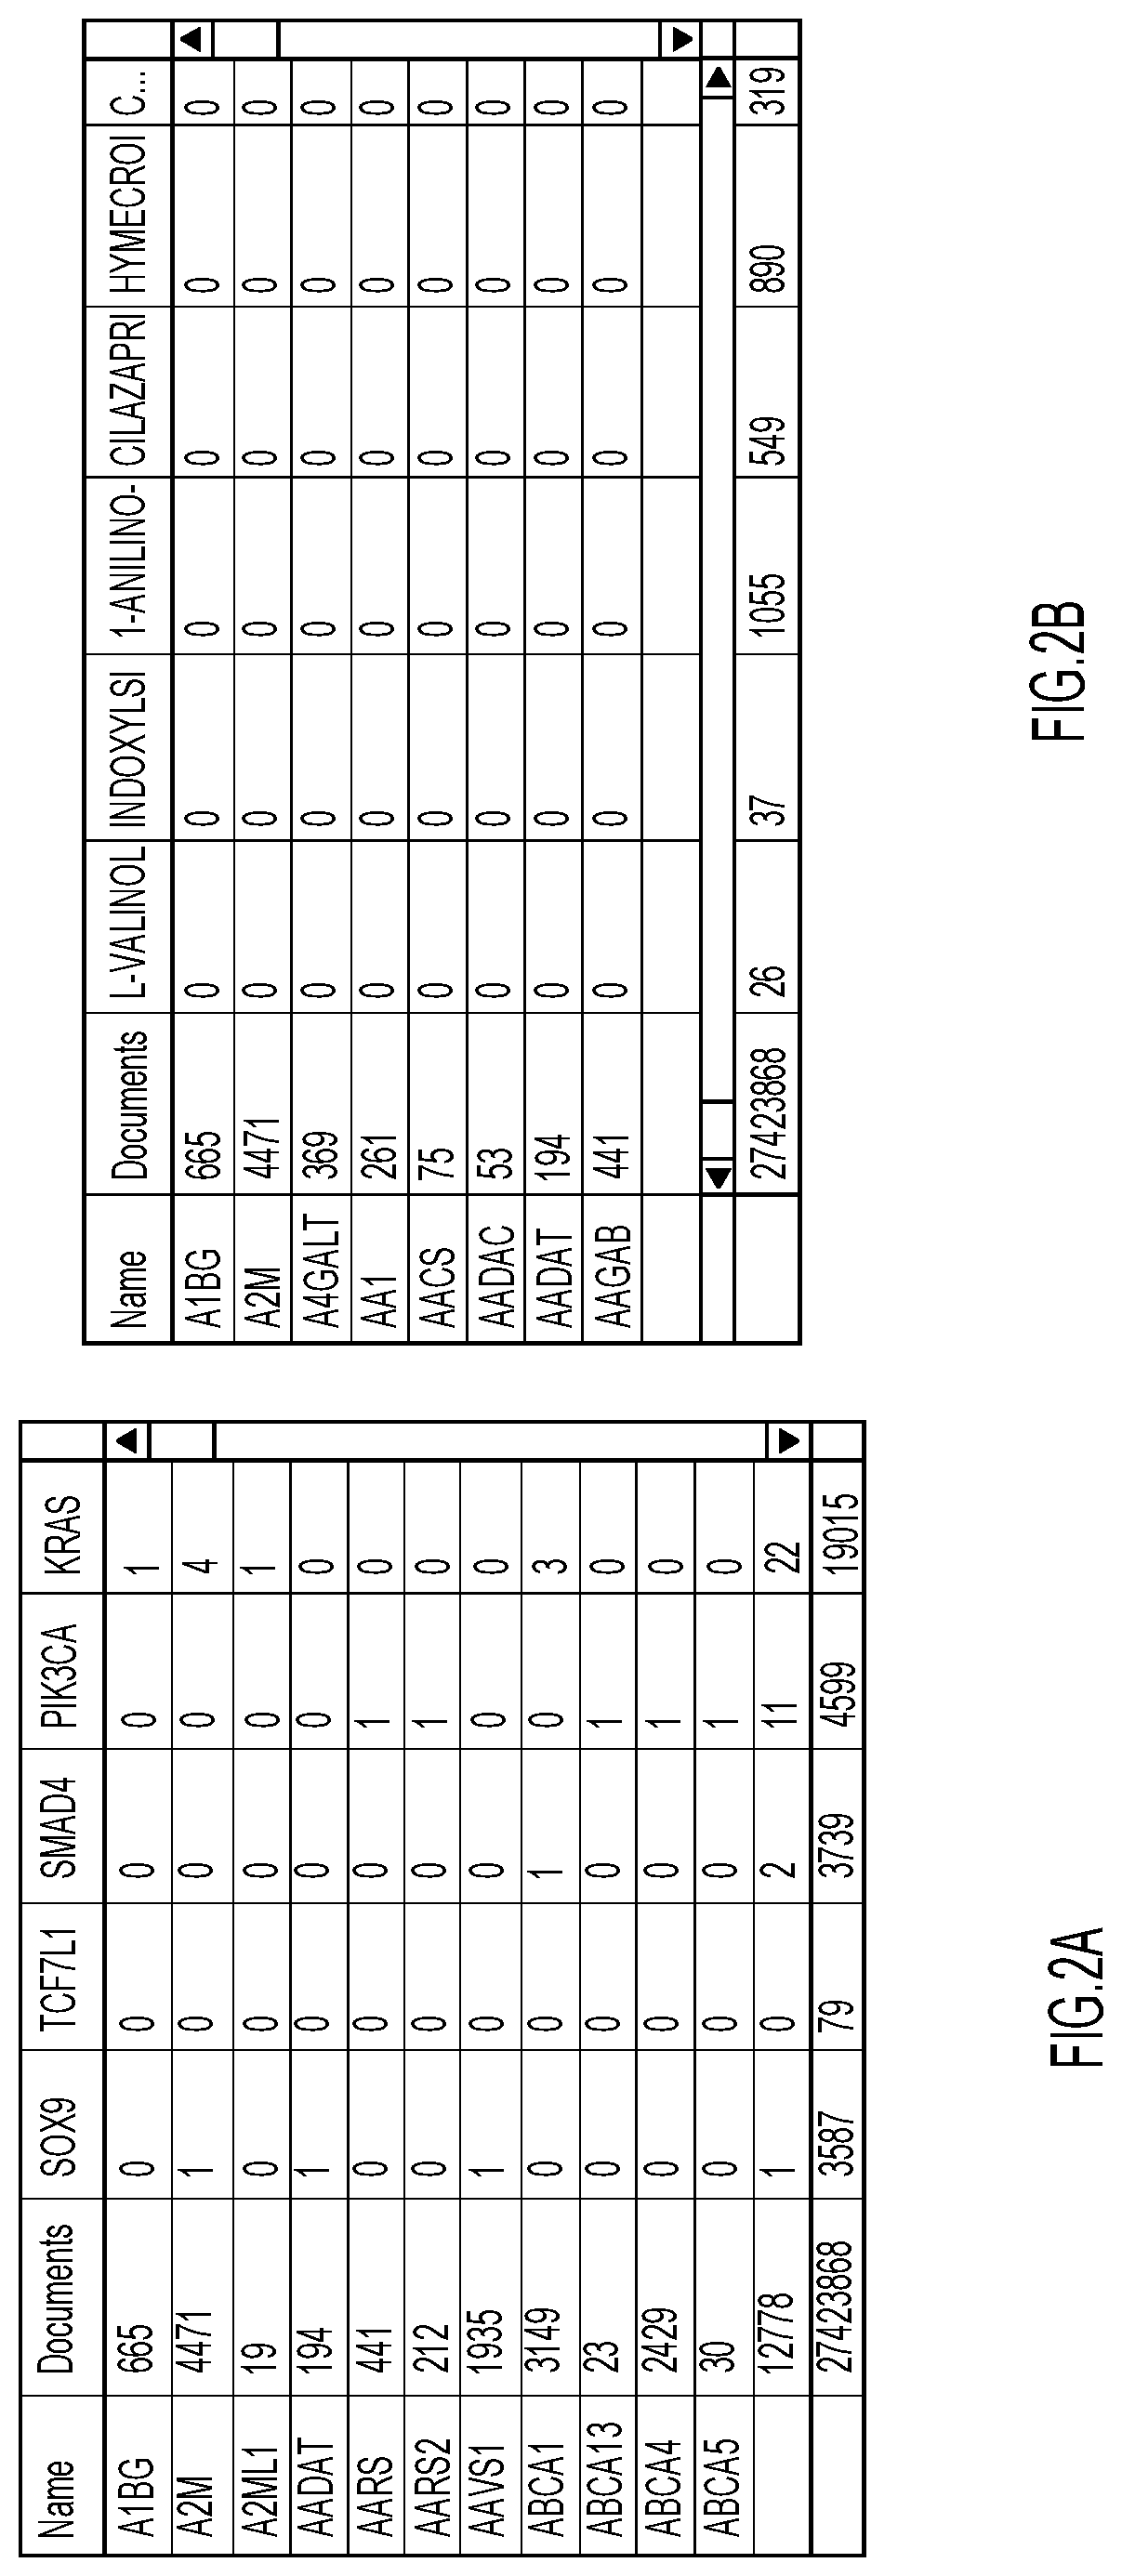
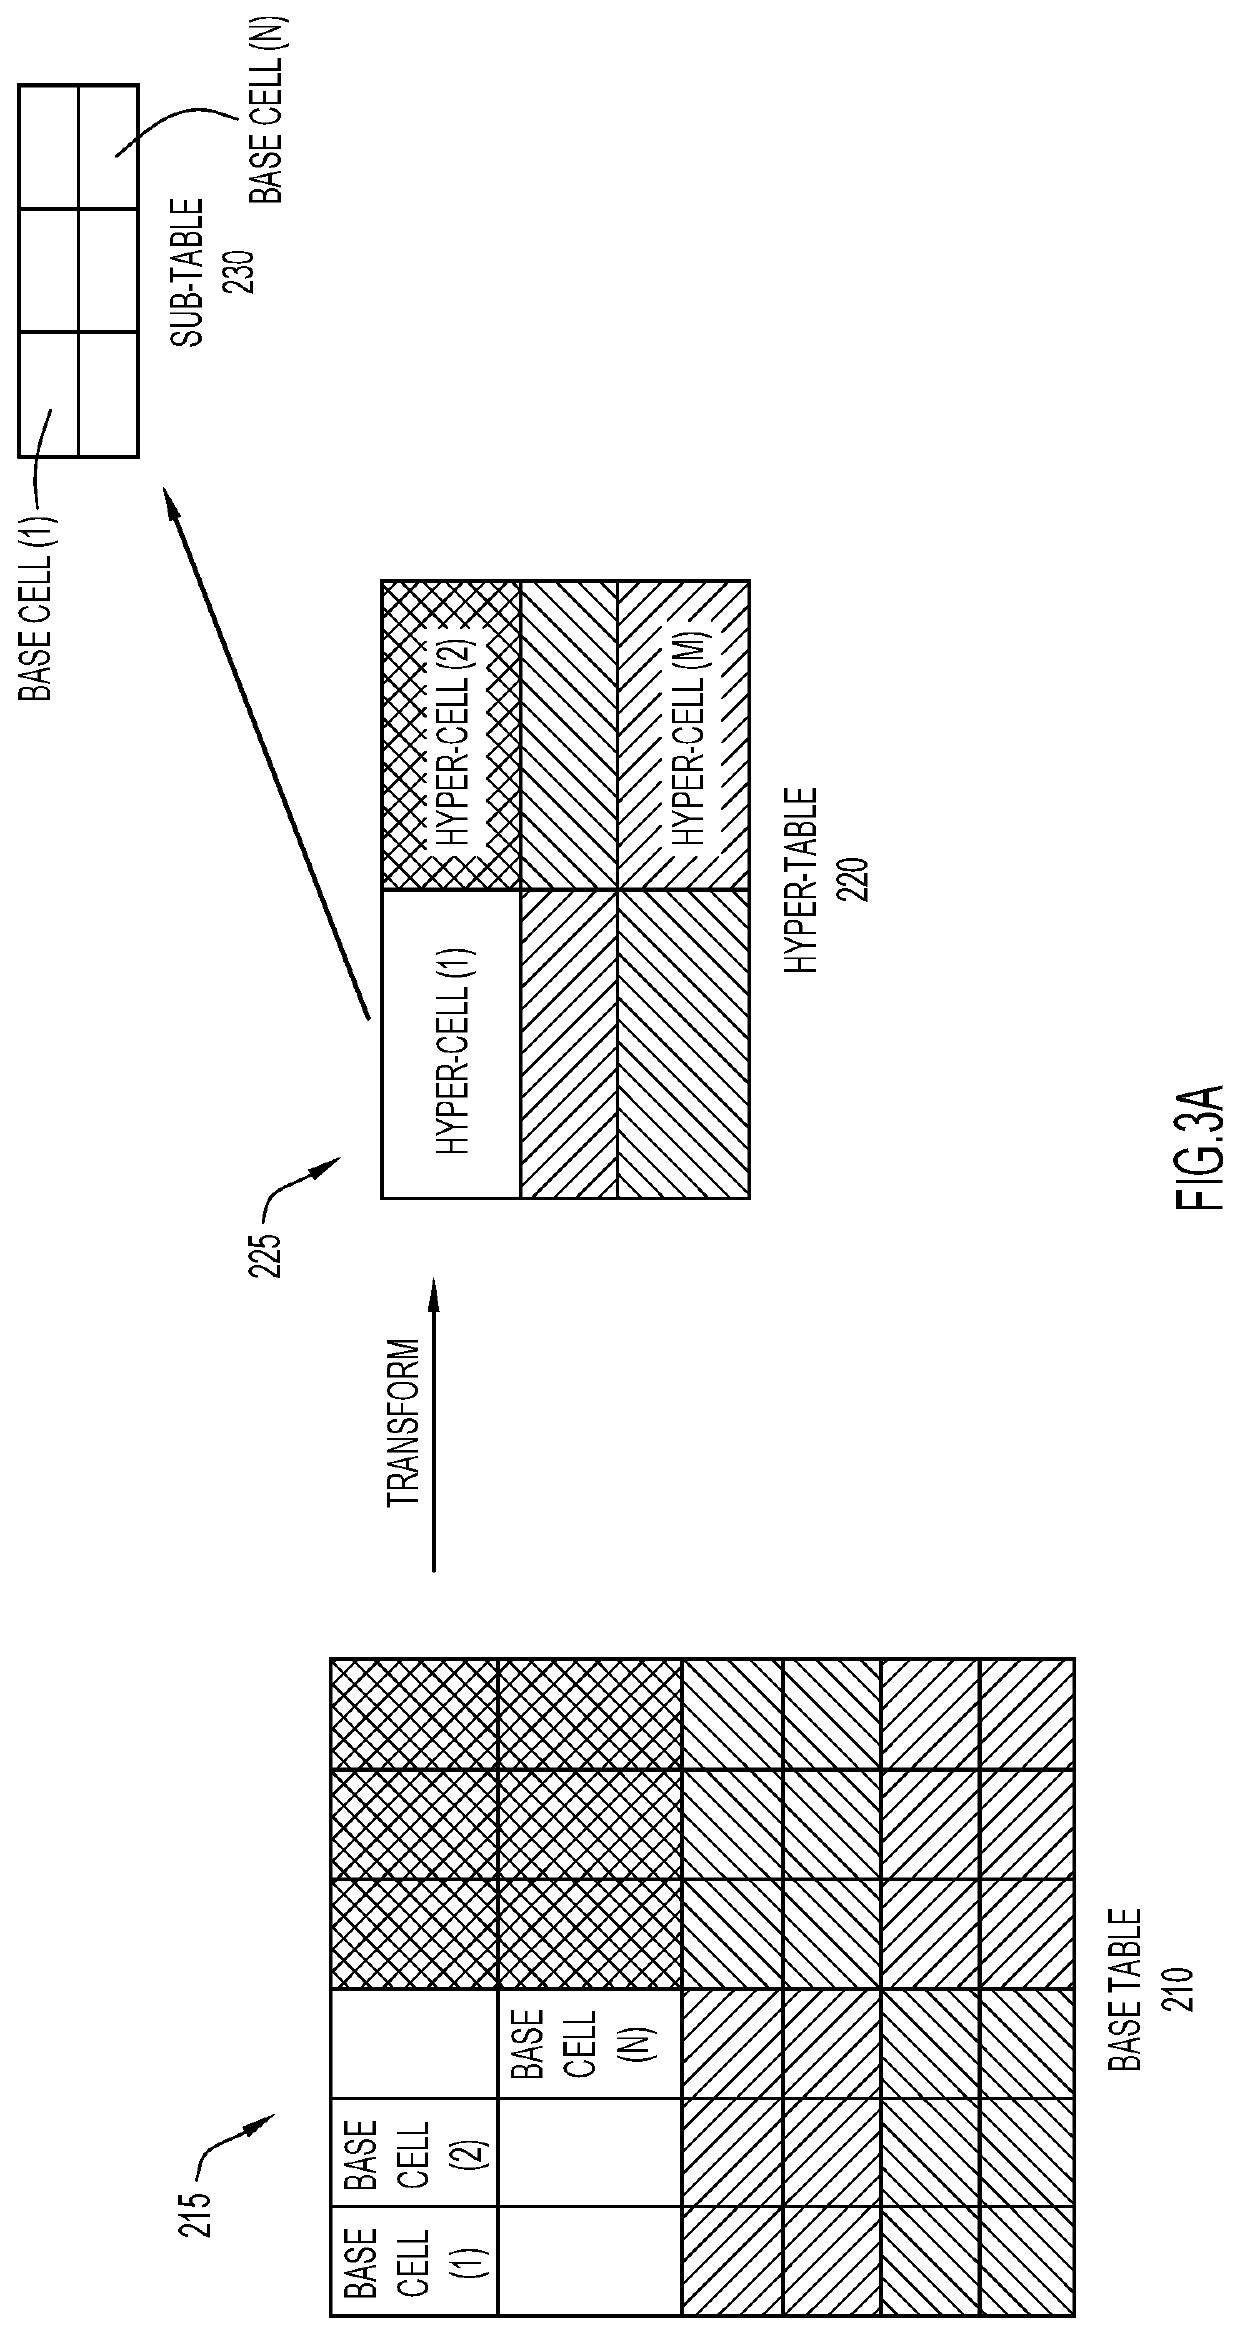
[0007]The multi-level tables as provided herein allow for characterization of large sets of data in a concise, accessible format. Rather than scrolling though large spreadsheets with millions of cell entries to identify relevant data, the characteristics of the data set are summarized at multiple levels (e.g., intermediate levels and terminal levels) of the multi-level table. By using a hyper-table comprising groups of cells (hyper-cells), the bulk characteristics of the data set are captured in a compact, accessible format. For example, hyper-cells at the top level of a multi-level table may have a value of ‘0’ indicating that the underlying data, linked through one or more levels of the hyper-table, do not have substantial correlations. These hyper-cells would not need to be further reviewed by a user. In other optional aspects, each hyper-table of the first and intermediate levels of the multi-level table includes a desired size less than a size of the initial base table and each table of the terminal level includes a size less than the size of a linked hyper-table of the prior level. Accordingly, the size of the table of the first level and intermediate levels may be a fraction of the size of the original base table, greatly improving accessibility of the data.
[0011]For two entities having a high correlation, the hyper-cell comprising these two entities may also have a large value, indicating that the underlying data has a high correlation. Thus, a user would not need to review the entire table in order to locate data of interest.
[0012]Grouping techniques are presented which improve the characteristics of the data at the top level. For example, ordering cells of the base table to ensure that cells having high correlations are adjacent to each other ensures that the corresponding hyper-cell value will be higher than groups of cells without high correlations.
[0020]According to aspects of the present invention, large data sets may be combined according to various techniques, e.g., co-occurrence frequency sorting, ontology, similarity, etc. or any combination thereof, to facilitate access of the large data set to a user. Using multi-level tables, the entire large data set becomes accessible by a user, and in some cases, novel relationships between entities may be discovered. Present techniques provide for efficient access and display of the large data set, such that a user can access pertinent data and identify relationships among entities without parsing through the entire large data set, which may be millions of entries or more. By grouping entities based on various techniques, relationships between groups of data may be revealed, e.g., relationships that would not be apparent from reviewing the data set presented as a base table (in an ungrouped format).
[0021]The relationship between the data of the base table and the grouped data of the multi-level table is maintained, so that the user can reversibly expand or contract access and display of the grouped data, e.g., to expand hyper-cells into underlying grouped data, or vice-versa. The underlying characteristics of the data are preserved, so that the user may access ungrouped data by navigating through the one or more levels of the multi-level table.
[0023]Accordingly, multi-level tables provide a variety of advantages, including: characterizing a large set of data at a top level in an accessible, compact form; uncovering novel relationships between categories of entities; and uncovering novel relationships between entities.

Problems solved by technology

While numerous types of systems are able to ingest large data sets, analyzing the information and presenting the information to the user in a way that enables interpretation is difficult.
If a system returns a data set of a thousand or a million entries, this data set is too large and cumbersome for a user to interpret.
Accordingly, to identify high frequency correlations within a large table, a user needs to review the entire table, a process that is both error prone and time consuming.

Method used


Image

  • Accessing data in a multi-level display for large data sets
  • Accessing data in a multi-level display for large data sets
  • Accessing data in a multi-level display for large data sets

Examples


Embodiment Construction

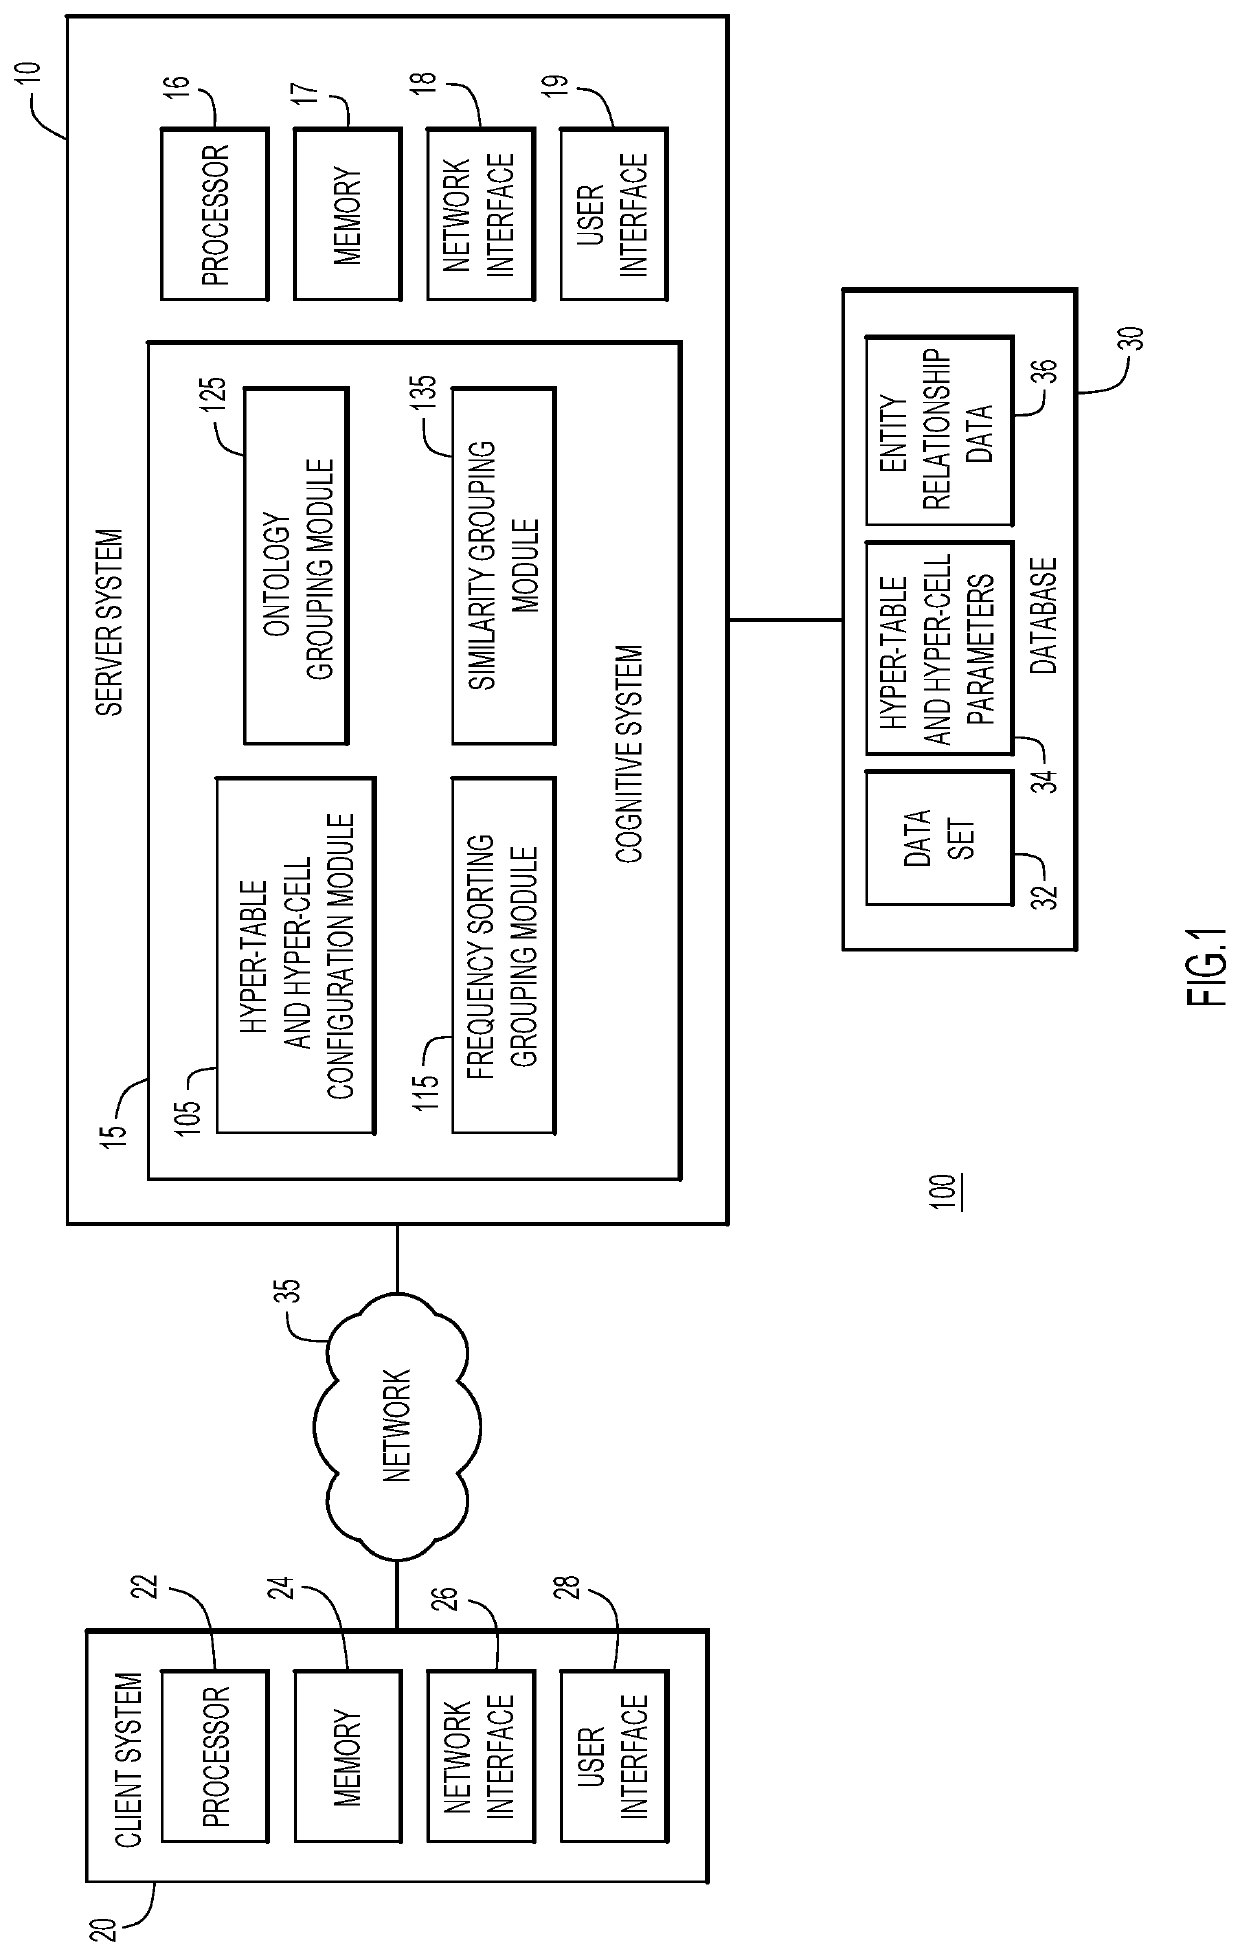
[0035]Accessing data in large data sets is difficult, time-consuming, and error prone. Accordingly, the problem to be solved may be characterized as accessibility and analysis of large sets of data. Thus, the multi-level tables of embodiments of the present invention provide a variety of technical features allowing for representation and characterization of large sets of data in a concise, accessible format.

[0036]Technical features include efficiently accessing specific information in a large data set without traversing through the entire table. The characteristics of the data are summarized at multiple levels (top and intermediate) of the multi-level table. For example, for numerical data, groups of cells (hyper-cells) may represent the summation, average, median or any other suitable parameter which corresponds to the bulk characteristics of the corresponding group of cells. In some aspects, a hyper-cell is a transformation of the underlying data of a group of base cells to genera...


PUM


Abstract

Methods, systems and computer readable media are provided for accessing data utilizing a multi-level table comprising generating a plurality of levels of the multi-level table, wherein a first level of the multi-level table includes a hyper-table with a plurality of hyper-cells each hyper-cell including information for a group of cells from an initial base table, wherein intermediate levels of the multi-level table each include a plurality of hyper-tables comprising hyper-cells with each hyper-table linked to and providing information for a corresponding hyper-cell of a hyper-table of a prior level, and wherein a plurality of tables of a terminal level includes information from cells of the initial base table with each table linked to and providing information for a corresponding hyper-cell. Data from the multi-level table is accessed by traversing links between the hyper-tables of the plurality of levels to access data within the tables of the terminal level.

Description

BACKGROUND1. Technical Field[0001]Present invention embodiments relate to accessing large sets of data, and more specifically, to generating multi-level tables to facilitate access and interpretation of large data sets.2. Discussion of the Related Art[0002]In recent years, advances in computing and artificial intelligence have enabled routine ingestion of large data sets. While numerous types of systems are able to ingest large data sets, analyzing the information and presenting the information to the user in a way that enables interpretation is difficult.[0003]If a system returns a data set of a thousand or a million entries, this data set is too large and cumbersome for a user to interpret. For example, a table with a thousand rows and a thousand columns leads to generation of a table with a million cells. Limiting the number of rows or columns to a smaller value, such as one hundred rows and one hundred columns still leads to a table with a thousand entries that is too large for ...

Claims


Application Information

Patent Timeline
Patent Type & Authority Patents(United States)
IPC IPC(8): G06F16/22G06F16/23G06F40/18
CPCG06F16/2282G06F16/2264G06F16/2379G06F40/18G06F16/283
Inventor GAO, XIAOYANGSPANGLER, WILLIAM SCOTTBAO, SHENG HUAHAN, YANYANDREHER, BRIAN S.
Owner IBM CORP
Learn More