System and method for digital image tone mapping using an adaptive sigmoidal function based on perceptual preference guidelines

a digital image and tone mapping technology, applied in the field of digital image tone mapping algorithms, can solve the problems of limiting the amount of gray level adjustments allowed in the tone mapping, images that are often unnatural, and cannot be calculated

Inactive Publication Date: 2002-11-21
AVAGO TECH WIRELESS IP SINGAPORE PTE
View PDF10 Cites 114 Cited by
  • Summary
  • Abstract
  • Description
  • Claims
  • Application Information

AI Technical Summary

Problems solved by technology

However, in low cost cameras, such calculations are often not available due to the added complexity and cost.
The method does well on images that have a symmetric and well-distributed histogram, but makes images look unnatural when there are large areas of dark or light background in the image, which bias the histogram toward one side.
Larson's method limits the amount of gray level adjustments allowed in the tone mapping.
The amount of gray level adjustments are limited based on luminance contrast sensitivity measurements.
However, the computation is iterative, and thus the implementation is costly and slow.
Thus, although this modified histogram equalization method creates a more accurate appearance match, it does so at the cost of higher computational complexity.
Although these algorithms do preserve the local contrast of images, they are iterative methods that also involve the decomposition of different spatial resolution components of an image, which is computationally costly.

Method used


Image

  • System and method for digital image tone mapping using an adaptive sigmoidal function based on perceptual preference guidelines
  • System and method for digital image tone mapping using an adaptive sigmoidal function based on perceptual preference guidelines
  • System and method for digital image tone mapping using an adaptive sigmoidal function based on perceptual preference guidelines

Examples


first embodiment

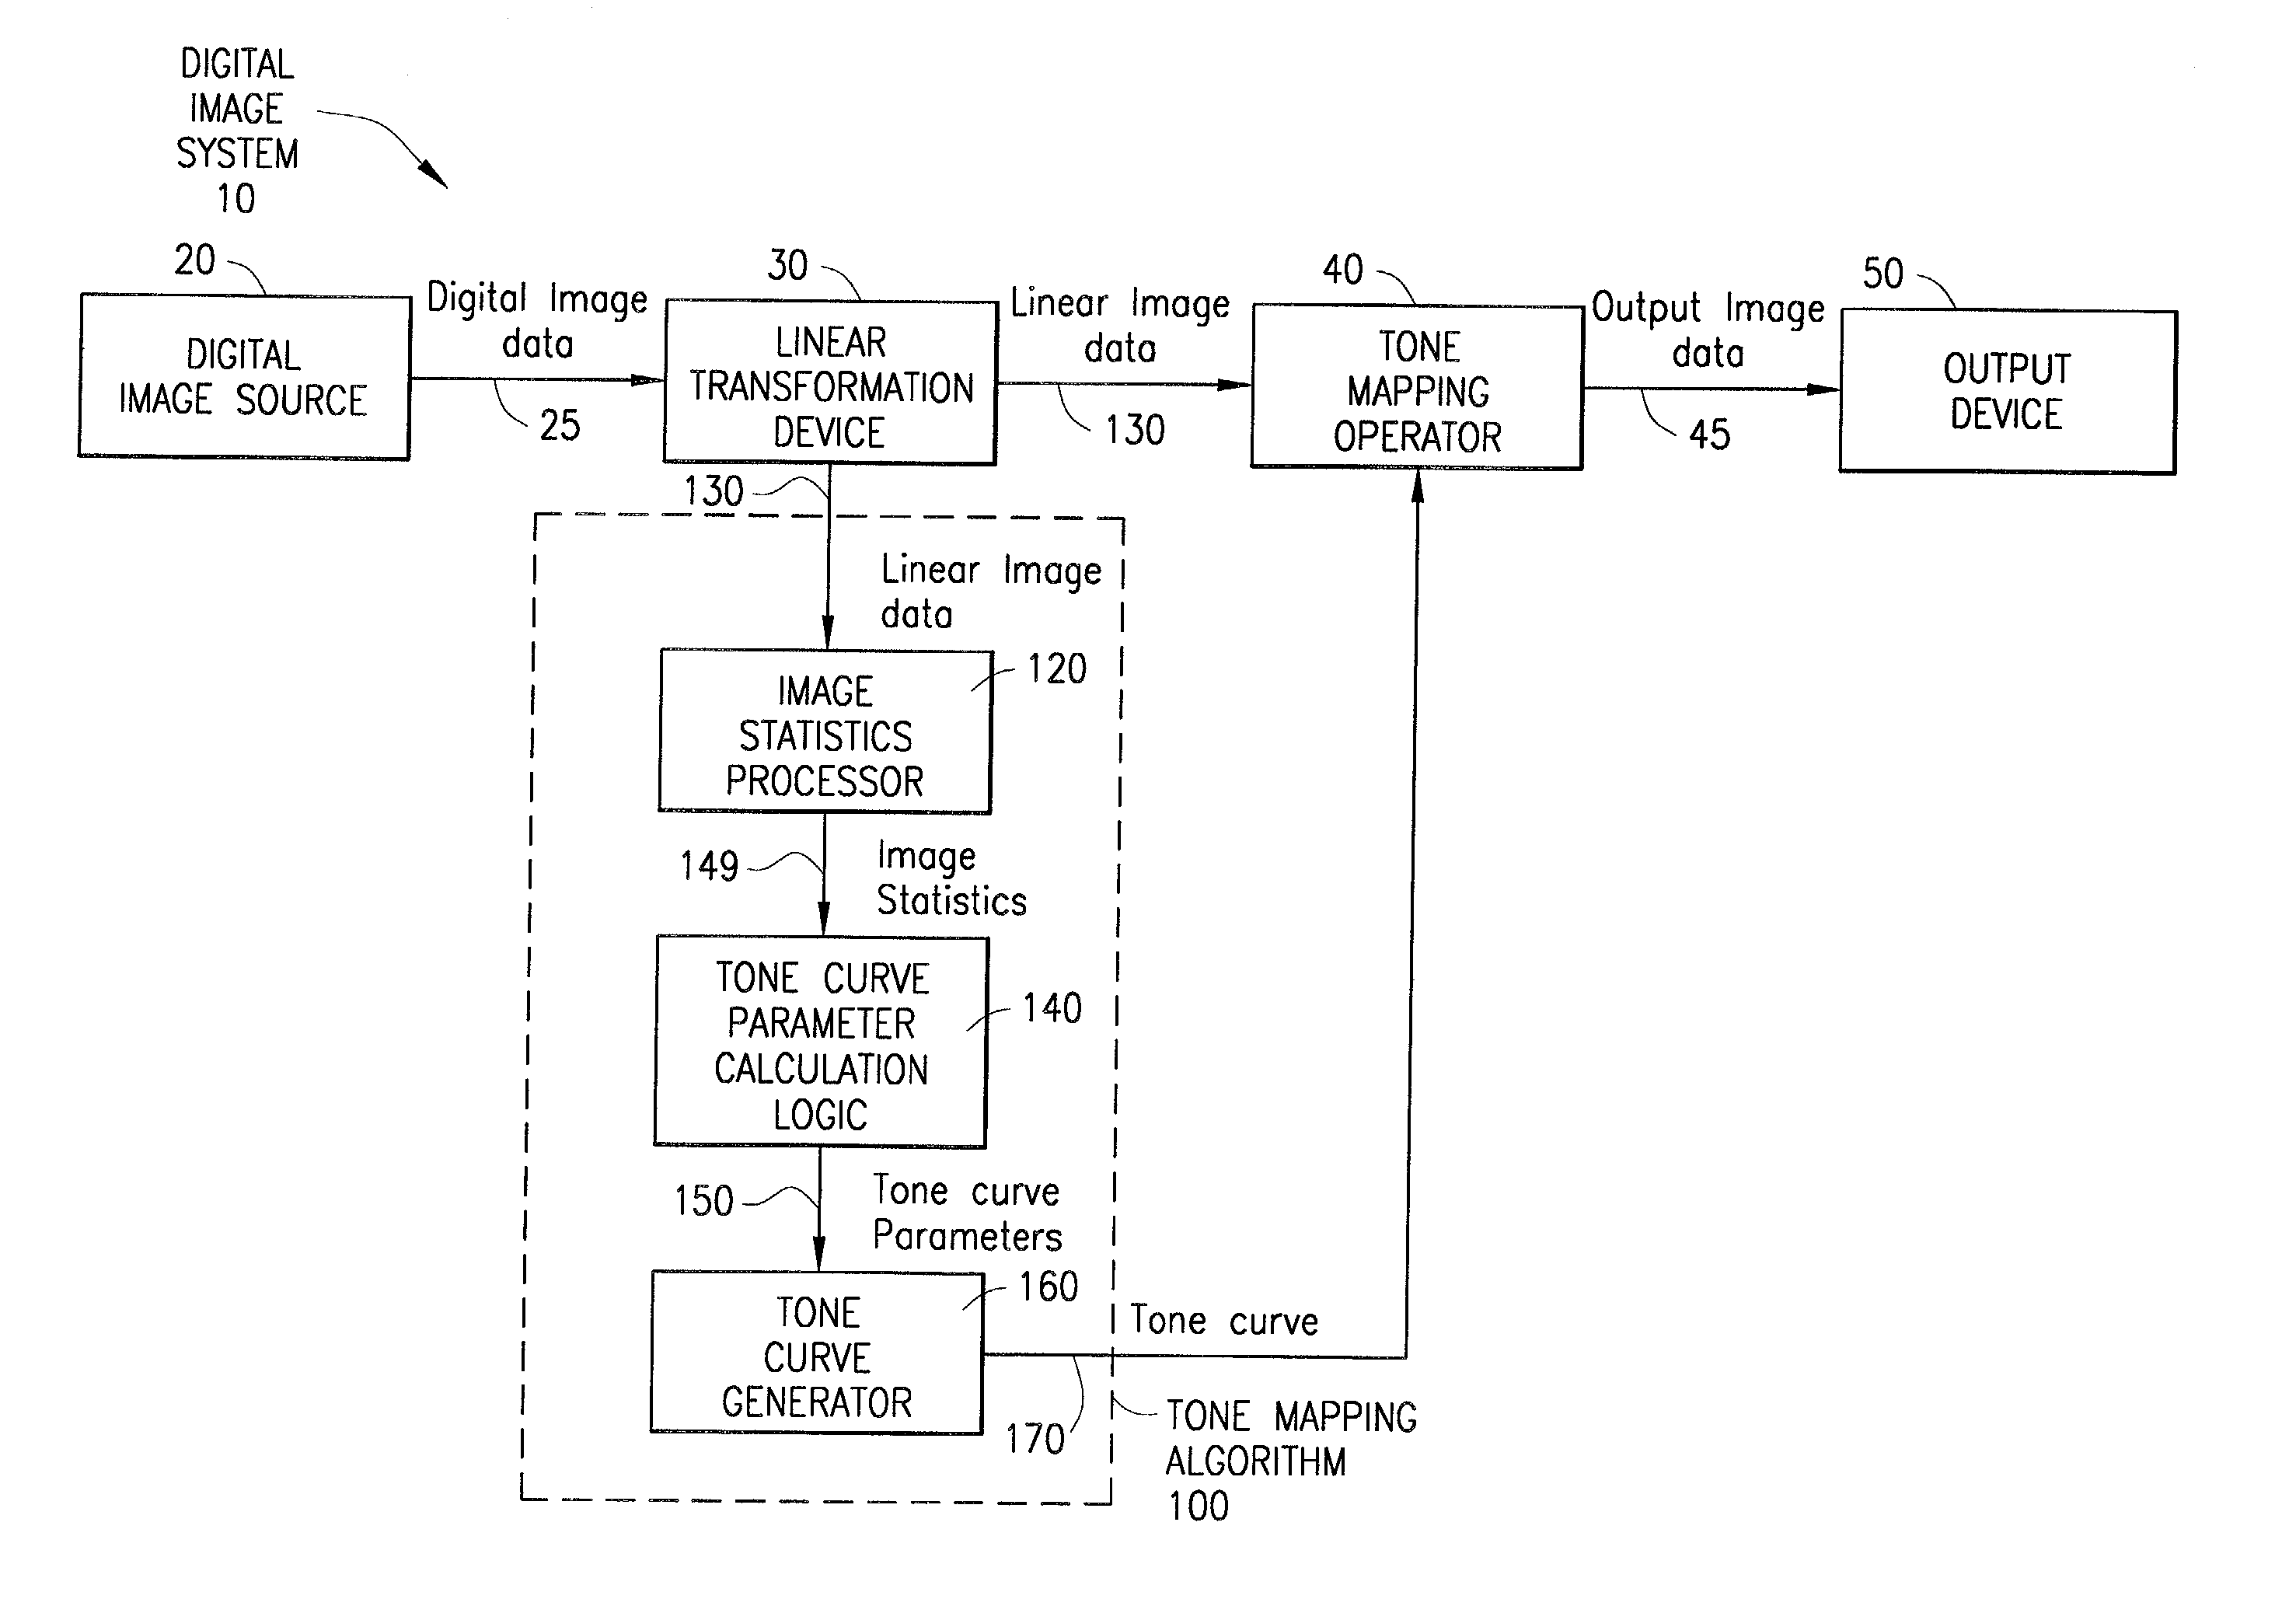
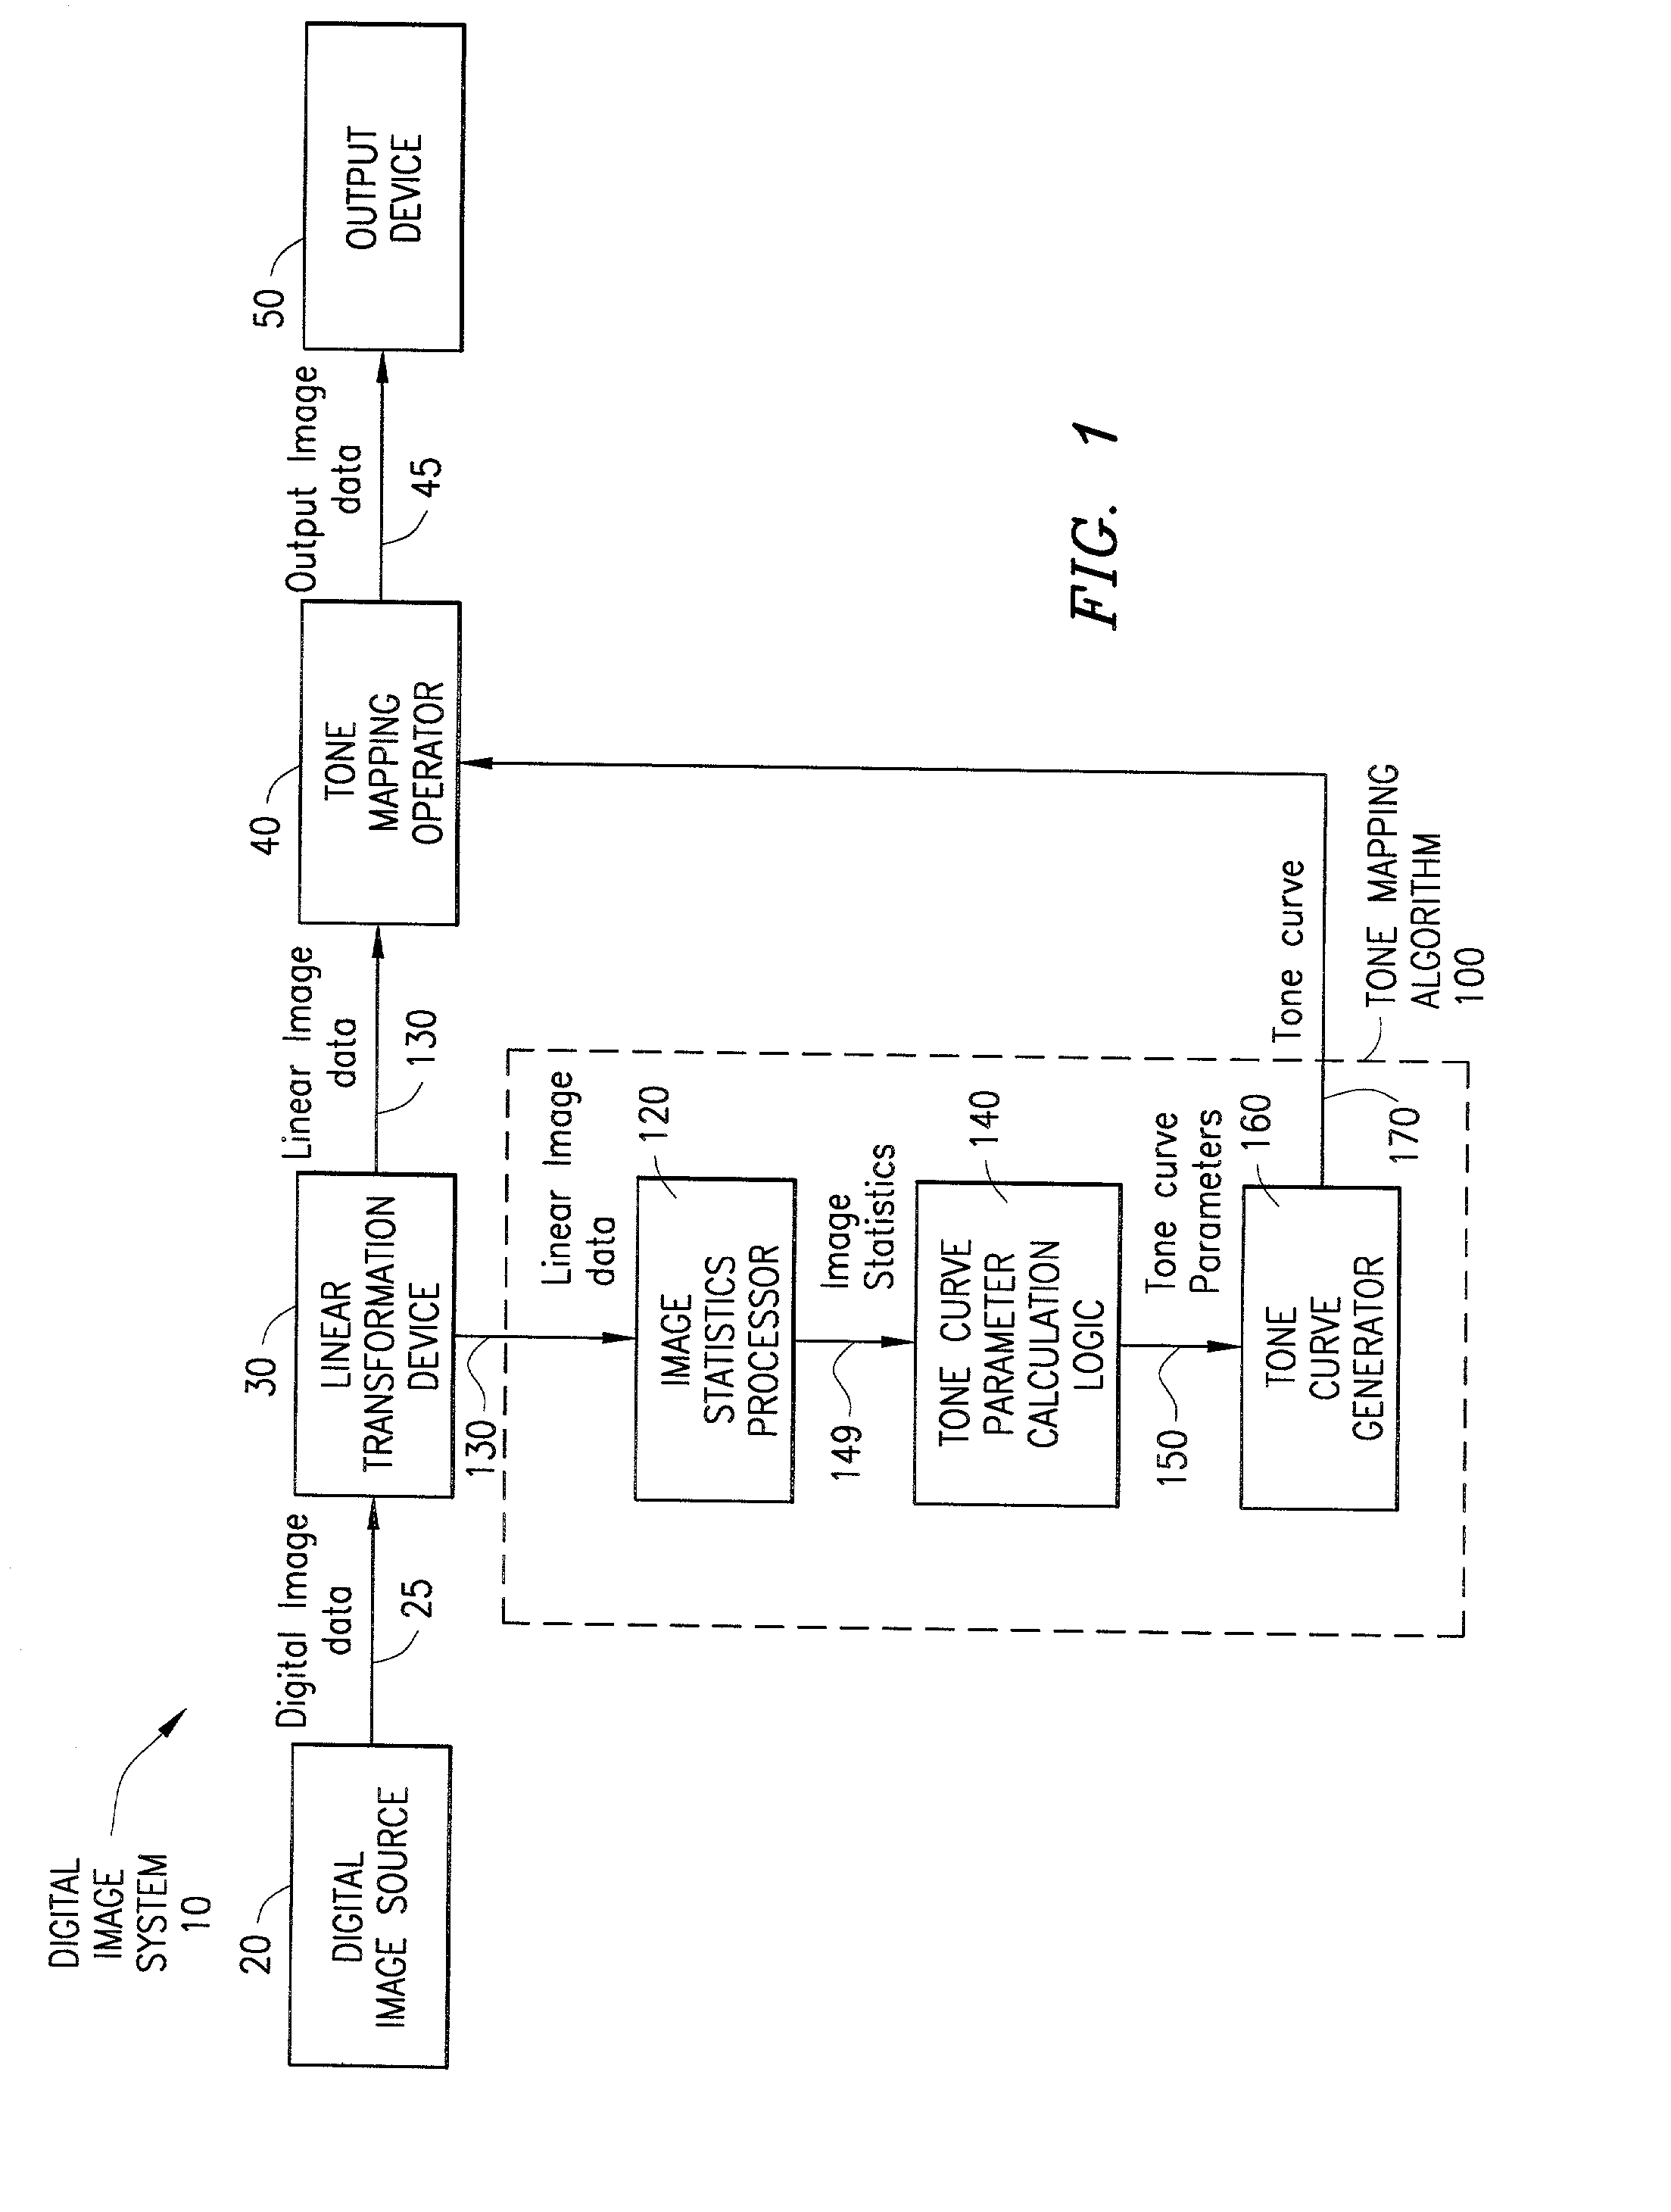
[0039] With reference now to FIGS. 3A-3C of the drawings and the corresponding flow charts of FIGS. 4A-4C, alternative embodiments for implementing the image statistics processor of FIG. 1 are illustrated. In a first embodiment, as shown in FIG. 3A and described in FIG. 4A, the linear image data 130 (step 400) is passed to a histogram generator 122, which produces a histogram 145 (e.g., a table) describing the distribution of the digital values of the data 130 (step 405). For example, in a color digital image, there are a certain number of red, blue and green values (e.g., one of each for each pixel in the image). In order to produce a histogram of green values, for example, the histogram generator 122 determines a bin size (e.g., range of values, such as 0-10, 11-20, 21-30, etc.) and counts the number of occurrences of green pixel values in each bin. To create a graphical representation of the histogram, the data in each bin is plotted as a function of the bin centers (e.g., 5, 15,...

second embodiment

[0057] In a second embodiment, shown in FIG. 6B, the shift parameter .beta. is calculated based on the L* percentile values. Various studies (see, e.g., Tanaka et al., 1997) have suggested that observers preferred renderings that have as large an output gamut as possible. Therefore, to accommodate these preferences, the shift parameter can be determined by shifting the histogram to make it occupy as much of the output device dynamic range as possible, while bringing as little disturbance to the shape of the histogram as possible to avoid saturation of a lot of points at either end of the distribution. This is done by using a centering function in which the tone curve is centered at midway between the end points of the histogram. This is a conservative choice, typically resulting in only small changes to the mean luminance of the image if the original RGB histogram is somewhat "normal" (values are not concentrated on a small section of the full range).

[0058] Therefore, when the tone ...


PUM


Abstract

An adaptive image tone mapping curve based on perceptual preference guidelines is generated as a sigmoidal function, in which the sigmoidal function parameters (slope and shift) are determined by original image statistics. Tone curves generated for different images each have a smooth sigmoidal shape, so that the tone mapping process does not change the image histogram shape drastically. The sigmoidal function has the form: <math-cwu id="MATH-US-00001"> <number>1< / number> t it ( x ) = 100 1 + exp it ( - alpha it ( x / 100 - beta ) ) , <mathematica-file id="MATHEMATICA-00001" file="US20020171852A1-20021121-M00001.NB" / > <image id="EMI-M00001" wi="216.027" he="18.96615" file="US20020171852A1-20021121-M00001.TIF" imf="TIFF" ti="MF" / > < / math-cwu> where alpha is the slope parameter and beta is the shift parameter. The input value x in the sigmoidal function varies in the range [0, 100], because the tone curve is generated on an L* scale, which has values from 0 to 100. The sigmoidal tone curve calculation can be implemented efficiently using simple arithmetic operations by pre-calculating and storing various factors used in the calculation of alpha and beta and by pre-generating a pair of fixed tone curves with two extreme slopes and interpolating between the curves.

Description

[0001] 1. Field of the Invention[0002] The present invention relates generally to digital image tone mapping algorithms, and specifically to digital image tone mapping algorithms based on perceptual preference guidelines.[0003] 2. Description of Related Art[0004] Digital image tone mapping refers to the process of mapping captured scene luminance levels to the luminance or density levels of an output device (display or printer). Digital image tone mapping is necessary due to the fact that scene luminance ranges very seldom match the luminance range of the output device. Digital image tone mapping algorithms can be implemented within any digital device to produce visually pleasing output images. For example, such devices can include digital cameras, scanners, digital camcorders, printers capable of printing digital images and digital televisions. In addition, digital tone mapping algorithms are frequently used in image enhancement software applications.[0005] Since the human eye adap...

Claims


Application Information

Patent Timeline
Patent Type & Authority Applications(United States)
IPC IPC(8): G06T1/20G06T5/40H04N1/407H04N1/46H04N1/60G06T5/00
CPCG06T5/009H04N1/4074G06T5/40
Inventor ZHANG, XUEMEIJONES, ROBERT W.BAHARAV, IZHAKREID, DONALD M.
Owner AVAGO TECH WIRELESS IP SINGAPORE PTE
Why Eureka
Try Eureka