Method and system of cost variance analysis

a cost variance and analysis method technology, applied in the field of accounting methods, can solve the problems of no one in the organization can easily say what the size is, and the rum model remained ignored and unused in general practice, and no one in the organization can easily say what the volume of the activity is

Inactive Publication Date: 2005-08-04
UNIVERSITY OF OTTAWA
View PDF5 Cites 104 Cited by
  • Summary
  • Abstract
  • Description
  • Claims
  • Application Information

AI Technical Summary

Benefits of technology

[0025] 4. the use of sparse matrix techniques, permits large empty blocks

Problems solved by technology

Attention is paid to the detailed structure of each activity, and to the “cost drivers” that lead to higher or lower volume and cost for the activity.
After its 1982 publication, the Broyles and Lay p′RUm model remained ignored and unused in general practice because of a lack of sufficient computing power, and lack of motivation arising from not-yet-felt pressures for productivity and cost reduction.
No one in the organization can easily say what the si

Method used


Image

  • Method and system of cost variance analysis
  • Method and system of cost variance analysis
  • Method and system of cost variance analysis

Examples


example 1

Attributing Cost Variance to a Product or Product-Group within a Product Mix

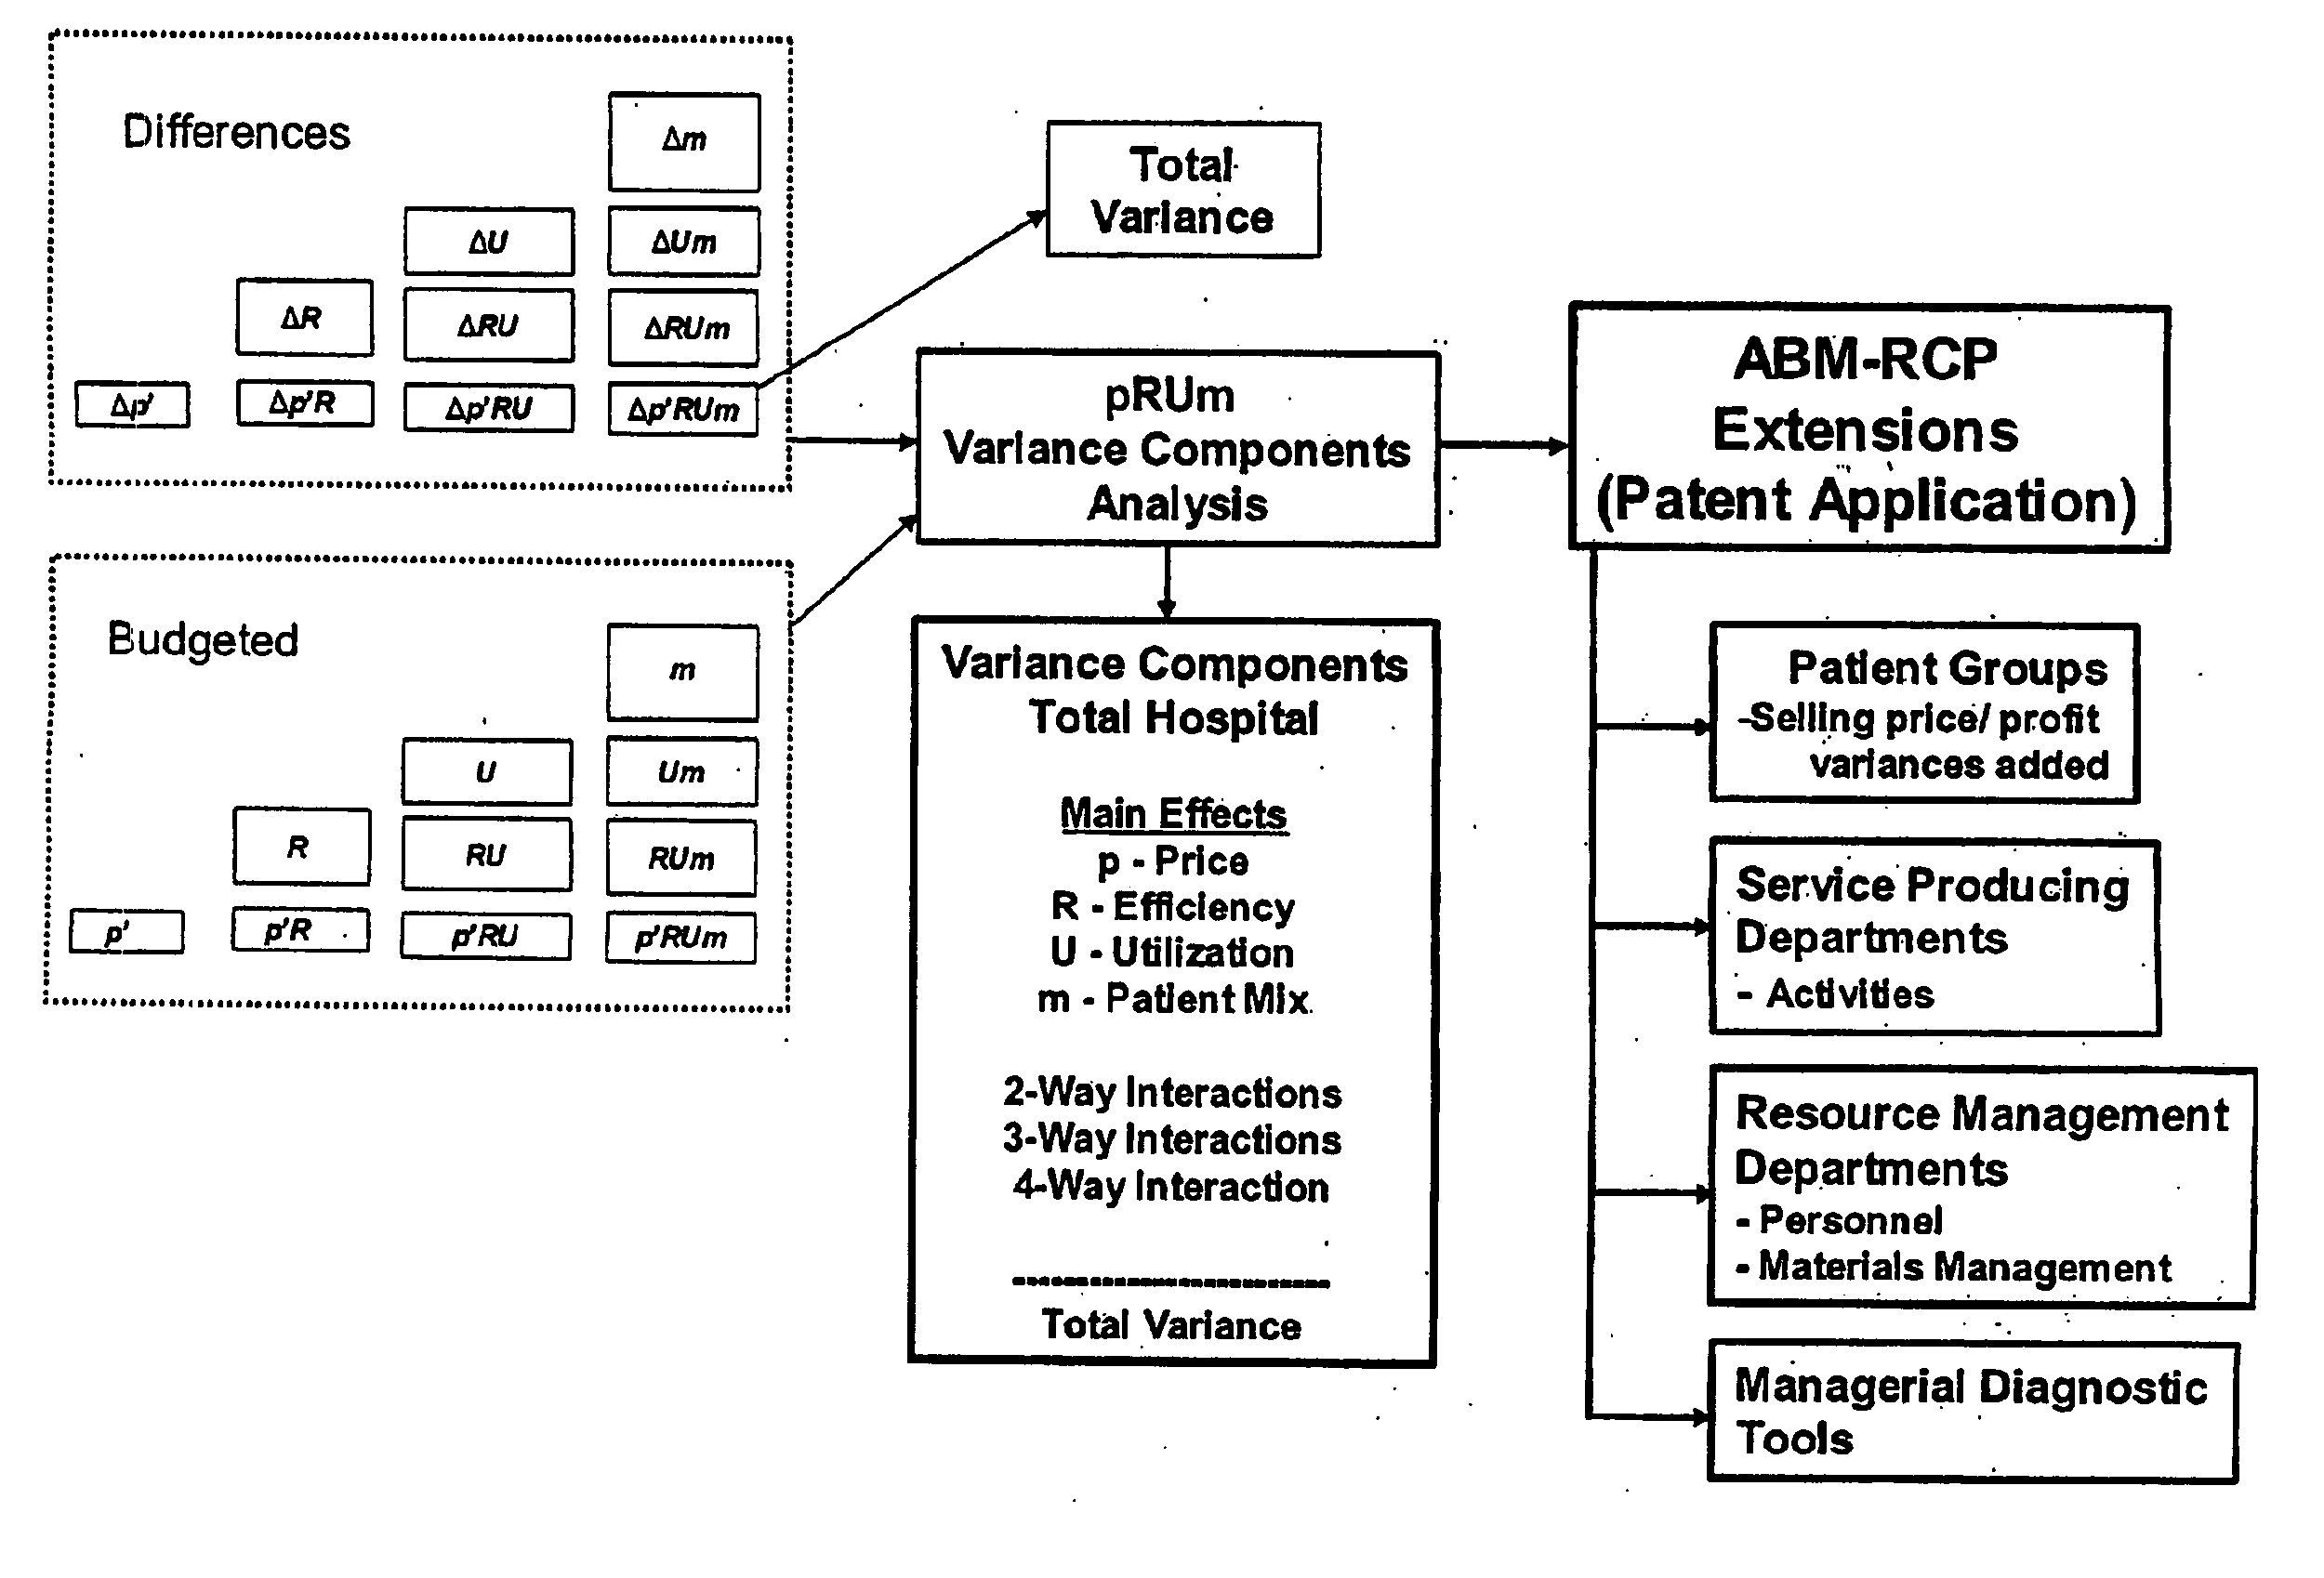
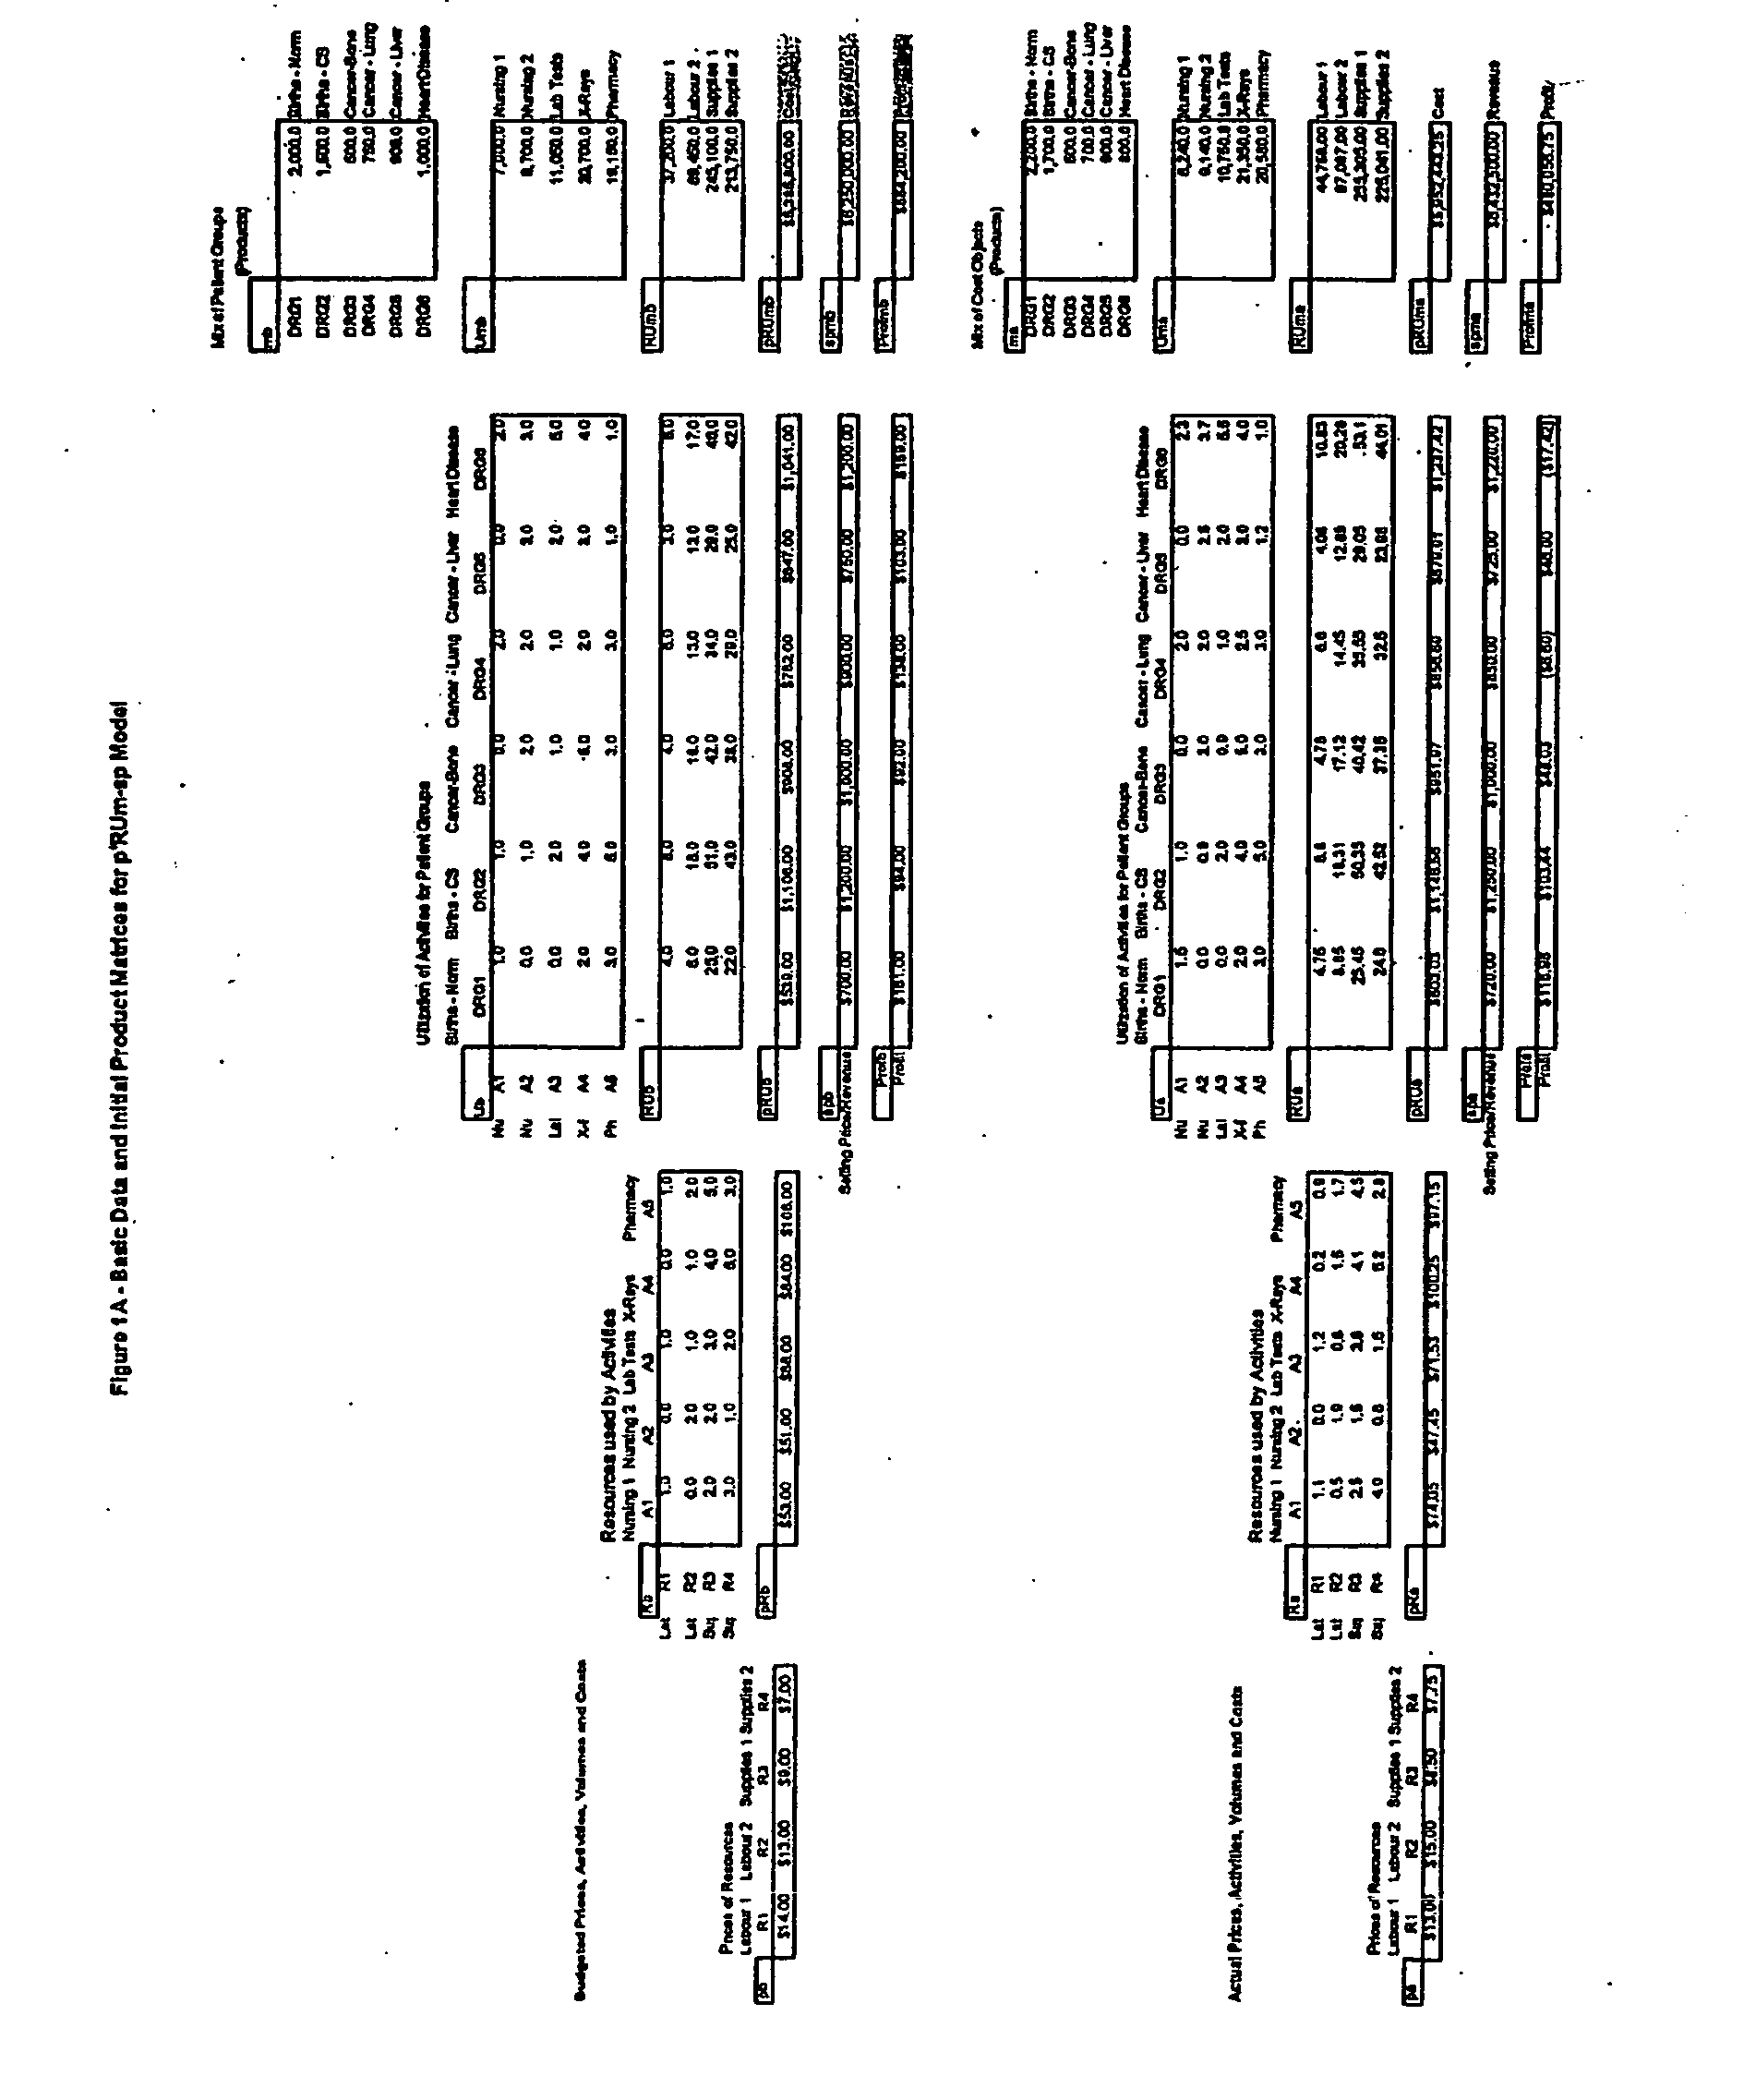
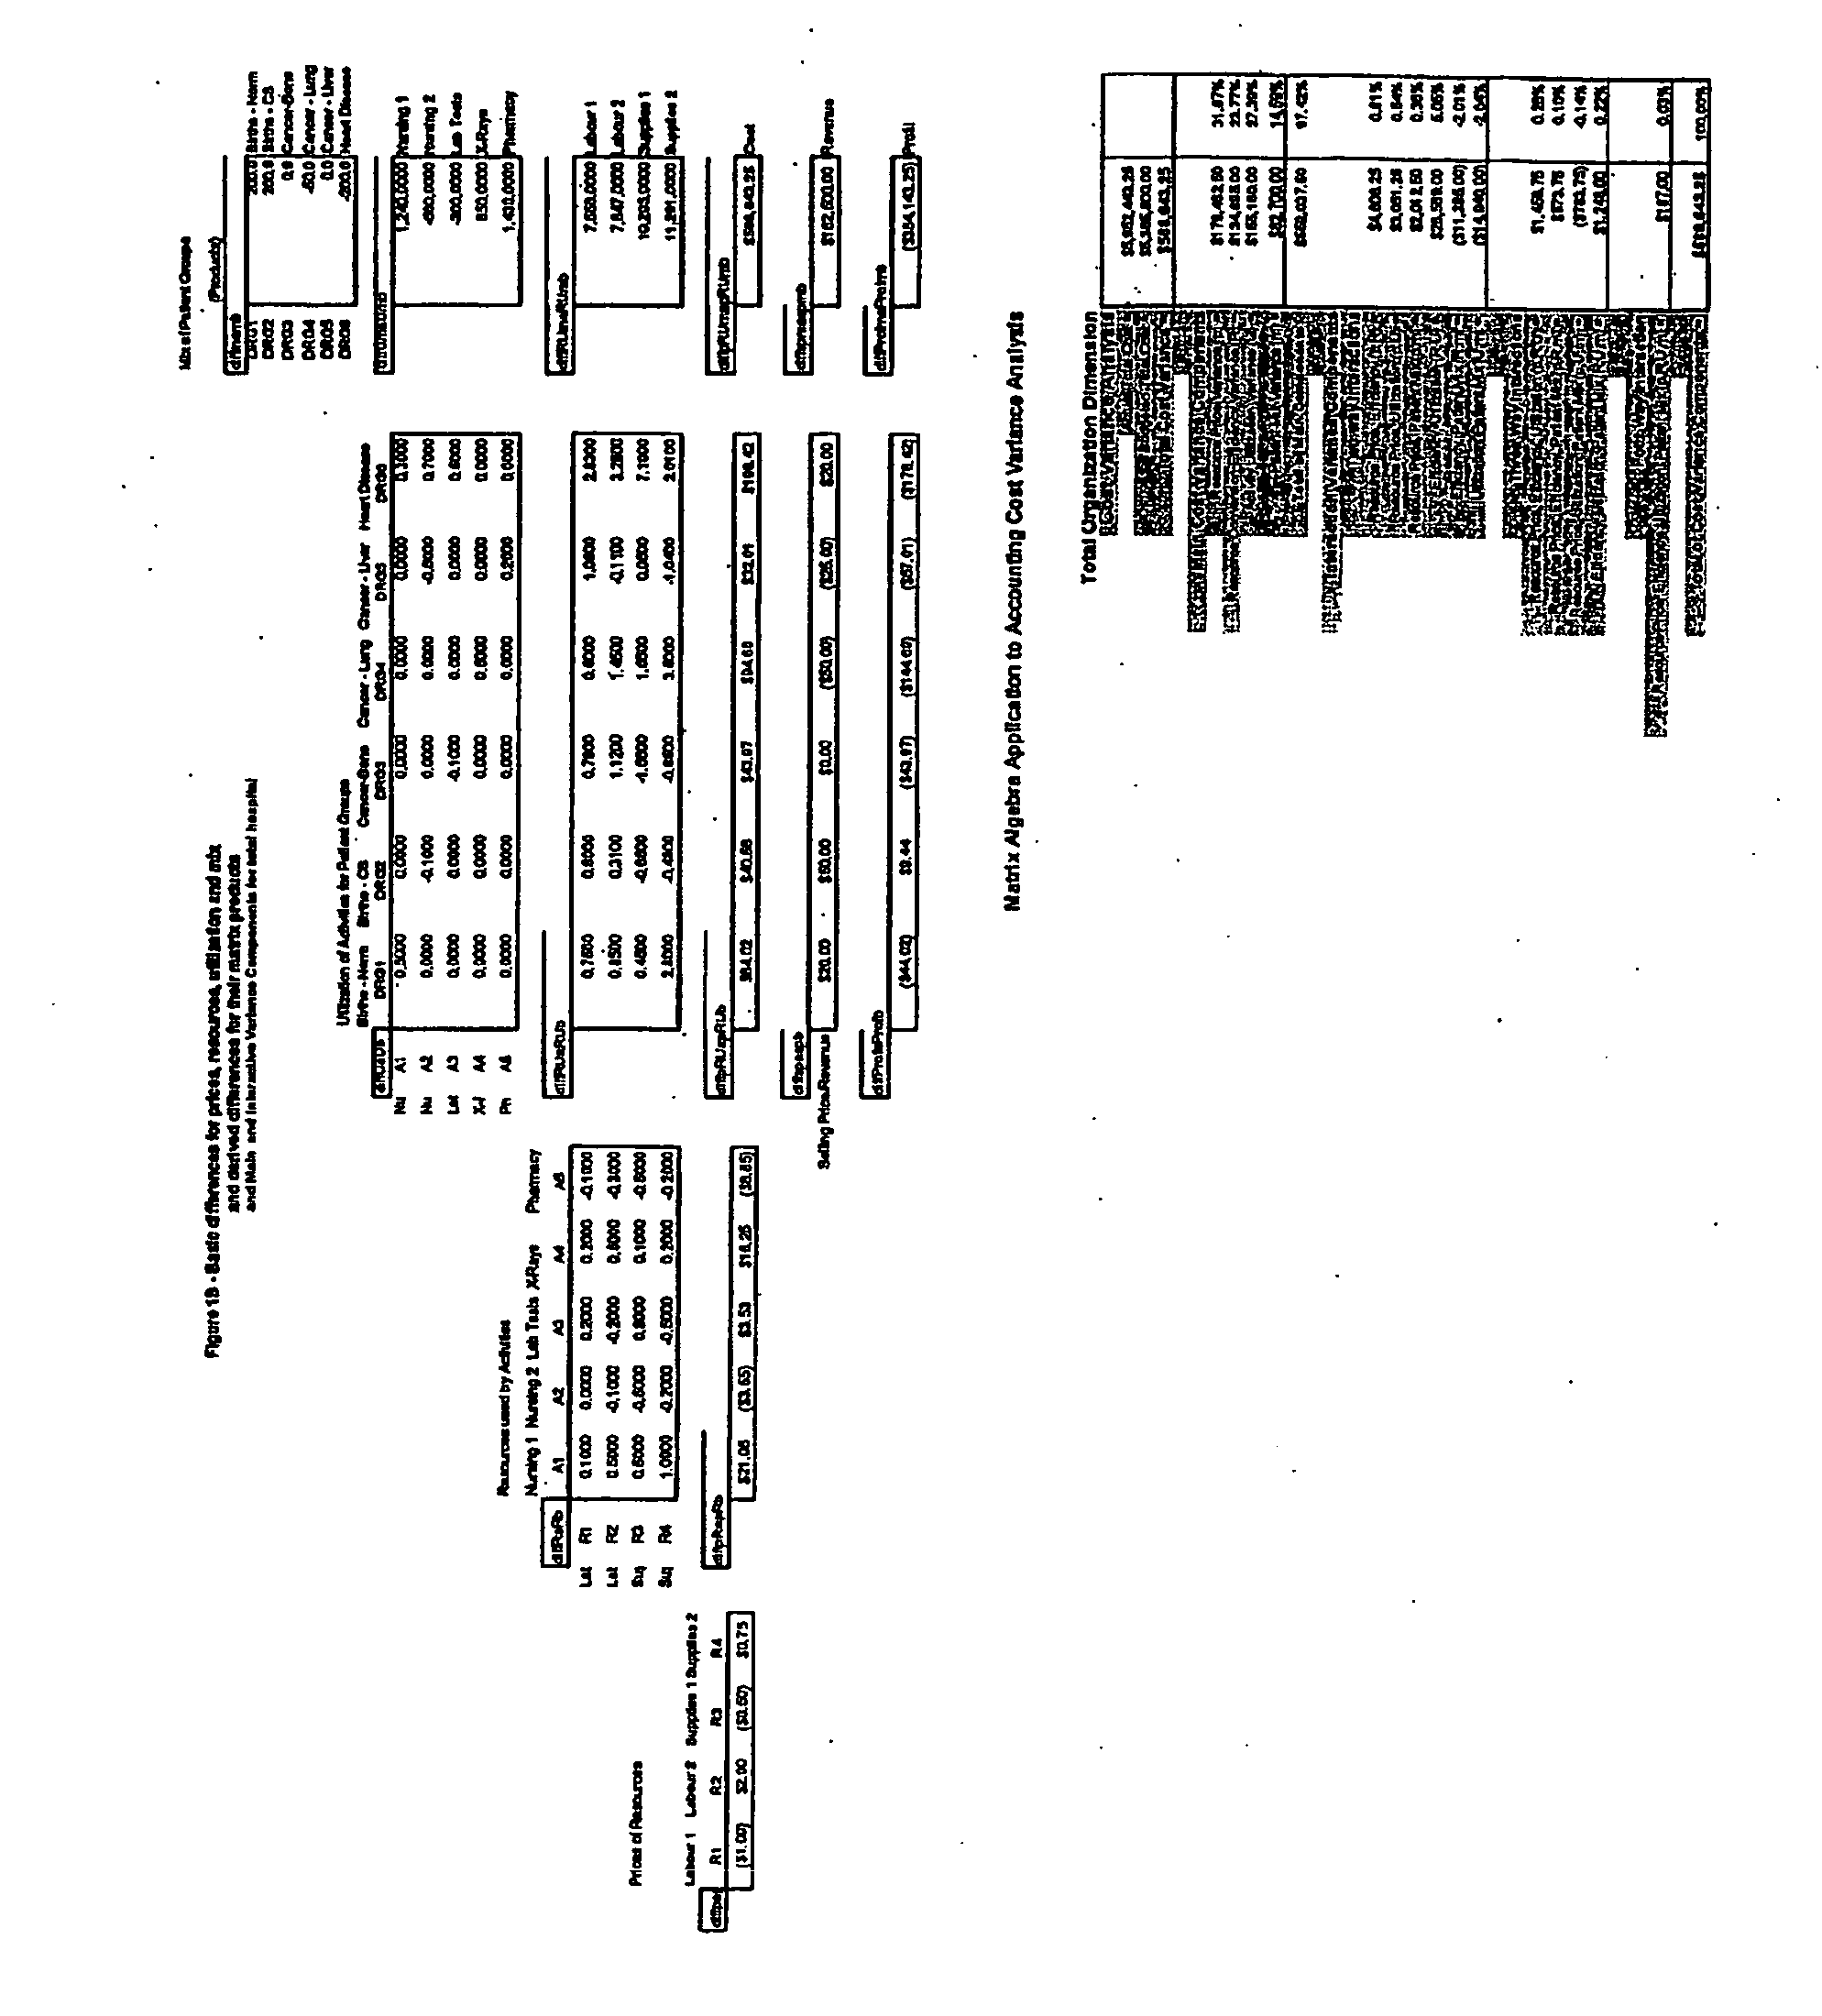
[0098] In one embodiment, the method of the present invention is used to perform cost variance analysis at the product or product group dimension as follows. Much more detailed information than given in the original p′RUm model is possible, using the present invention. The first extension of the model requires turning the product mix vector into a diagonal matrix, where each product has its own column. (The vector m becomes diag(m), where values not on the diagonal are zeros. A variant of this puts all products that belong in a product-group into a single column. The resulting matrix is not a pure diagonal matrix, but the same formulas can be used, replacing diag(m) by group(m).)

[0099]FIG. 10 shows elements of the original pRUm method and improvements according to the present invention. The Total Variance is the difference between Actual Total Costs and Budgeted Total Costs. This number would be the bottom...

example 2

Cost Variance Analysis at the Activity and Activity-Producing Department Dimension

[0129] The present invention can be extended in a different direction, namely to allow the diagnosis of the efficiency of operation of the activity-producing departments by focusing on the resources used and activities produced by individual departments. A common complaint of departmental managers is that they should not be held accountable for factors beyond their control, namely the variations in the volume of activities they are called upon to produce because of decisions of product managers, or variations in the prices of the input resources.

[0130]FIGS. 3A-3D present illustrations of a possible implementation of the method presented in Example 2. FIG. 3A illustrates the diagonal matrices of the cost variance analysis for the product dimension according to the invention (segments a and c), and intermediate matrix products (segments b and d). FIG. 3B illustrates further intermediate diagonalized ma...

example 3

Cost Variance Analysis at the Resource Acquisition Dimension

[0147] A variance analysis which shows the impact of efficiency, prices, utilization profiles and product mix on the operation of resource-acquisition departments requires combining the effects of activity-producing department manager and product manager decisions about R, U and m to obtain the volume of resources required, RUm. This is a column vector of resources showing the volumes of resources required. The budgeted and actual values are given by the column vectors RUmb and RUma.

[0148] The third extension of the original p′RUm model is to diagonalize these vectors to obtain the matrices diag(RUmb) and diag(RUma). Each column is specific to a particular resource and gives the volume of resources required for all activities for the production of all products. Premultiplying those matrices by p′ gives the “Dollars for Resources” vectors p′·diag(RUmb) and p′·diag(RUma). These are vectors which indicate the dollars require...


PUM


Abstract

A method for cost variance analysis for assessment of the effects of products/product groups, activities/activity-producing-departments, and resource acquisition, within an organization. The method utilizes the Broyles and Lay p′RUm cost variance model. By converting one or more variables of the Broyles and Lay model into a diagonal or grouped matrix, effects within departments can be apportioned, to identify problematic factors, as well as areas of opportunity. A related method of revenue and profit variance analysis. Revenues are calculated as (Selling Prices)×(Volume and mix of products). Revenue variances are the difference between actual and budgeted revenues, and can be attributed to the changes in selling prices and volume and mix of products. Profit is defined as revenue less cost Profit variances depend on both revenue and cost variances.

Description

[0001] This application claims priority from U.S. provisional patent application Ser. No. 60 / 363,964 filed Mar. 14, 2002.FIELD OF THE INVENTION [0002] The present invention relates to accounting methods. In particular, the present invention relates to a method of revenue, profit and cost variance analysis. BACKGROUND OF THE INVENTION [0003] Accounting reports provided to department / budget managers often present 3 columns showing budget numbers, actual spending numbers, and the differences, or “variances”. In this traditional variance analysis the manager is expected to explain why the variances occurred, but has little evidence to support any explanation. This traditional variance analysis is devoid of any theoretical basis. A new cost variance model, termed “p′RUm”, published in 1982 by Broyles and Lay, (Broyles, Robert W. and Colin M. Lay, “Budgeting and Controllable Cost Variances—The Case of Multiple Diagnoses, Multiple Services, and Multiple Resources,”Journal of Medical System...

Claims


Application Information

Patent Timeline
IPC IPC(8): G06Q30/00
CPCG06Q30/02G06Q10/06G06Q30/0283
Inventor EDEN, RONALDLAY, COLIN M.
Owner UNIVERSITY OF OTTAWA
Why Eureka
Try Eureka