Method for predicting loudspeaker preference

a loudspeaker preference and listening test technology, applied in the field of loudspeakers, can solve the problems of poor agreement about the way the loudspeaker should be measured, time-consuming and expensive, and difficult to perform properly controlled listening tests on loudspeakers

Active Publication Date: 2005-09-08
HARMAN INT IND INC
View PDF6 Cites 22 Cited by
  • Summary
  • Abstract
  • Description
  • Claims
  • Application Information

AI Technical Summary

Benefits of technology

[0023] In one example, the loudspeaker preference rating may be calculated by obtaining a comprehensive set of frequency response curves for a set of loudspeakers calculated using an octave smoothing filter at least as high as ⅙th octaves. Then, various statistical measures may applied to the set of frequency response curves to derive a set of independent variables. Once the independent variables are established the variables are correlated to loudspeaker preference rating by calculating a measured deviation between the statistical measures and frequency response for each independent variable. Once correlated, a set of independent variables is selected that is indicative of loudspeaker preference determined by selecting independent variables with maximum ability to predict a loudspeaker preference rating based upon correlation to loudspeaker preference. A statistical regression technique is then applied to the selected set of independent variable to determining preference rating by using a statistical regression technique to weigh the variables and arrange the weighted independent variables into a linear relationship on which the loudspeaker preference variable depends.

Problems solved by technology

Properly controlled listening tests on loudspeakers are difficult, time-consuming and expensive to perform.
In assessing such models, however, it becomes clear that there is little agreement about how the loudspeakers should be measured and in what types of environments they should be measured.
Most of the models have not been adequately tested or validated, which calls into question their accuracy and generalizability.
Moreover, none of the current codec measurement models include the psychoacoustic effects related to the loudspeaker's complex frequency-dependent radiation properties and its interaction with the room.
However, Rosenberg never specified an exact model to predict his data.
Unfortunately, Staffeldt's listening tests were based on only one listener and the room was rather large and reverberant.
Thus, because the CU model is based largely on a loudspeaker's ⅓-octave sound power response, measured sound power alone does not accurately predict the perceived sound quality of the loudspeaker.
Human beings are more prone to random errors in judgment than the computers performing the objective measurements.
Toole argued that ⅓-octave in-room measurements lack the necessary frequency resolution to distinguish between low and medium-high Q resonances.
However, to date, none have produced a model that uses the measurements to predict listeners' preference ratings.
However, there are several problems.
Finally, there is evidence that equalizing the loudspeaker's sound power response to be flat results in lower preference ratings if the loudspeaker does not have constant (flat) directivity and the listener is not in a reverberant room.
This can lead to lower preference ratings.

Method used


Image

  • Method for predicting loudspeaker preference
  • Method for predicting loudspeaker preference
  • Method for predicting loudspeaker preference

Examples


Embodiment Construction

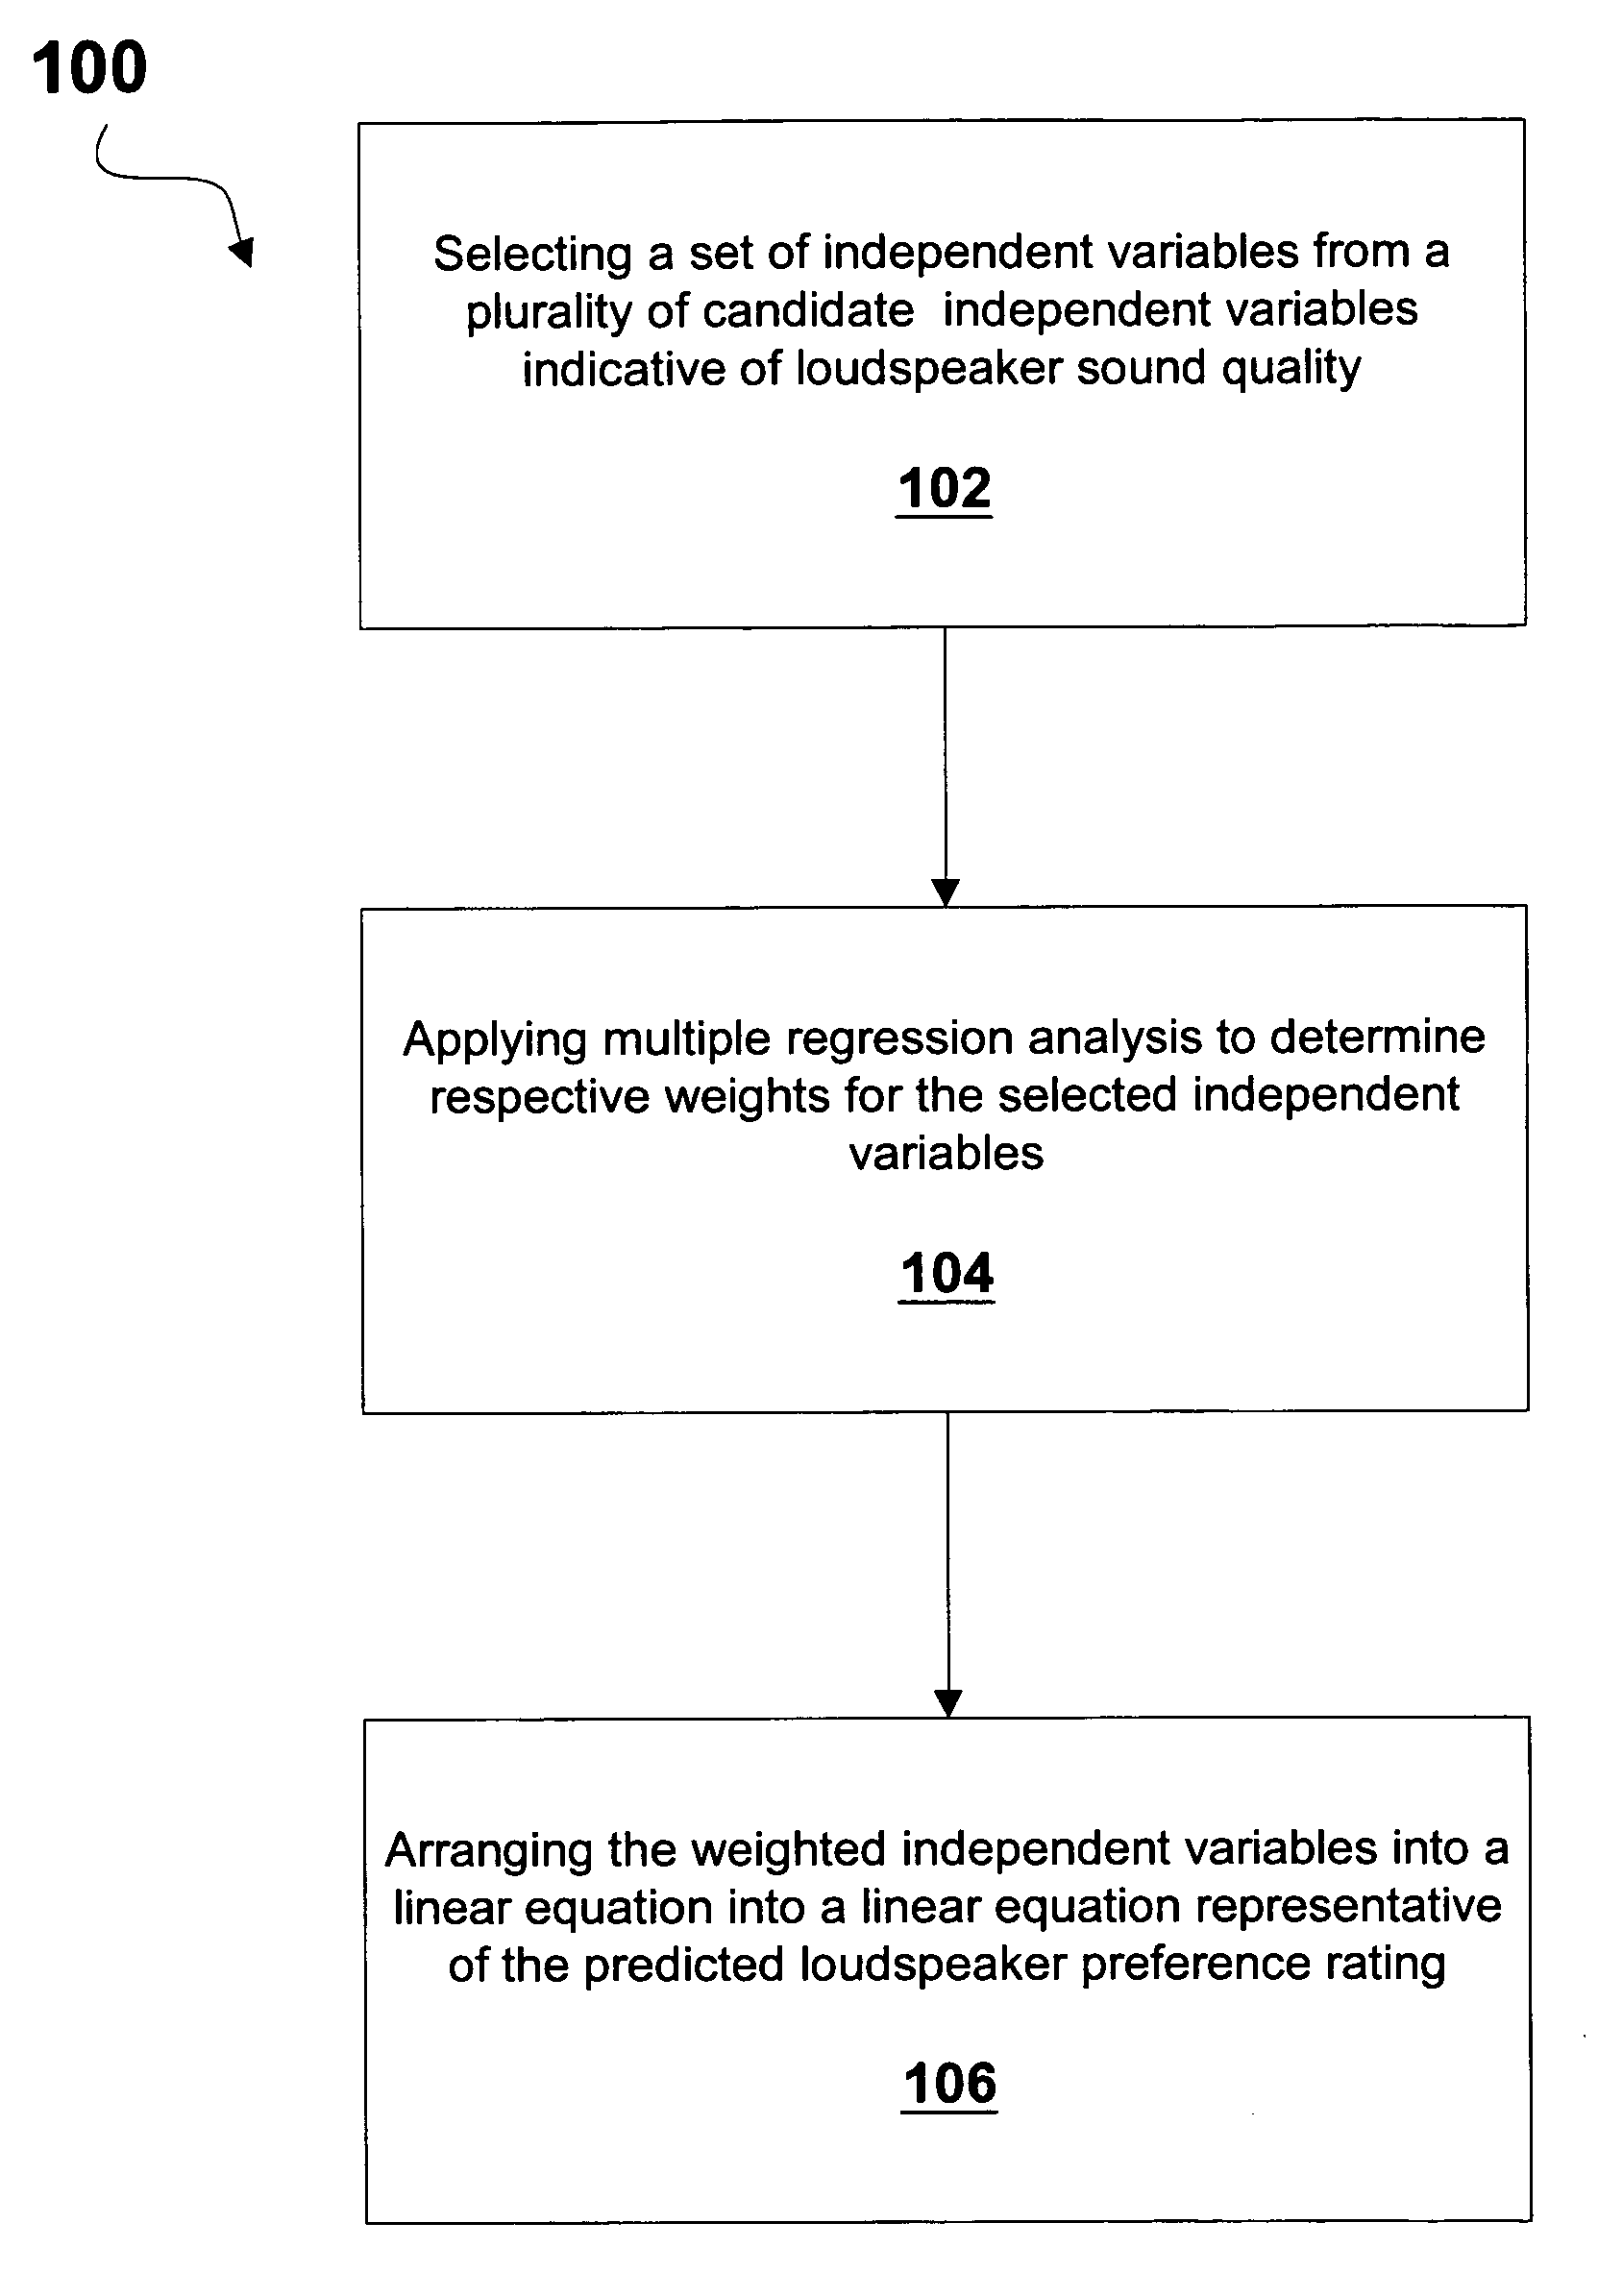
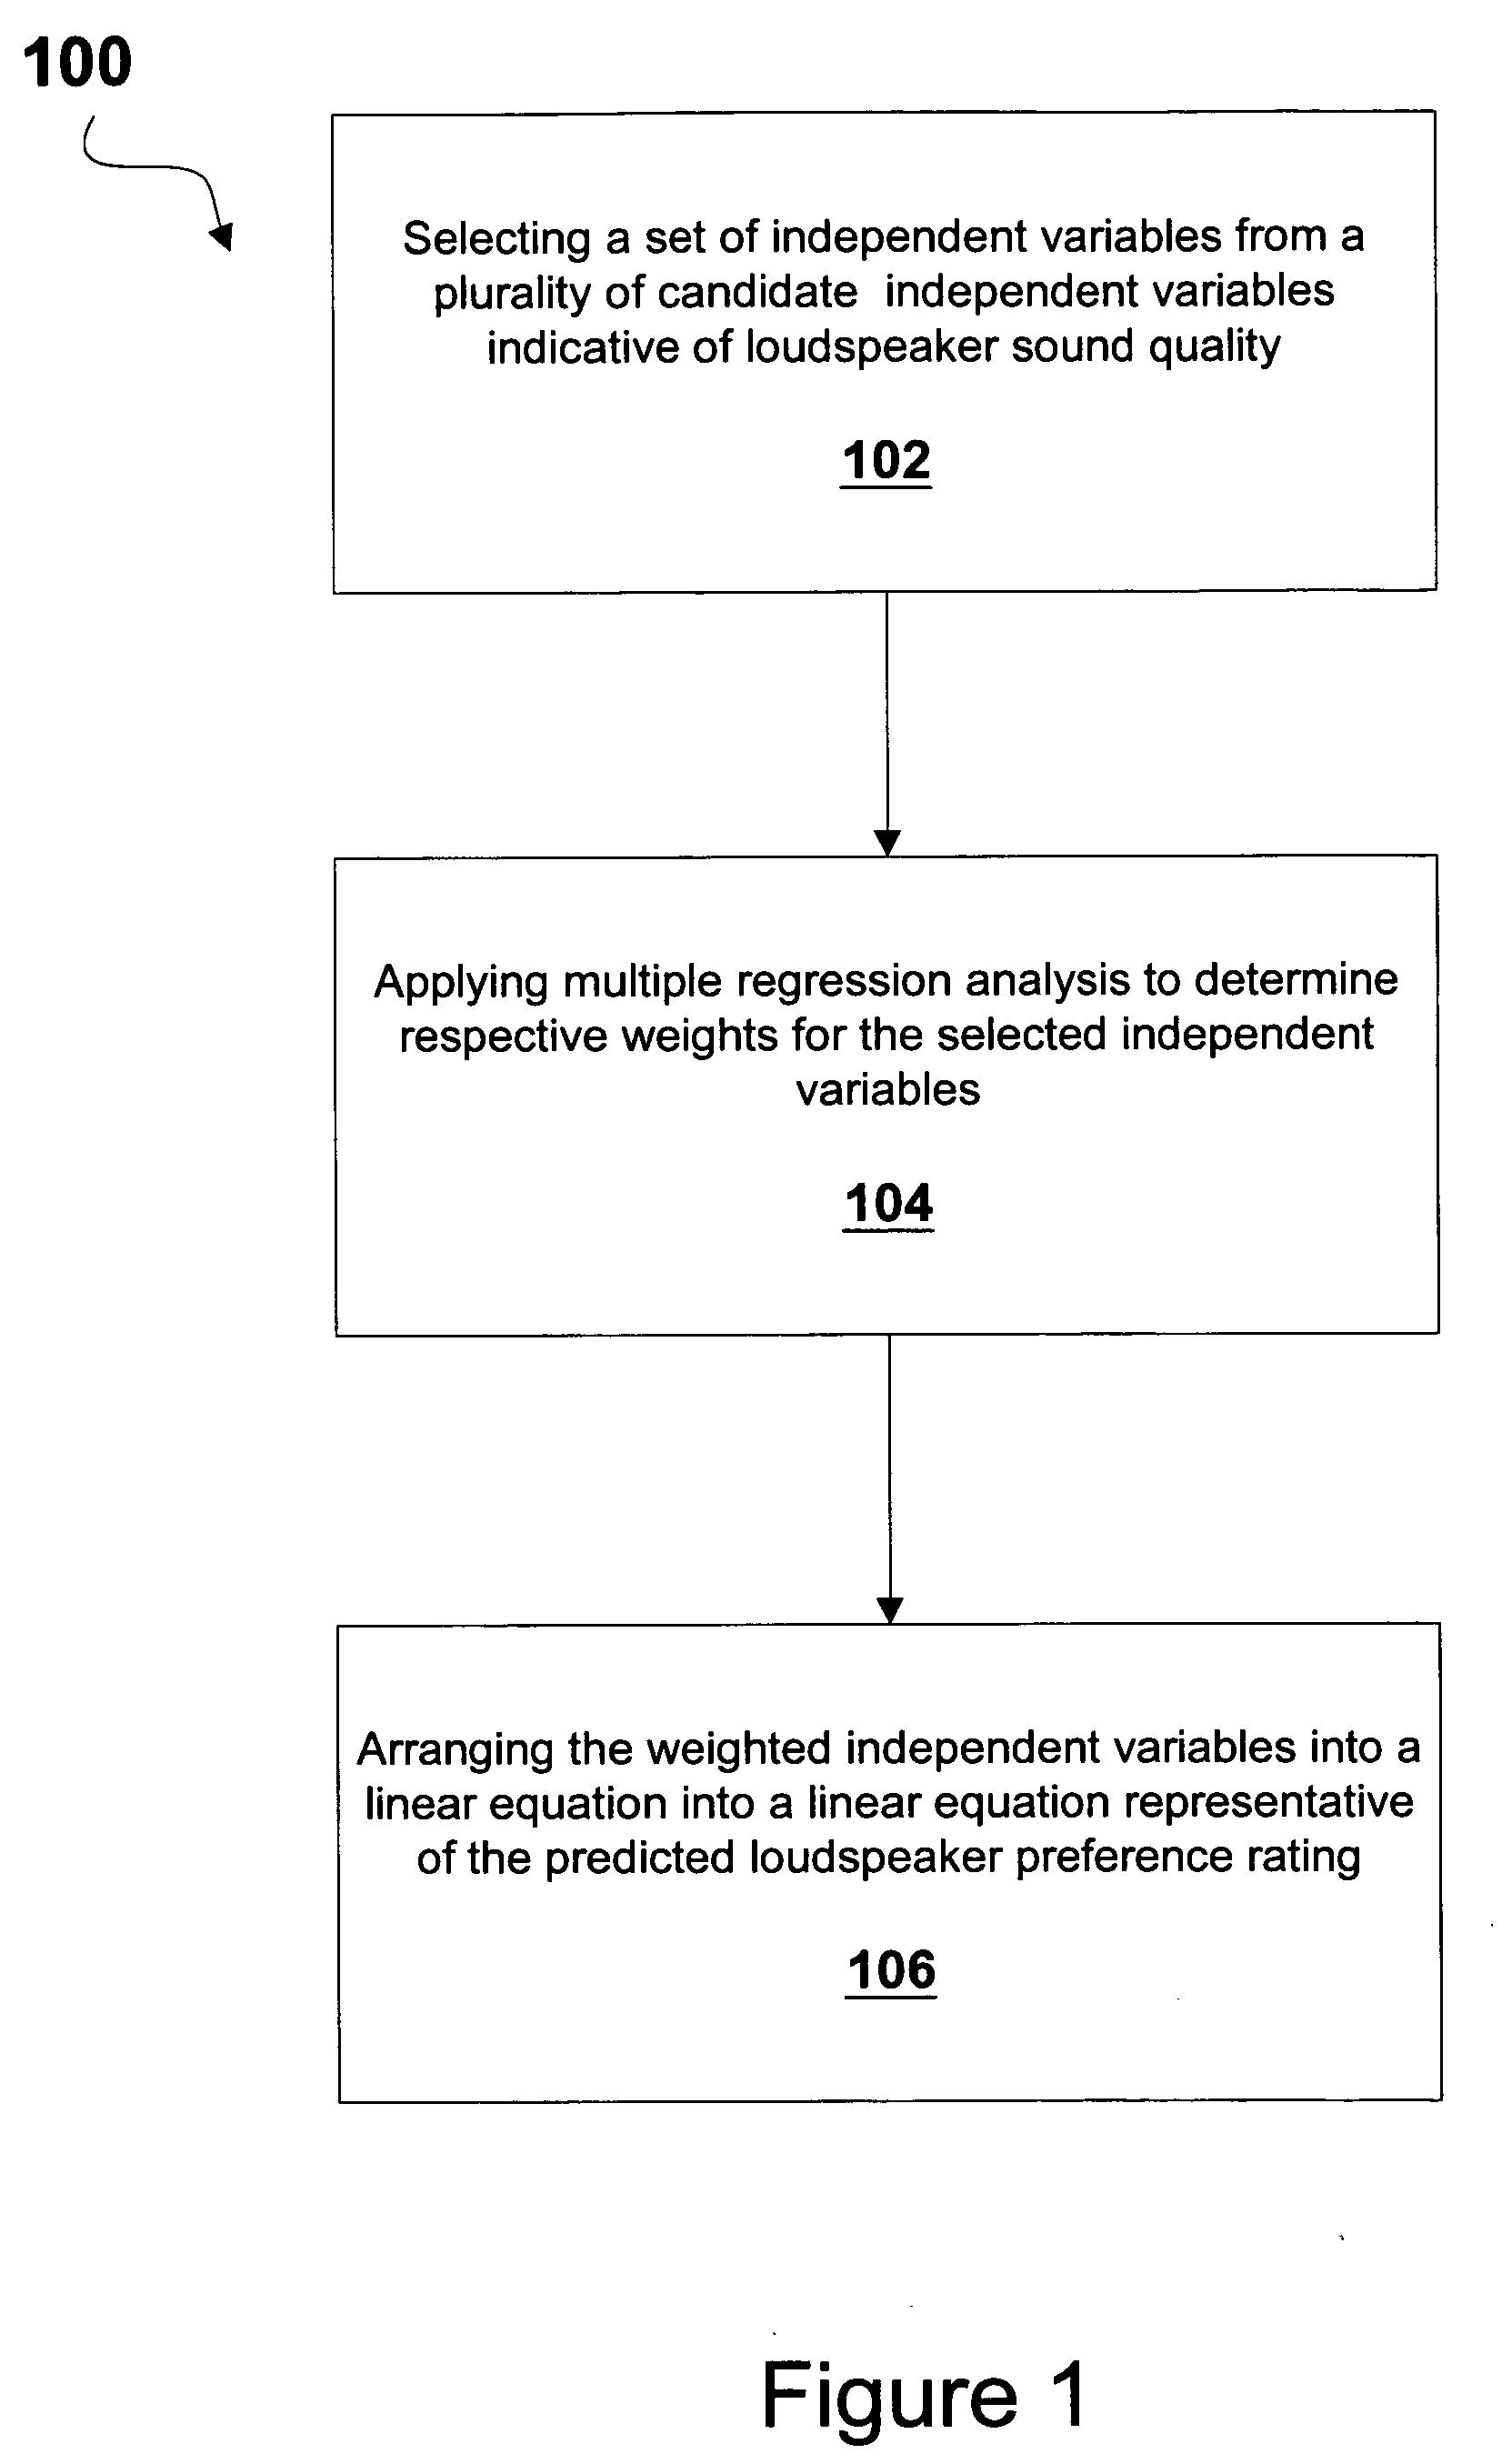
[0032] A general model is provided for predicting a loudspeaker preference rating that correlates the loudspeaker's preference rating to a measured deviation in the comprehensive spatially averaged frequency response of a loudspeaker using a statistical regression model. For purposes of this application a loudspeaker preference rating means any indicator of perceived sound quality, including, but not limited to, scales of preference, fidelity, naturalness or other similar indicators.

[0033] According to one example implementation, the model's predicted loudspeaker preference rating is calculated based upon the sum of a plurality of weighted independent variables that statistically quantify amplitude deviations in a loudspeaker frequency response. To develop the model, the independent variables X1-Xn used in the model are weighted in accordance with their relative contribution to predicted listener's preference ratings. In one example implementation, the variables may be weighted thr...


PUM


Abstract

A general model is provided for predicting a loudspeaker preference rating, where the model's predicted loudspeaker preference rating is calculated based upon the sum of a plurality of weighted independent variables that statistically quantify amplitude deviations in a loudspeaker frequency response. The independent variables selected may be independent variables determined as maximizing the ability of a loudspeaker preference variable to predict a loudspeaker preference rating. A multiple regression analysis is performed to determine respective weights for the selected independent variables. The weighted independent variables are arranged into a linear relationship on which the loudspeaker preference variable depends.

Description

RELATED APPLICATIONS [0001] This application claims priority to U.S. Provisional Patent Application Ser. No. 60 / 549,731 filed on Mar. 2, 2004, titled A Multiple Regression Model for Predicting Loudspeaker Preference Using Objective Measurements: Part I-Listening Test Results; and U.S. Provisional Patent Application Ser. No. 60 / 603,319 filed on Aug. 8, 2004, titled A Multiple Regression Model for Predicting Loudspeaker Preference Using Objective Measurements: Part II—Development of the Model; and U.S. Provisional Patent Application Ser. No. 60 / 622,372 filed on Oct. 28, 2004, all of which are incorporated into this application by reference in their entirety. BACKGROUND OF THE INVENTION [0002] 1. Field of the Invention [0003] This invention relates generally to loudspeakers. More particularly, the invention relates to providing a model for predicting loudspeaker preferences by listeners based on multiple regression analysis utilizing objective measurements. [0004] 2. Related Art [0005]...

Claims


Application Information

Patent Timeline
Patent Type & Authority Applications(United States)
IPC IPC(8): H04R3/00H04R29/00
CPCH04R29/00
Inventor OLIVE, SEAN
Owner HARMAN INT IND INC
Why Eureka
Try Eureka