Statistical data analysis tool

a statistical data and tool technology, applied in the field of methods and apparatuses, can solve problems such as failure to work, and achieve the effect of accurate discarding a number

Inactive Publication Date: 2006-10-26
AGENCY FOR SCI TECH & RES
View PDF3 Cites 22 Cited by
  • Summary
  • Abstract
  • Description
  • Claims
  • Application Information

AI Technical Summary

Benefits of technology

[0011] Note that the subsets comprising only inliers will most likely form one cluster—being correlated with each other in the parameter space—whereas the subsets containing one or more outliers will tend to be less correlated. This result is true irrespective of the proportion of outliers in the data

Problems solved by technology

All three of these methods have the problem that they fail to work if the proportion of the outliers is greater than 50% of the data-set, because in this case the statistical meas

Method used


Image

  • Statistical data analysis tool
  • Statistical data analysis tool
  • Statistical data analysis tool

Examples


Embodiment Construction

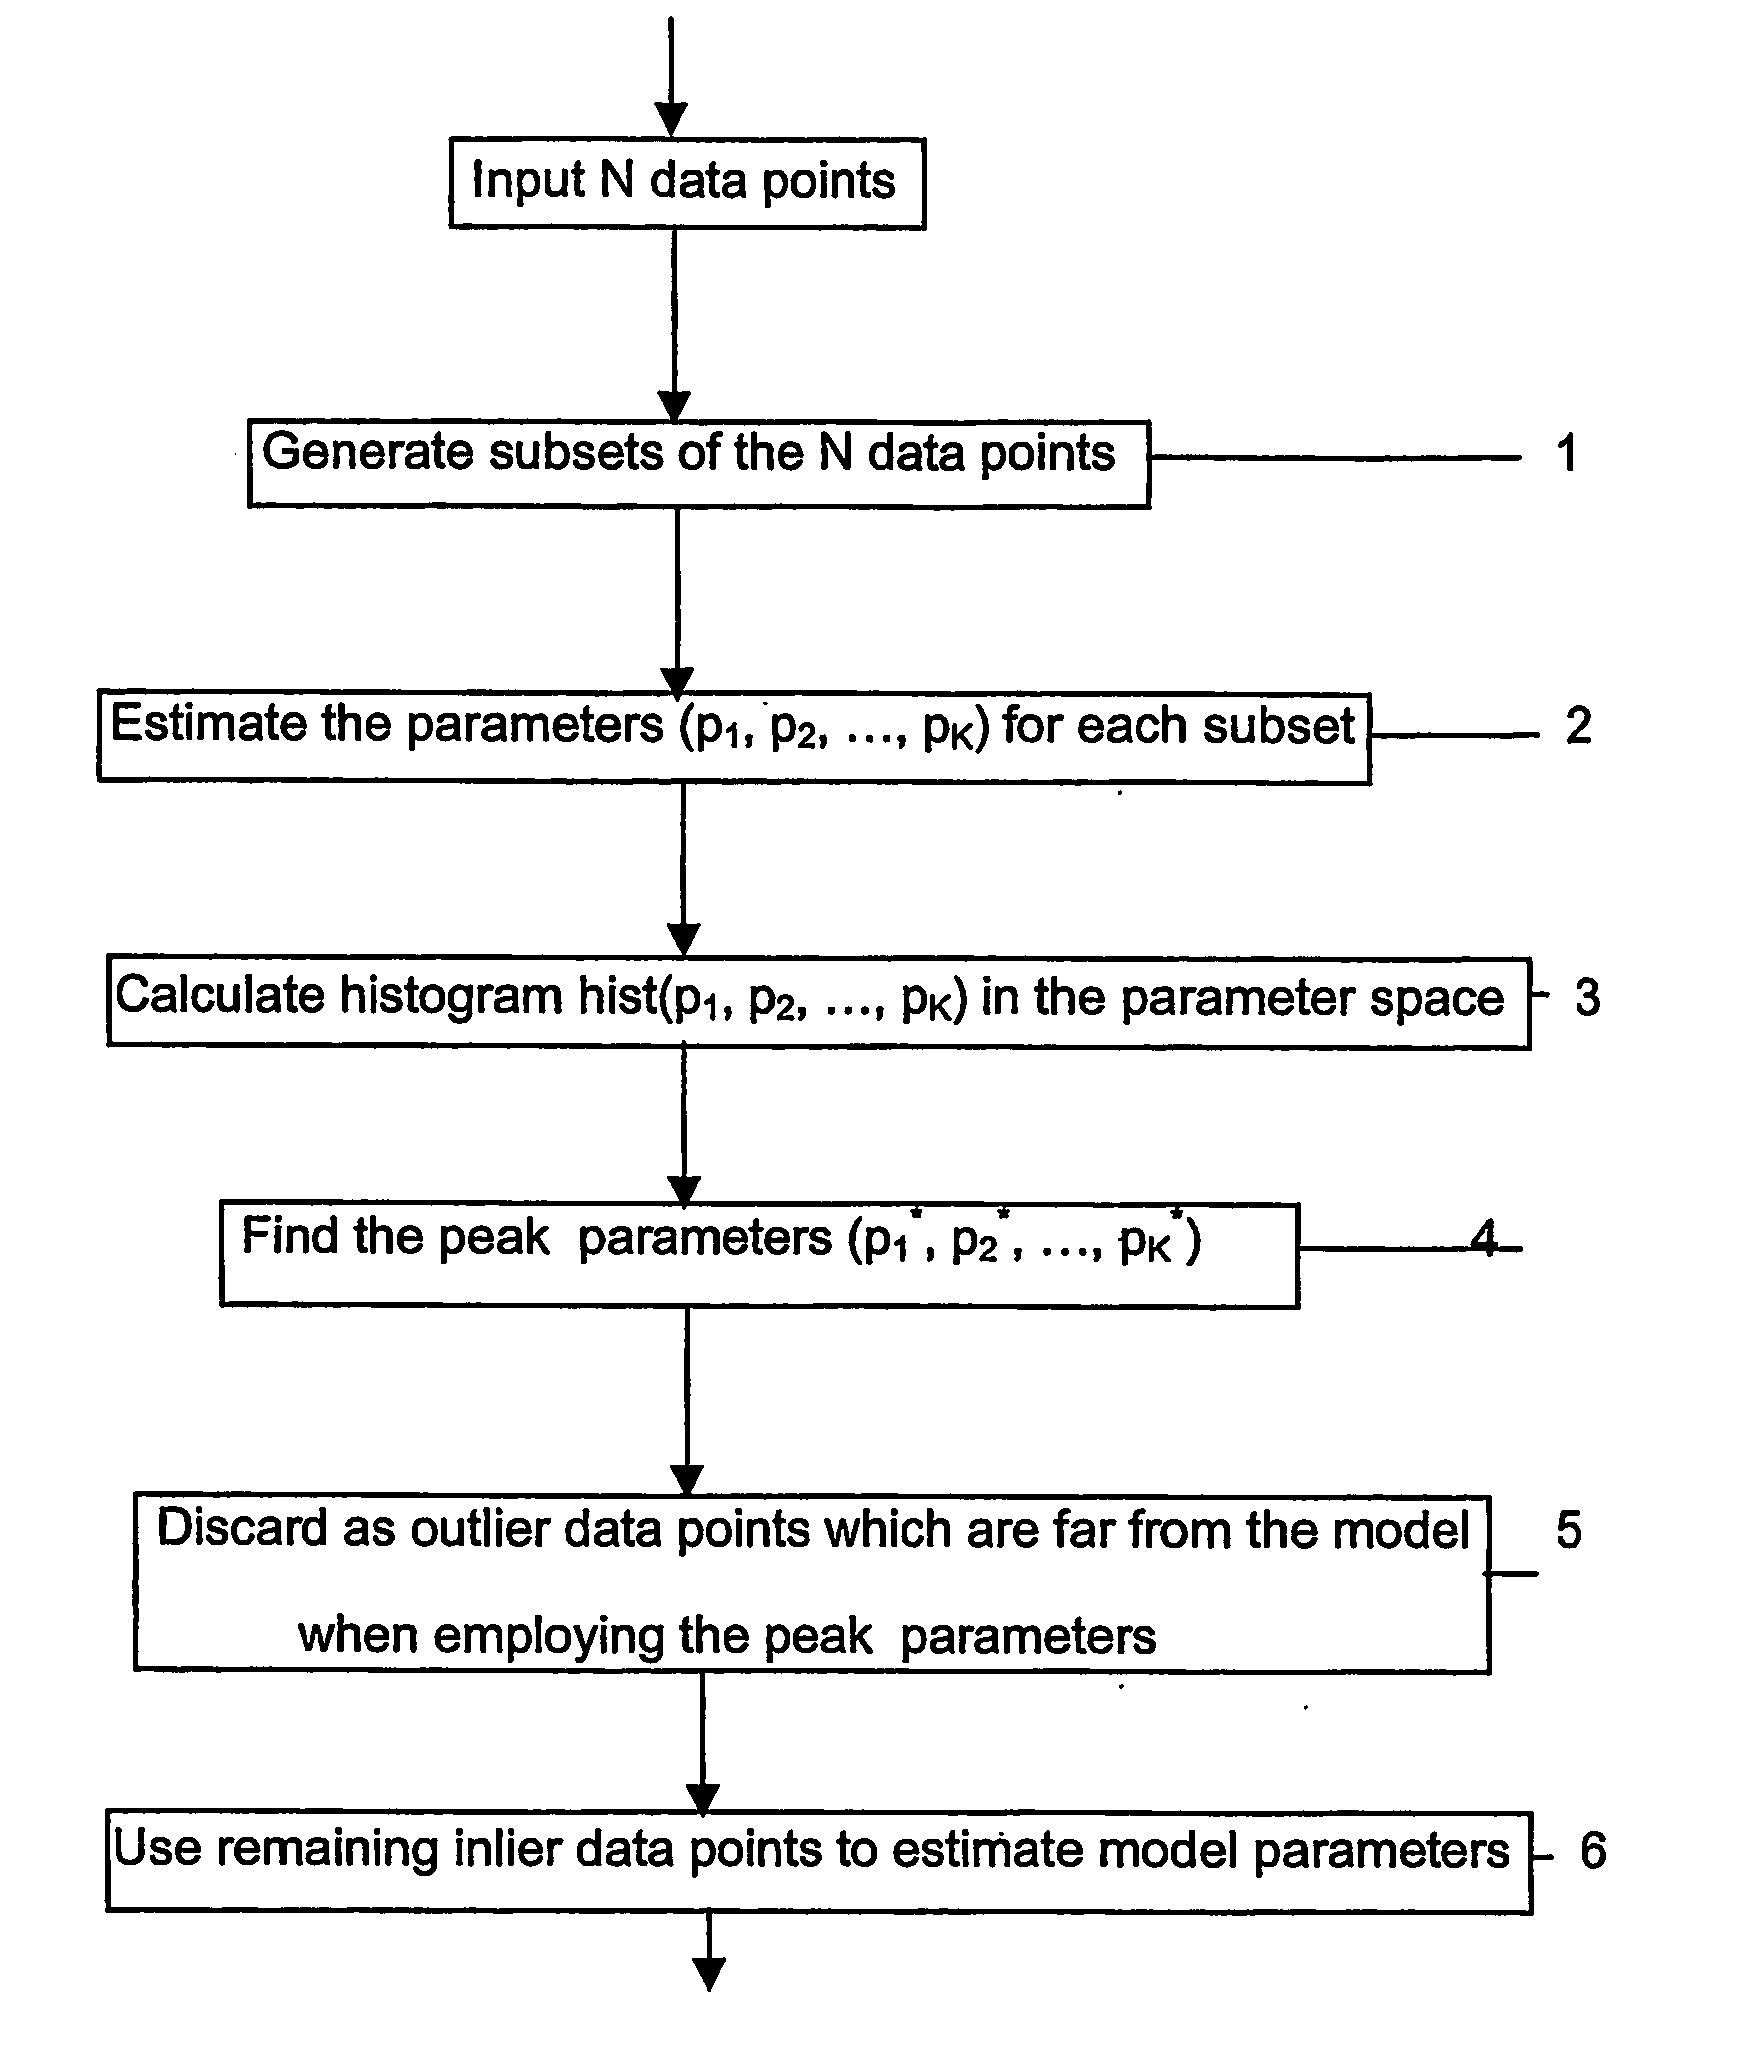
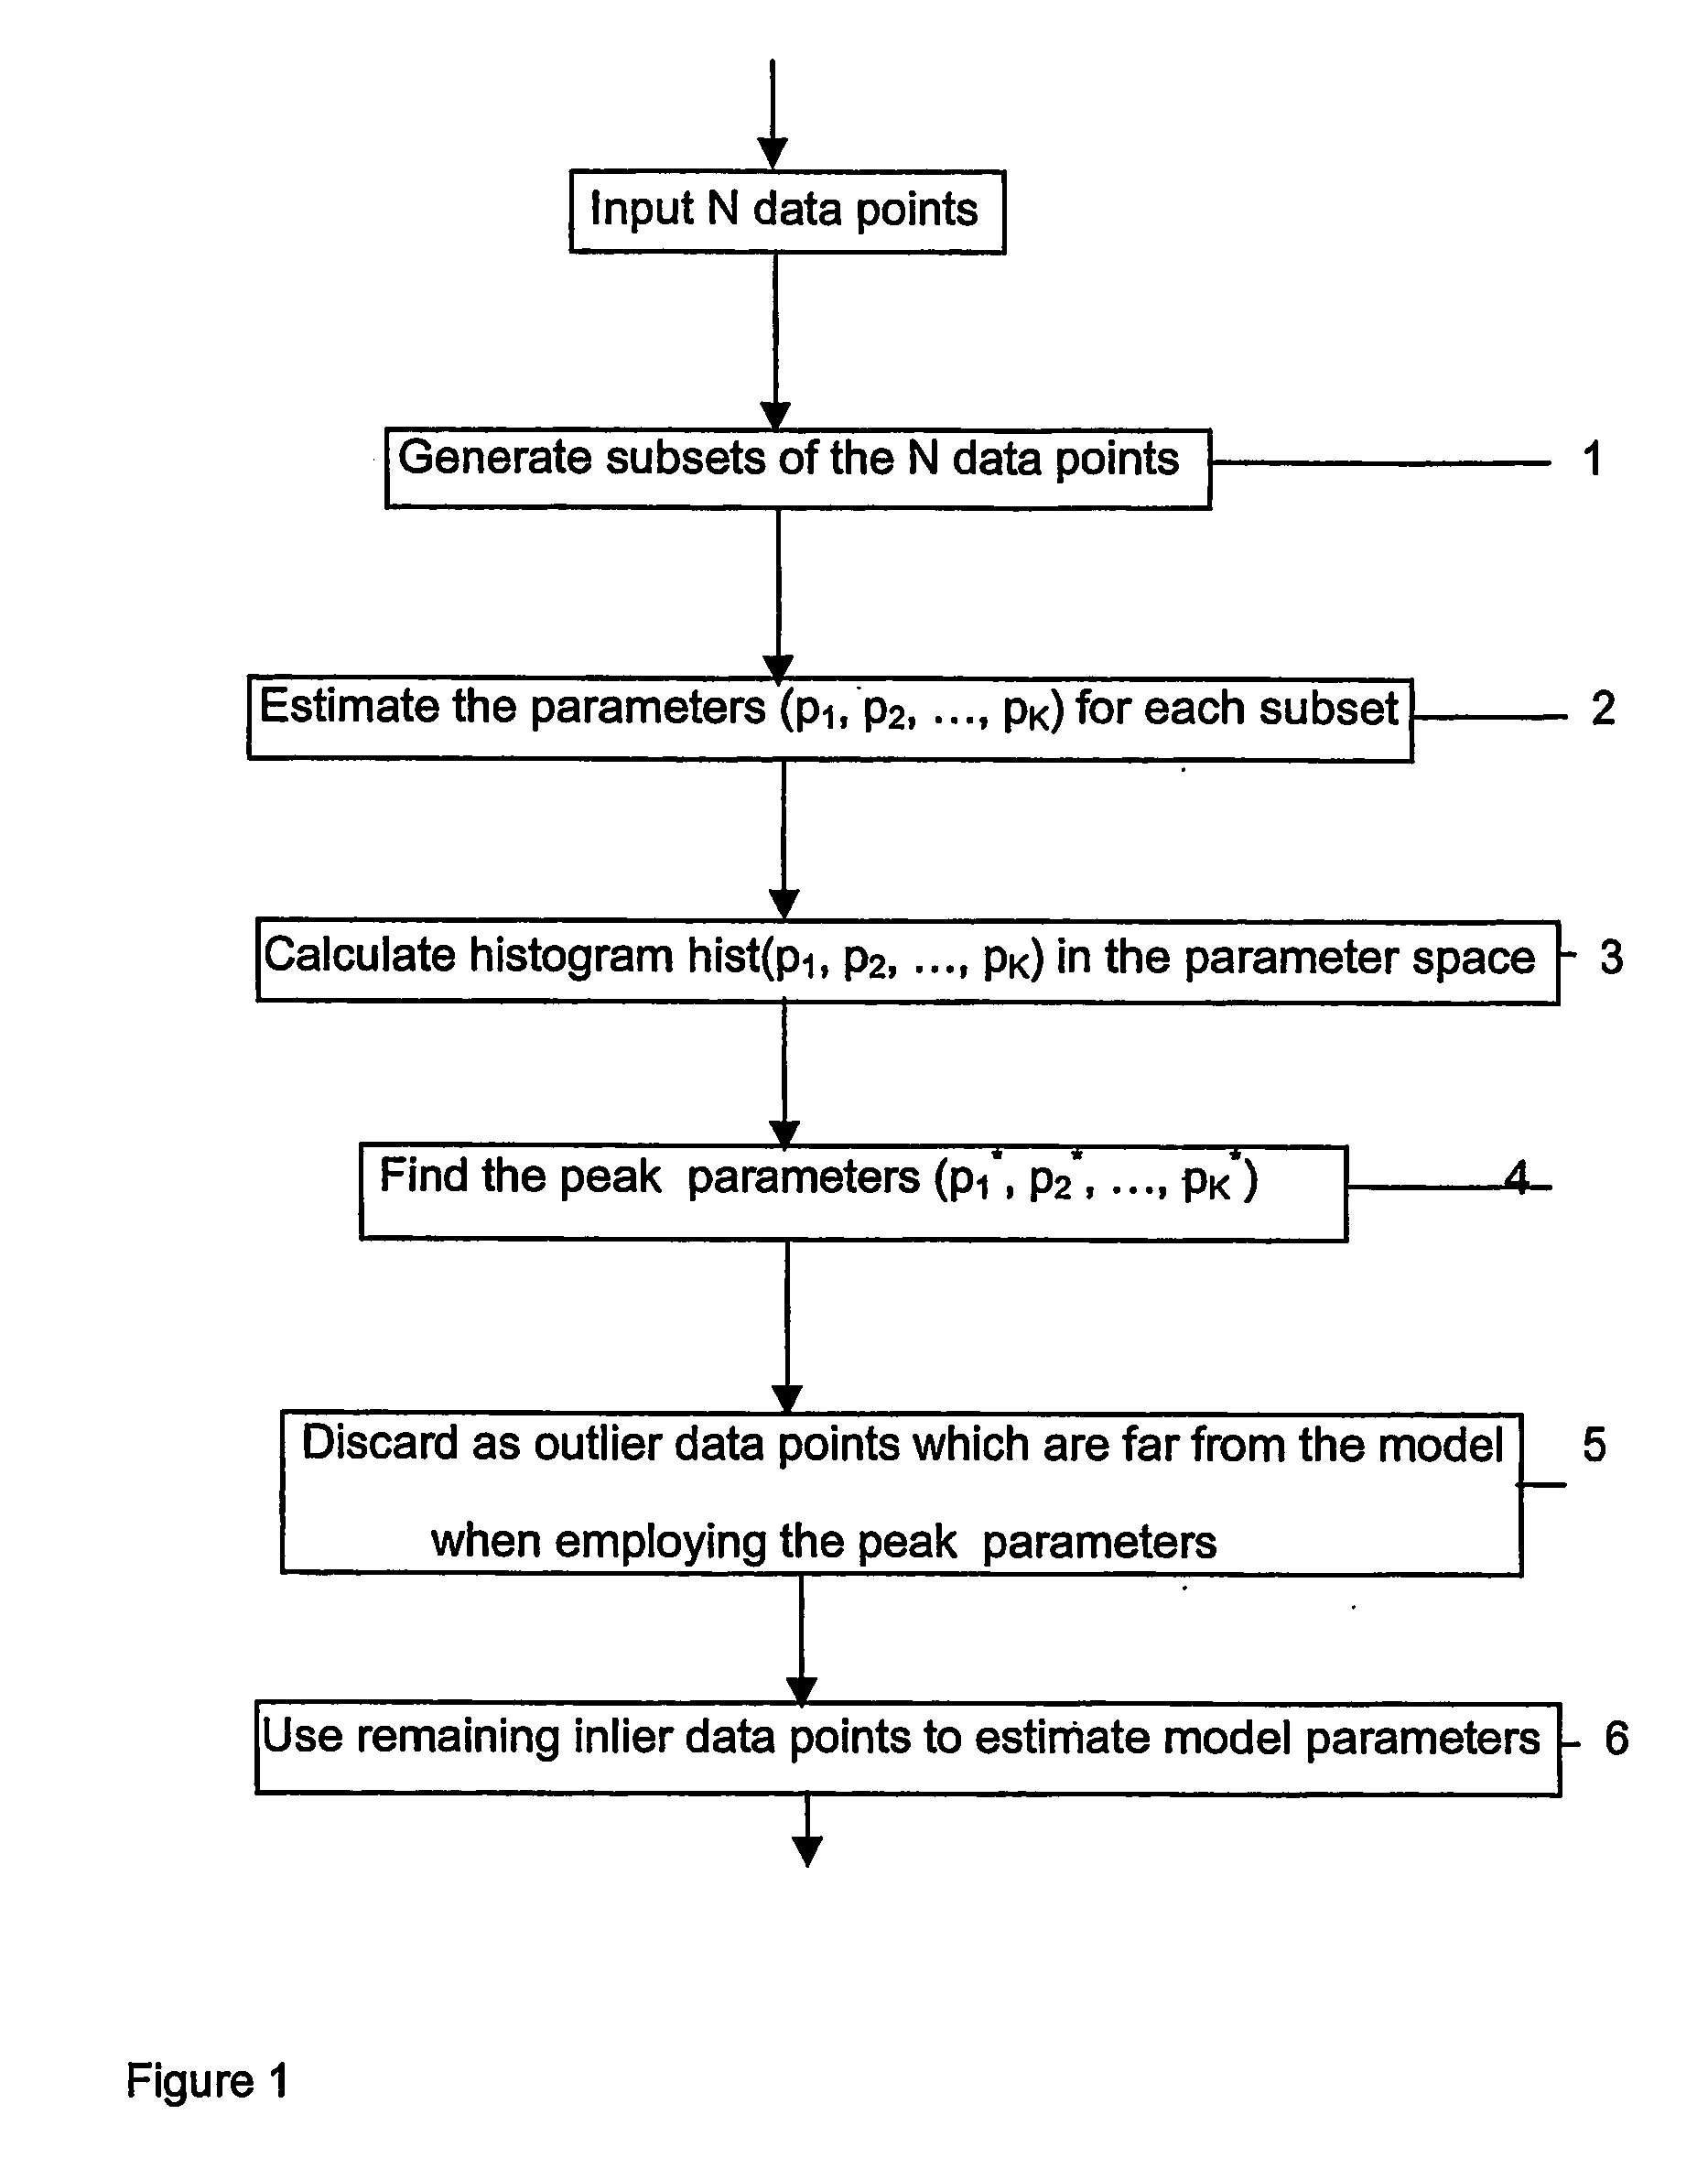
[0017] Suppose the experimental data-set comprises N input data points. Each input data point is any quantity or vector denoted as X, X can be a vector of coordinates, gray level related quantities if the data originates from images, etc. X is called the feature vector of the input data point.

[0018] In the embodiment, the model has K independent parameters pj(j=1, . . . ,K) and is usually a function of X. The model is denoted as mod(X) given by:

mod(X)=p1.base1+p2.base2+ . . . + pk.basek  (1)

where basej (j=1, . . . K) are known functions of the feature vector, X and the symbol “.” represents multiplication. A determination of the model is thus equivalent to the task of identifying the K parameters p1, . . . , pK using the experimental data-set.

[0019] For each data point with feature vector Xi, a corresponding model value mod(Xi) can be calculated, where i=1, . . . , N. For inlier data points, Xi and mod(Xi) are related by equation (1), possibly with a noise, whereas outlier data...


PUM


Abstract

A functional model for a set of experimental data has K independent parameters. The parameters are to be estimated from an experimental data-set of N data points, comprising “inlier” data points representative of the model and “outlier” data points which are not representative of the model. Multiple subsets of the data points are defined, and each used to estimate the parameters of the model. The various estimates of the parameters are plotted in the parameter space to identify the peak parameters in the parameter space. Data points which are not described by the model using the said peak parameters are judged to be outliers. The method makes it possible to identify up to N−K′−3 outliers (K′ is the minimum number of data points through any subset of the input data set the K parameters of the model can be uniquely calculated).

Description

FIELD OF THE INVENTION [0001] The present invention relates to methods and apparatus for analysing an experimental data-set to estimate properties of the distribution (“model”). In particular, it relates to methods and apparatus in which a model of known functional form is estimated from the experimental data-set. BACKGROUND OF INVENTION [0002] Many data-sets can be regarded as made up of (i) data points obtained from and representative of a model (“inliers”) and (ii) data points which contain no information about the model and which therefore should be neglected when parameter(s) of the model are to be estimated (“outliers”). [0003] Existing outlier removal methods operate by using all the data points to generate one or more statistical measures of the entire data-set (e.g. its mean, median or standard deviation), and then using these measures to identify outliers. For example, the “robust standard deviation algorithm” (employed in [1]) computes a median and a statistical deviation...

Claims


Application Information

Patent Timeline
IPC IPC(8): G06F19/00G06FG06F1/00G06F17/18G06K9/62
CPCG06K9/6284G06F17/18G06F18/2433
Inventor HU, QINGMAONOWINSKI, WIESLAW L.
Owner AGENCY FOR SCI TECH & RES
Why Eureka
Try Eureka