Method of visualizing power system quantities using a configurable software visualization tool

a software visualization and power system technology, applied in the field of monitoring and protecting electrical power systems, can solve the problems of multiple high-cost lines, severe damage or complete destruction of switchgears and generators, and high cost of interconnection, so as to achieve effective and efficient communication

Inactive Publication Date: 2006-11-16
ANDERSON JAMES CHRISTOPHER +1
View PDF48 Cites 79 Cited by
  • Summary
  • Abstract
  • Description
  • Claims
  • Application Information

AI Technical Summary

Problems solved by technology

When the islanded system is later reconnected without being synchronous to the phase and frequency of the grid, severe damage or complete destruction can occur to the switchgears and generators.
These interconnections often prove to be very costly and involve multiple high cost lines.

Method used


Image

  • Method of visualizing power system quantities using a configurable software visualization tool
  • Method of visualizing power system quantities using a configurable software visualization tool
  • Method of visualizing power system quantities using a configurable software visualization tool

Examples


Embodiment Construction

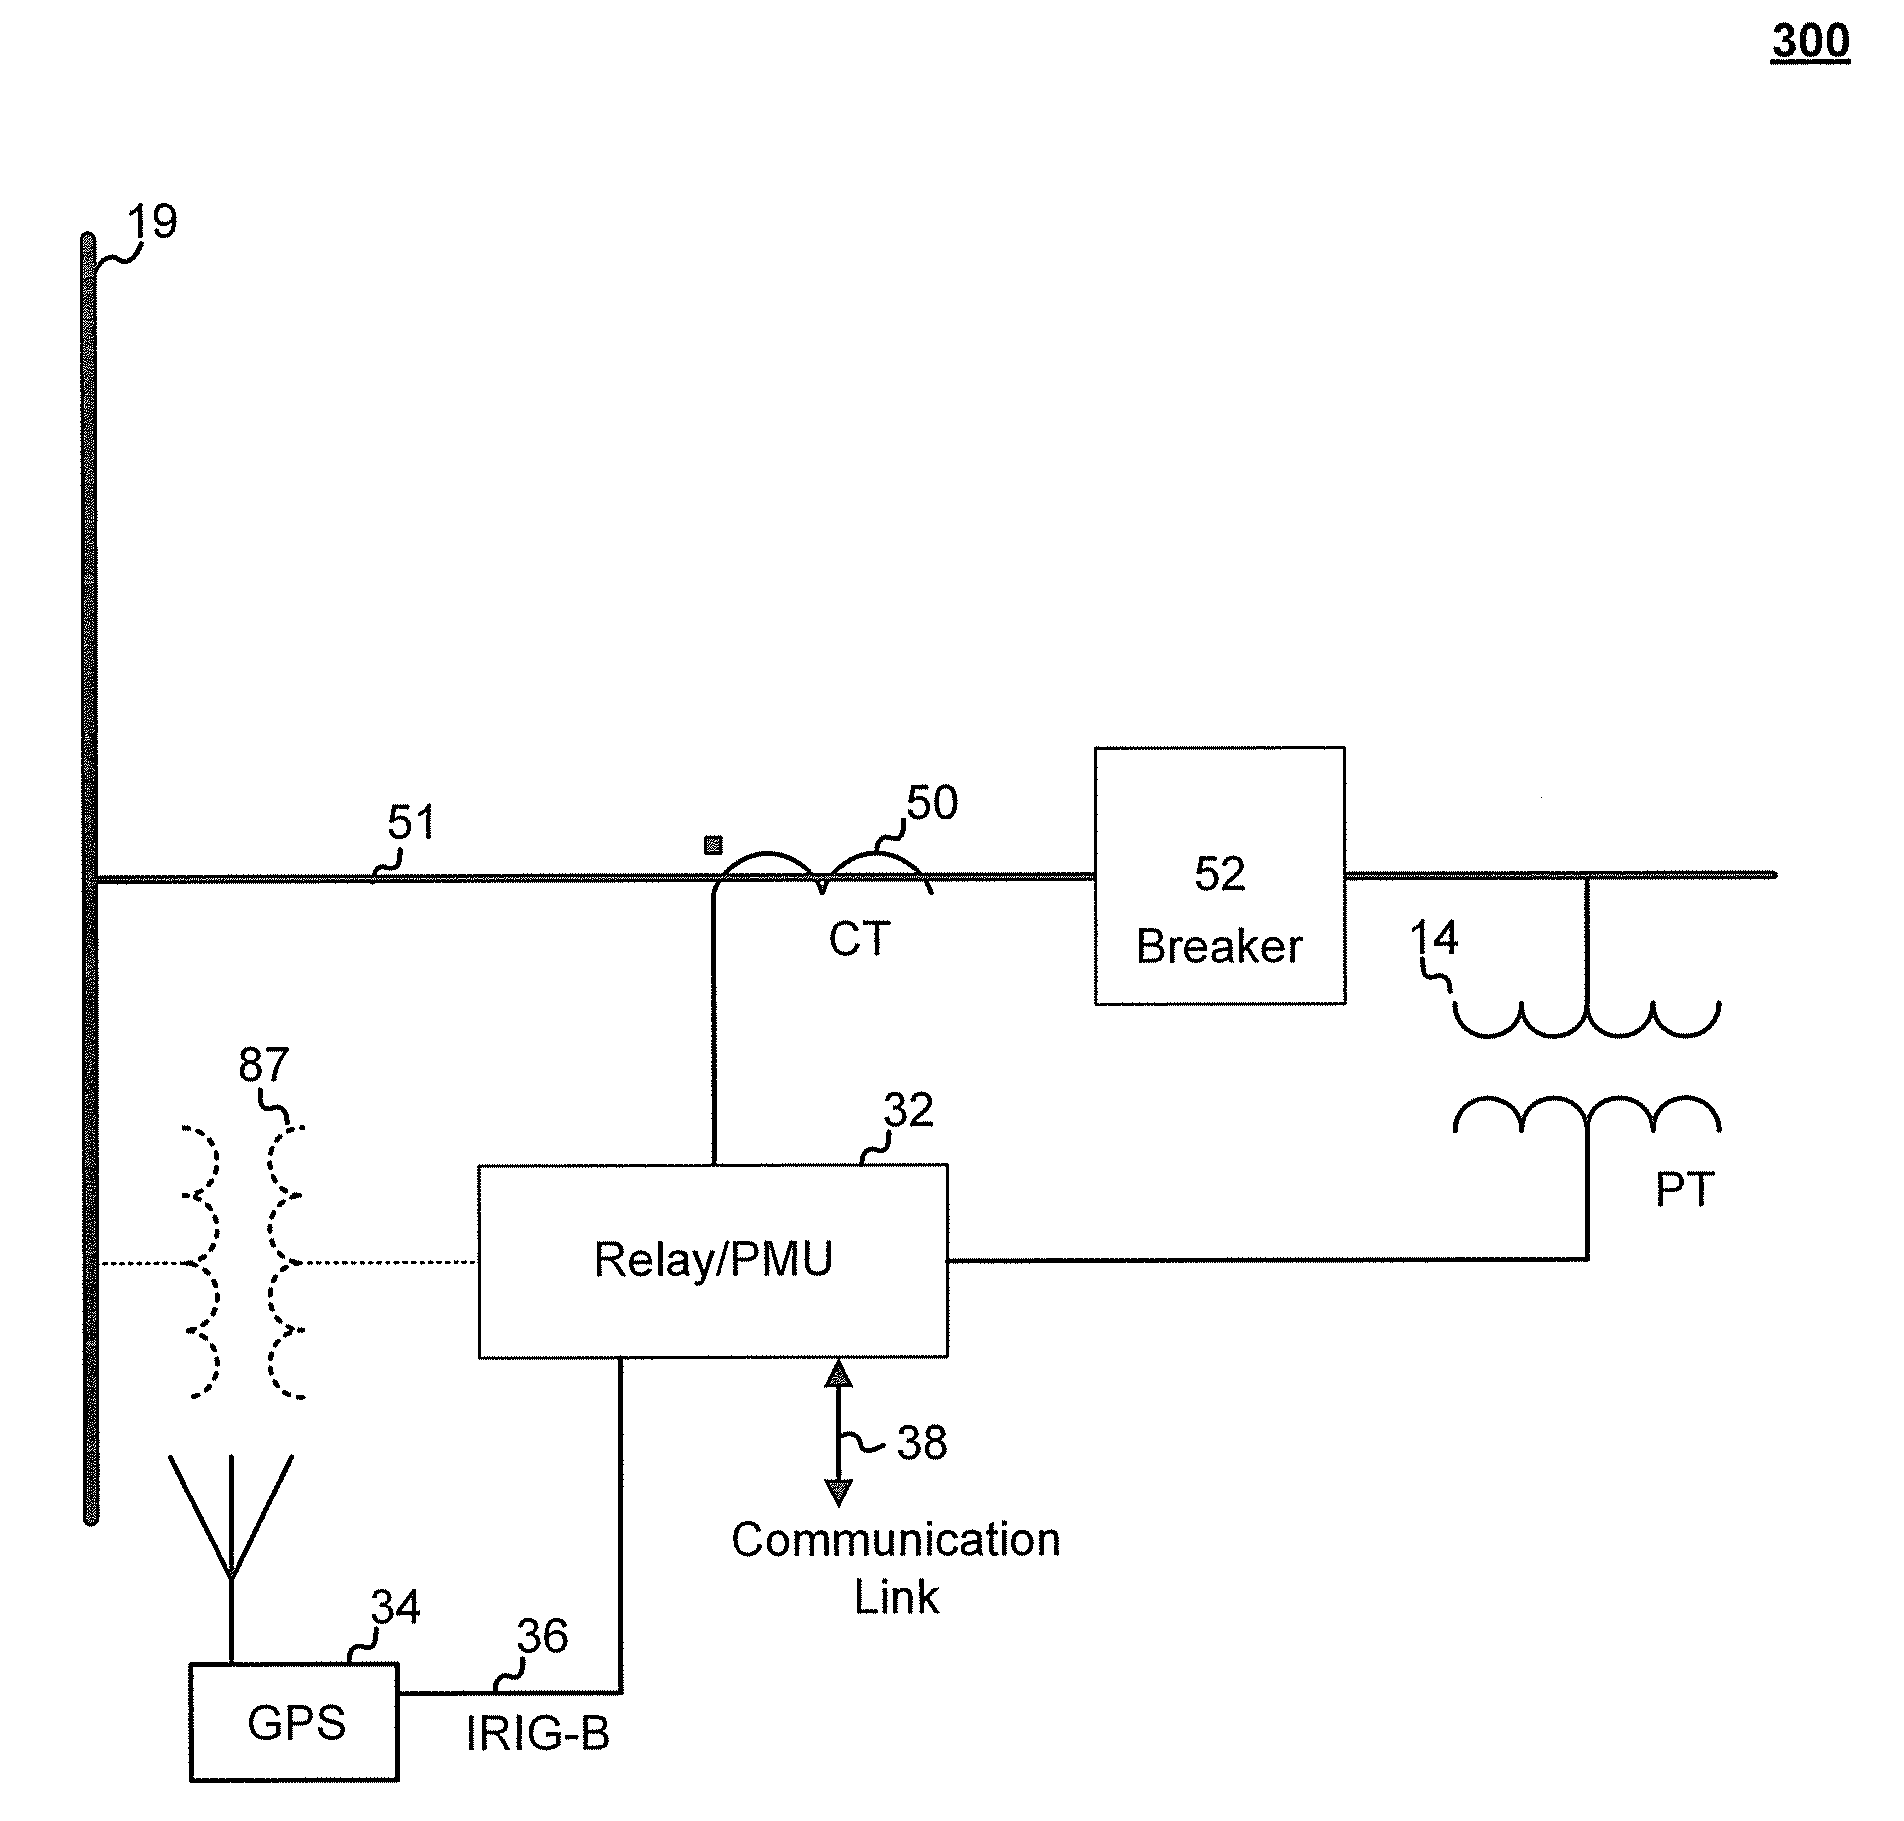
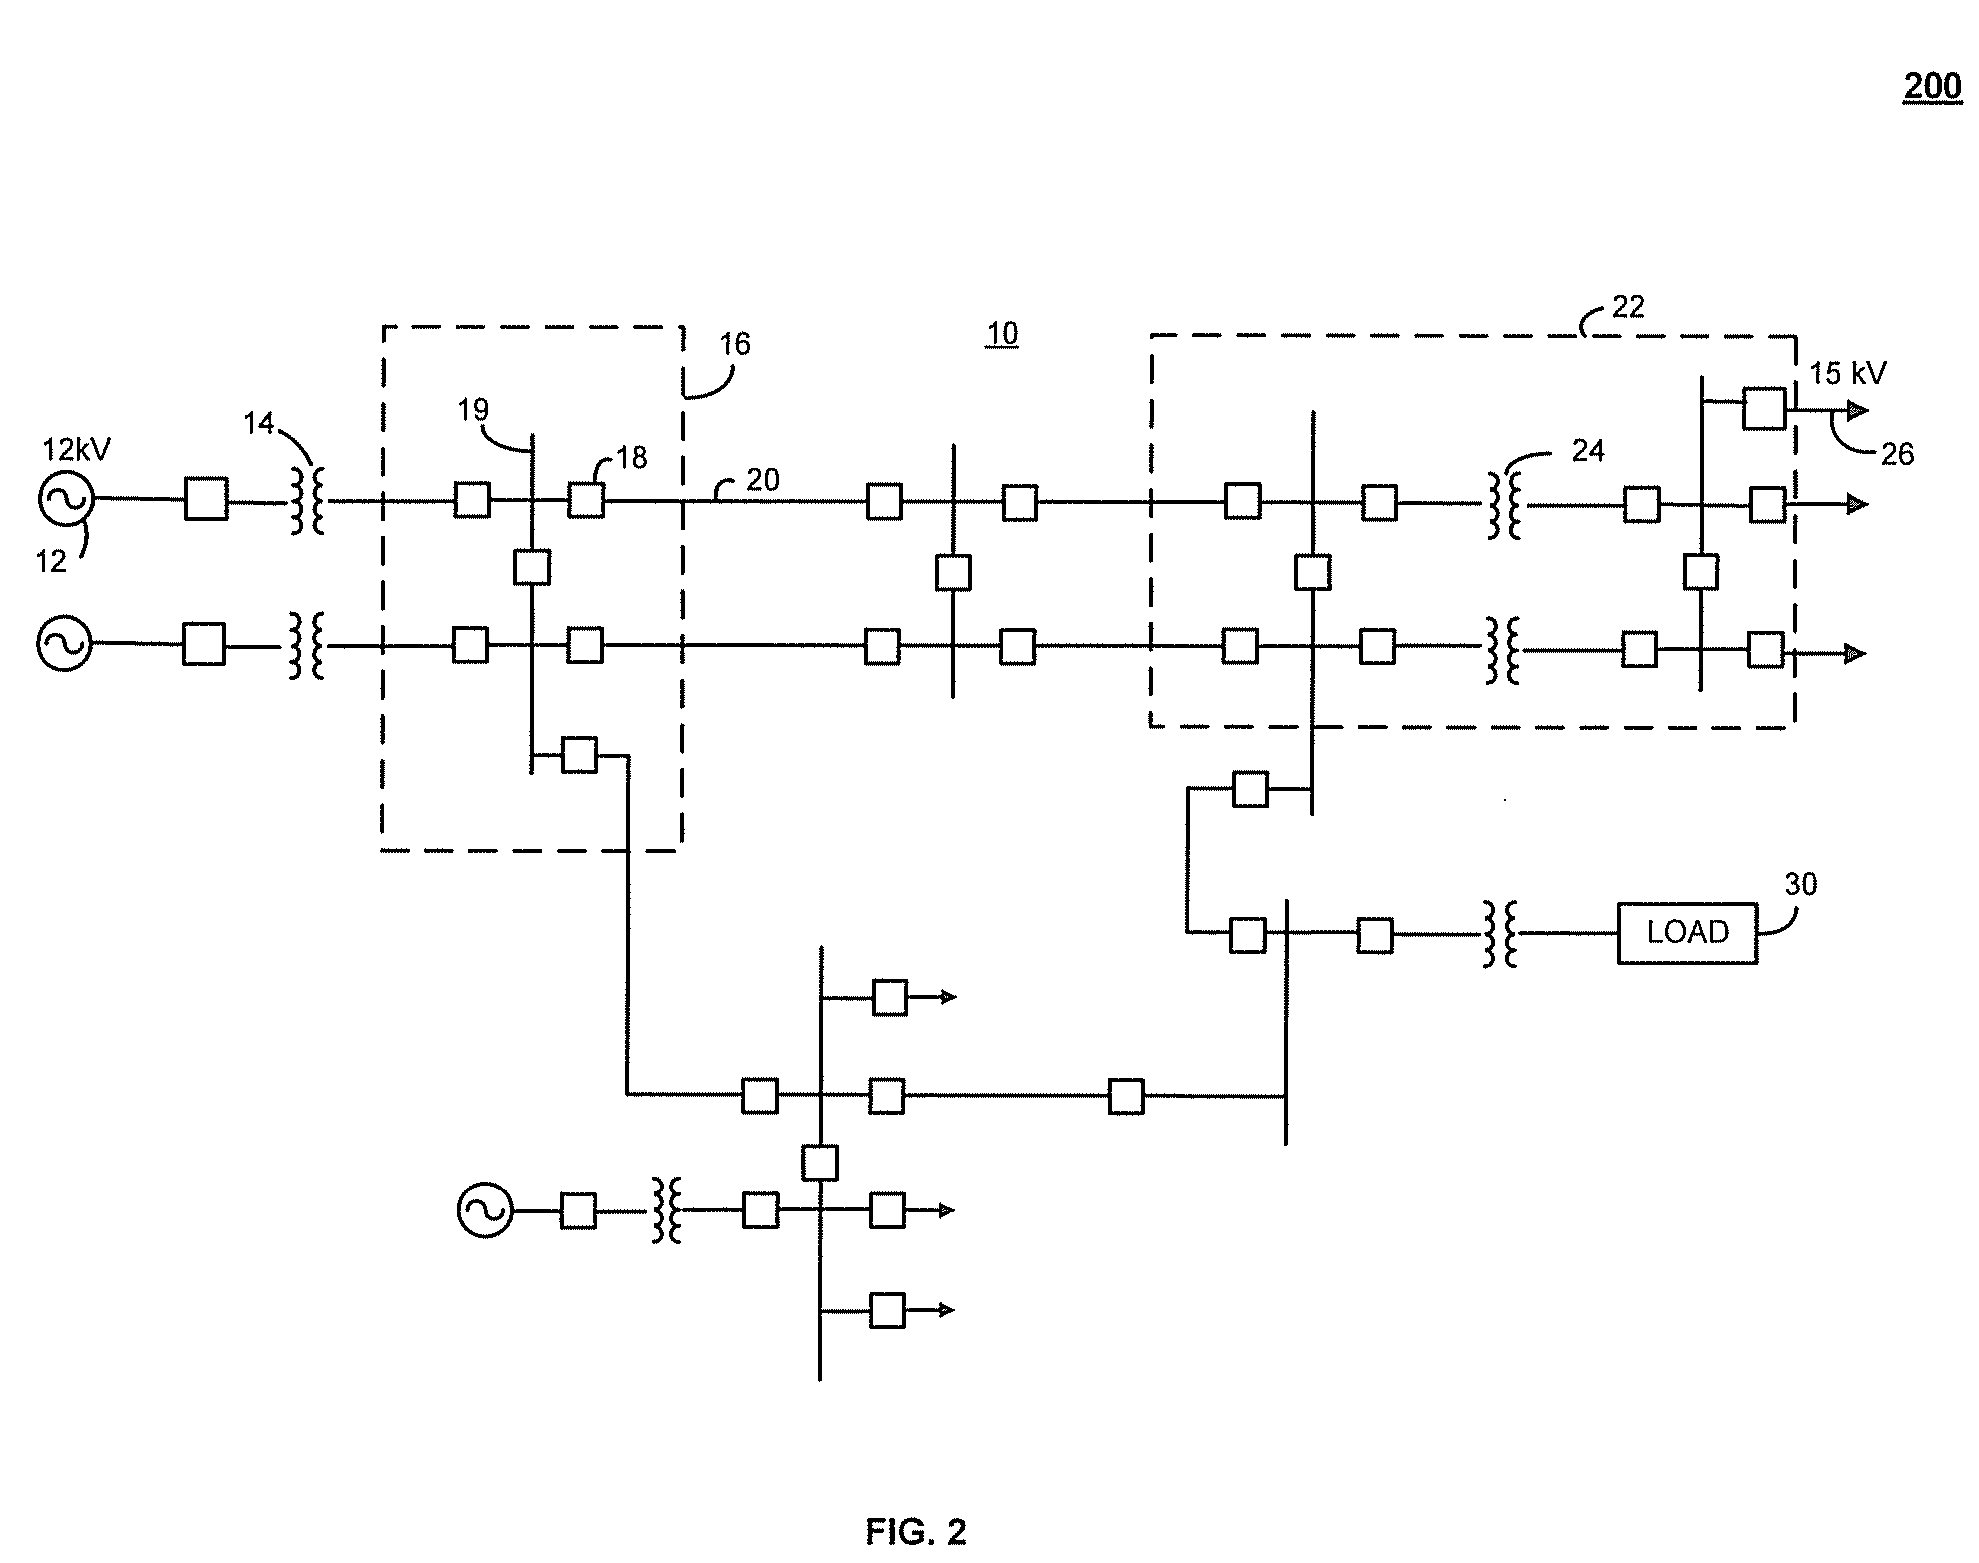
[0060] According to an aspect of the invention, FIG. 2 is a one-line schematic diagram of a power system 10 that may be utilized in a typical metropolitan area. As illustrated in FIG. 2, the power system 10 includes, among other things, a generator 12 configured to generate three-phase sinusoidal waveforms at, for example, 12 kV, a step-up transformer 14 configured to increase the 12 kV sinusoidal waveforms to a higher voltage such as 345 kV, and a first substation 16 including a number of circuit breakers 18 and transmission lines 20 interconnected via a first substation bus 19. The first substation 16 provides the higher voltage sinusoidal waveforms to a number of long distance transmission lines such as a transmission line 20. At the end of the long distance transmission line 20, a second substation 22 includes a step-down transformer 24 to transform the higher voltage sinusoidal waveforms to a lower voltage (e.g., 15 kV) suitable for distribution via a distribution line 26 to va...


PUM


Abstract

A system for transmitting synchronized phasors over a wide area network. The system generally includes a plurality of phasor measurement units (PMUs). Each of the PMUs are associated with a secured portion of a power system and measure power system data from the secured portion of the power system associated therewith. The power system data is associated with a time-element. A power system data concentrator is further provided in communication with the phasor measurement units such that it aggregates and time-correlates the power system data. A configurable docking visualization tool or software is provided which communicates with the PMUs and data aggregators. The configurable tool provides an end user with the ability to dock or nest pre-configured forms for optimal viewing of synchronized phasor data and different power system quantities.

Description

RELATED APPLICATION [0001] This application is a continuation-in-part and claims the benefit of U.S. Non-Provisional application Ser. No. 11 / 399,285 filed on Apr. 5, 2006, which claims the benefit of Provisional Application No. 60 / 668,252, filed Apr. 5, 2005.BACKGROUND OF THE INVENTION [0002] The present invention concerns the monitoring and protection of electrical power systems. More particularly, the present invention concerns a method for visualizing and monitoring power system quantities using a configurable software visualization tool. [0003] Generally, power system control or protective devices are used for protecting, monitoring, controlling, metering and / or automating electric power systems and associated transmission lines. These power system control or protective devices may include protective relays, remote terminal units (RTUs), programmable logic controllers (PLCs), bay controllers, supervisory controlled and data acquisition (SCADA) systems, general computer systems, ...

Claims


Application Information

Patent Timeline
Patent Type & Authority Applications(United States)
IPC IPC(8): G06F19/00
CPCH04L12/66G09B29/003
Inventor ANDERSON, JAMES CHRISTOPHERSCALLORN, WILLIAM BRUCE
Owner ANDERSON JAMES CHRISTOPHER
Why Eureka
Try Eureka