
System and method for visually organizing, prioritizing and updating information

Active Publication Date: 2008-02-07
SHUKOOR SHABINA
View PDF8 Cites 149 Cited by
  • Summary
  • Abstract
  • Description
  • Claims
  • Application Information

AI Technical Summary

Benefits of technology

[0031] It would be desirable to provide for the stacking of a plurality of data task cells in a single category so that the maximum available plotting area of most computer monitors would be not be exceeded.
[0032] It would also be desirable to provide for the stacking of a large plurality of data task cells in a single category where the user would not have to scroll vertically and / or horizontally to visualize the data task cells that would normally run off the page.
[0034] It would also be desirable to provide a more compact, convenient method for grouping a larger number of data cell elements for more convenient drag / drop updating and re-categorizing of data.
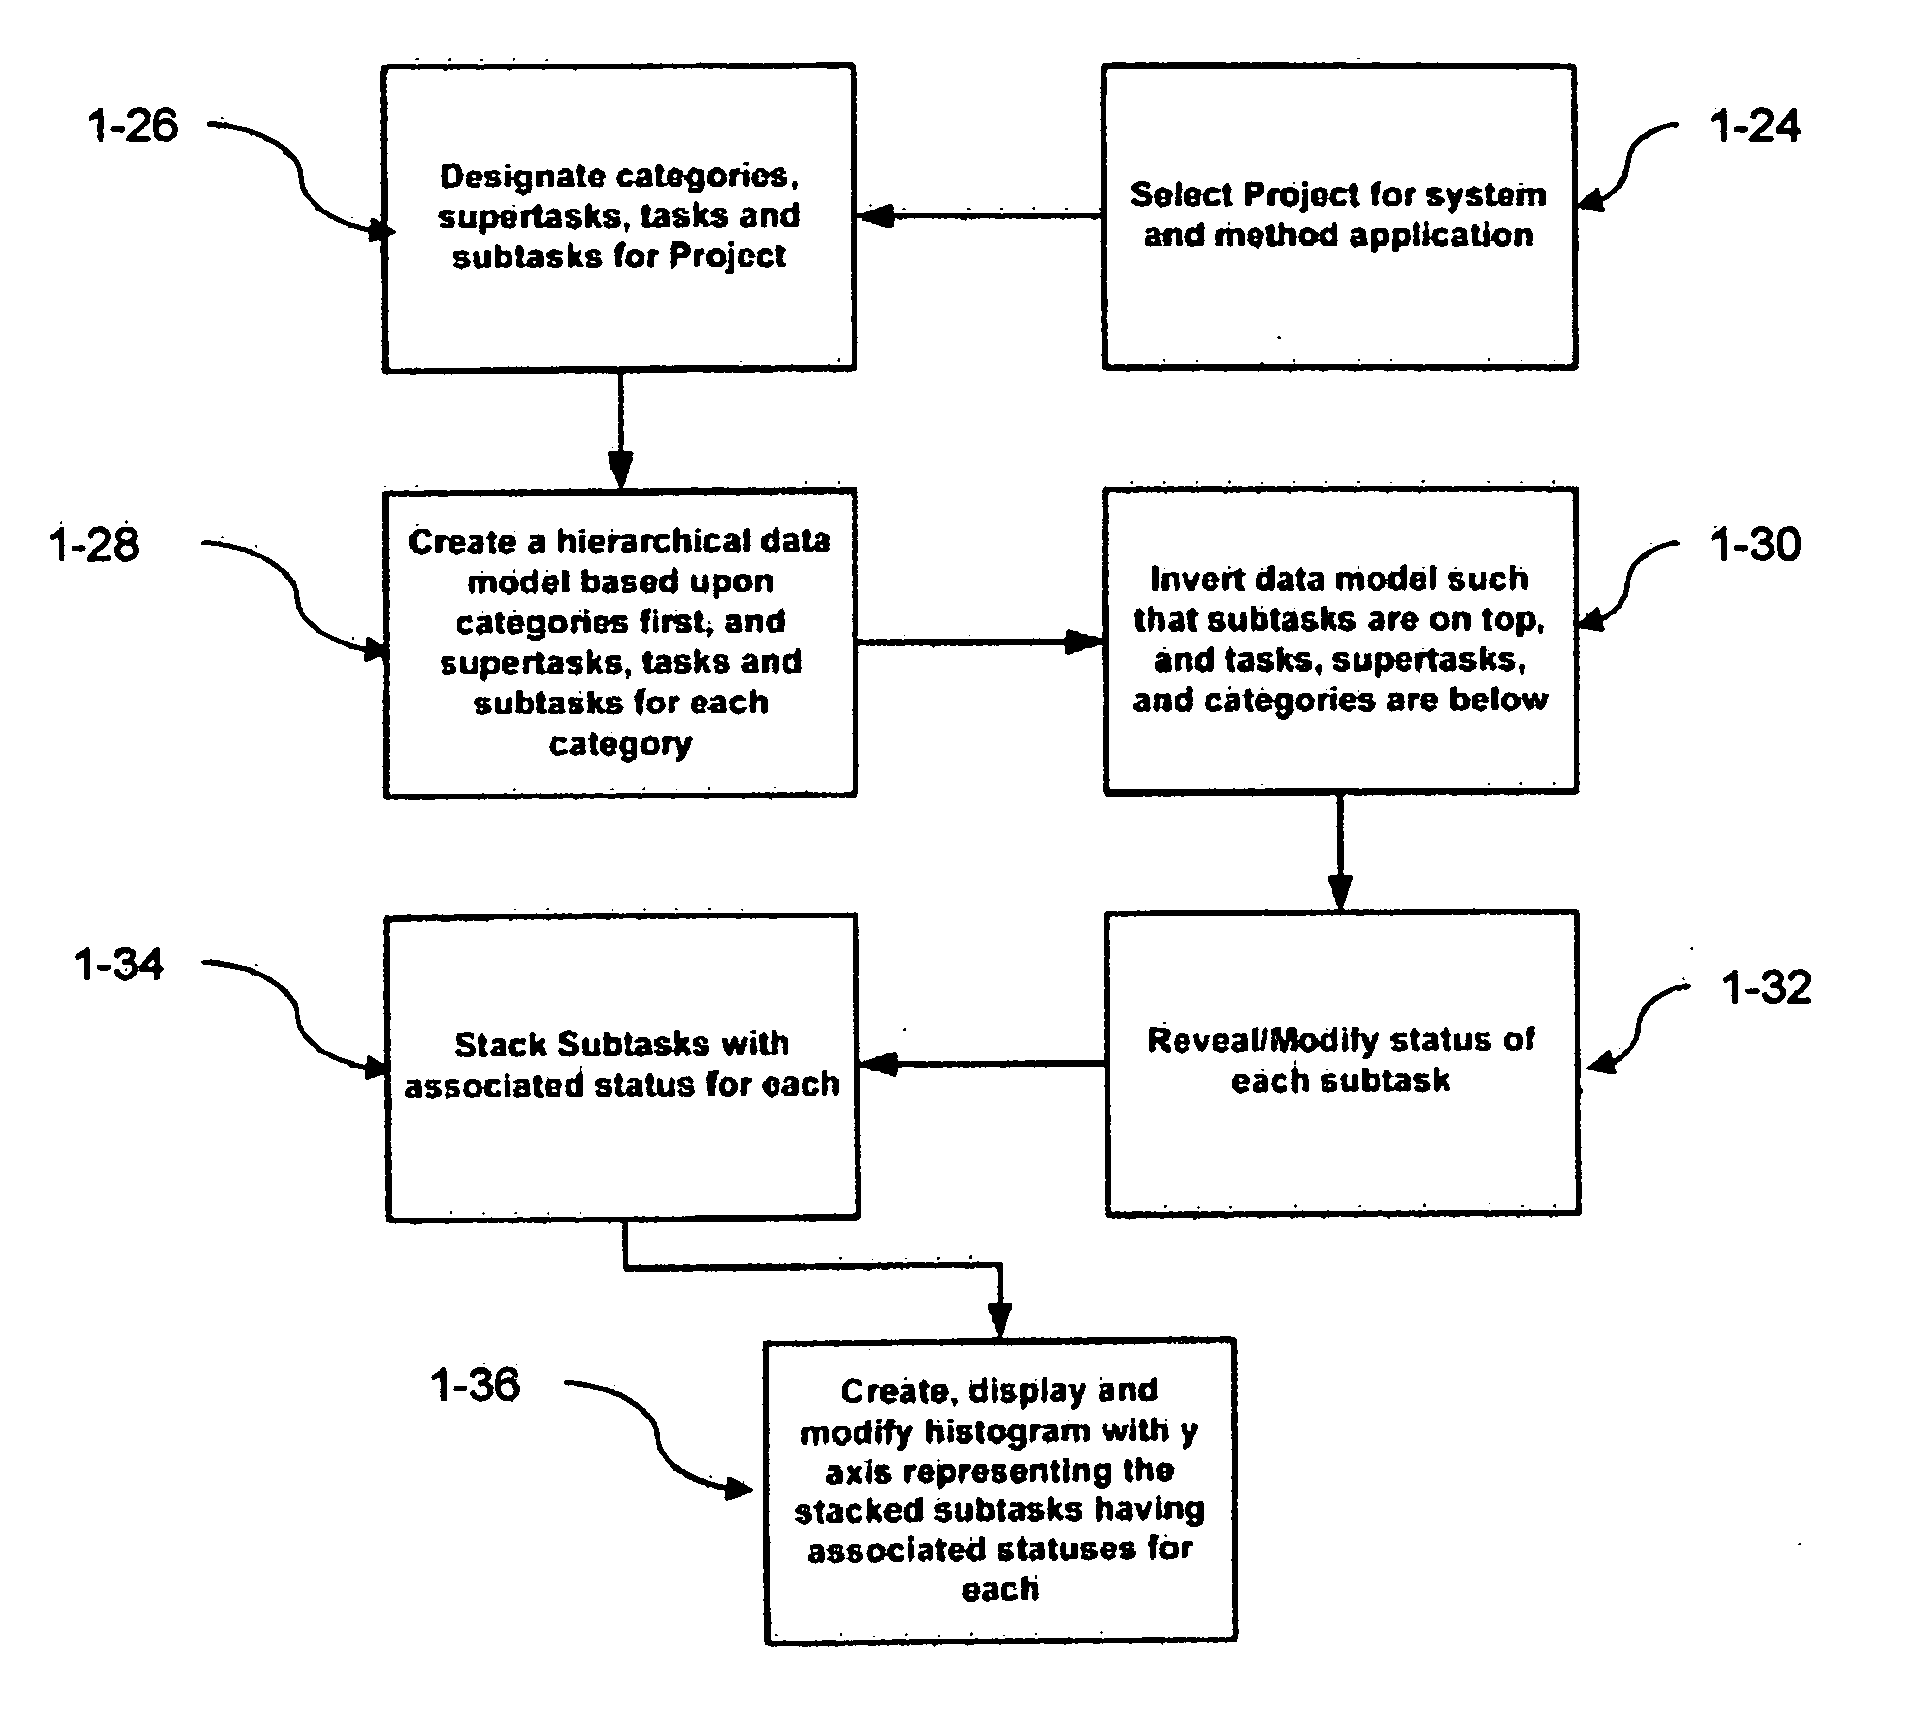
[0036] Thus the present invention aims to provide a system and method for visually presenting an organization by way of categories, super-tasks, tasks and subtasks (defined to include all relevant organizational structural elements) without wasted space on the page, and with status information indicated for the subtasks in a simple, easily navigable, and reverse hierarchical manner.
[0039] The present invention also aims to provide an easy-to-learn visual language which is intuitive and can be personalized and that allows a user to perform the following: tasks, namely: quickly grasp hundreds of “to-do's” ad-hoc tasks and e-mail follow-ups without missing anything; communicate and real-time up-date of a plurality of project risks, tasks and issues in one view, at a single glance; eliminate many of the repeat text documentation, clicking, searching, sorting and reporting which is normally required to answer the most frequently asked questions about day-to-day project work; and make meetings and teamwork significantly more efficient by communicating key information with visuals instead of words, up-dating data on-the-fly and keeping all team members on the same page.

Problems solved by technology

As business processes increase in complexity, it becomes necessary to determine systems and methods for managing the associated information.
The complex data management challenge is the organizing, prioritizing and real-time communicating of information which is now becoming a growing burden.
The complexity of data organization is further complicated when process tasks are fluid, unstructured, collaborative, interdependent and frequently changing.
In the first place, there is a large amount of wasted space on the page.
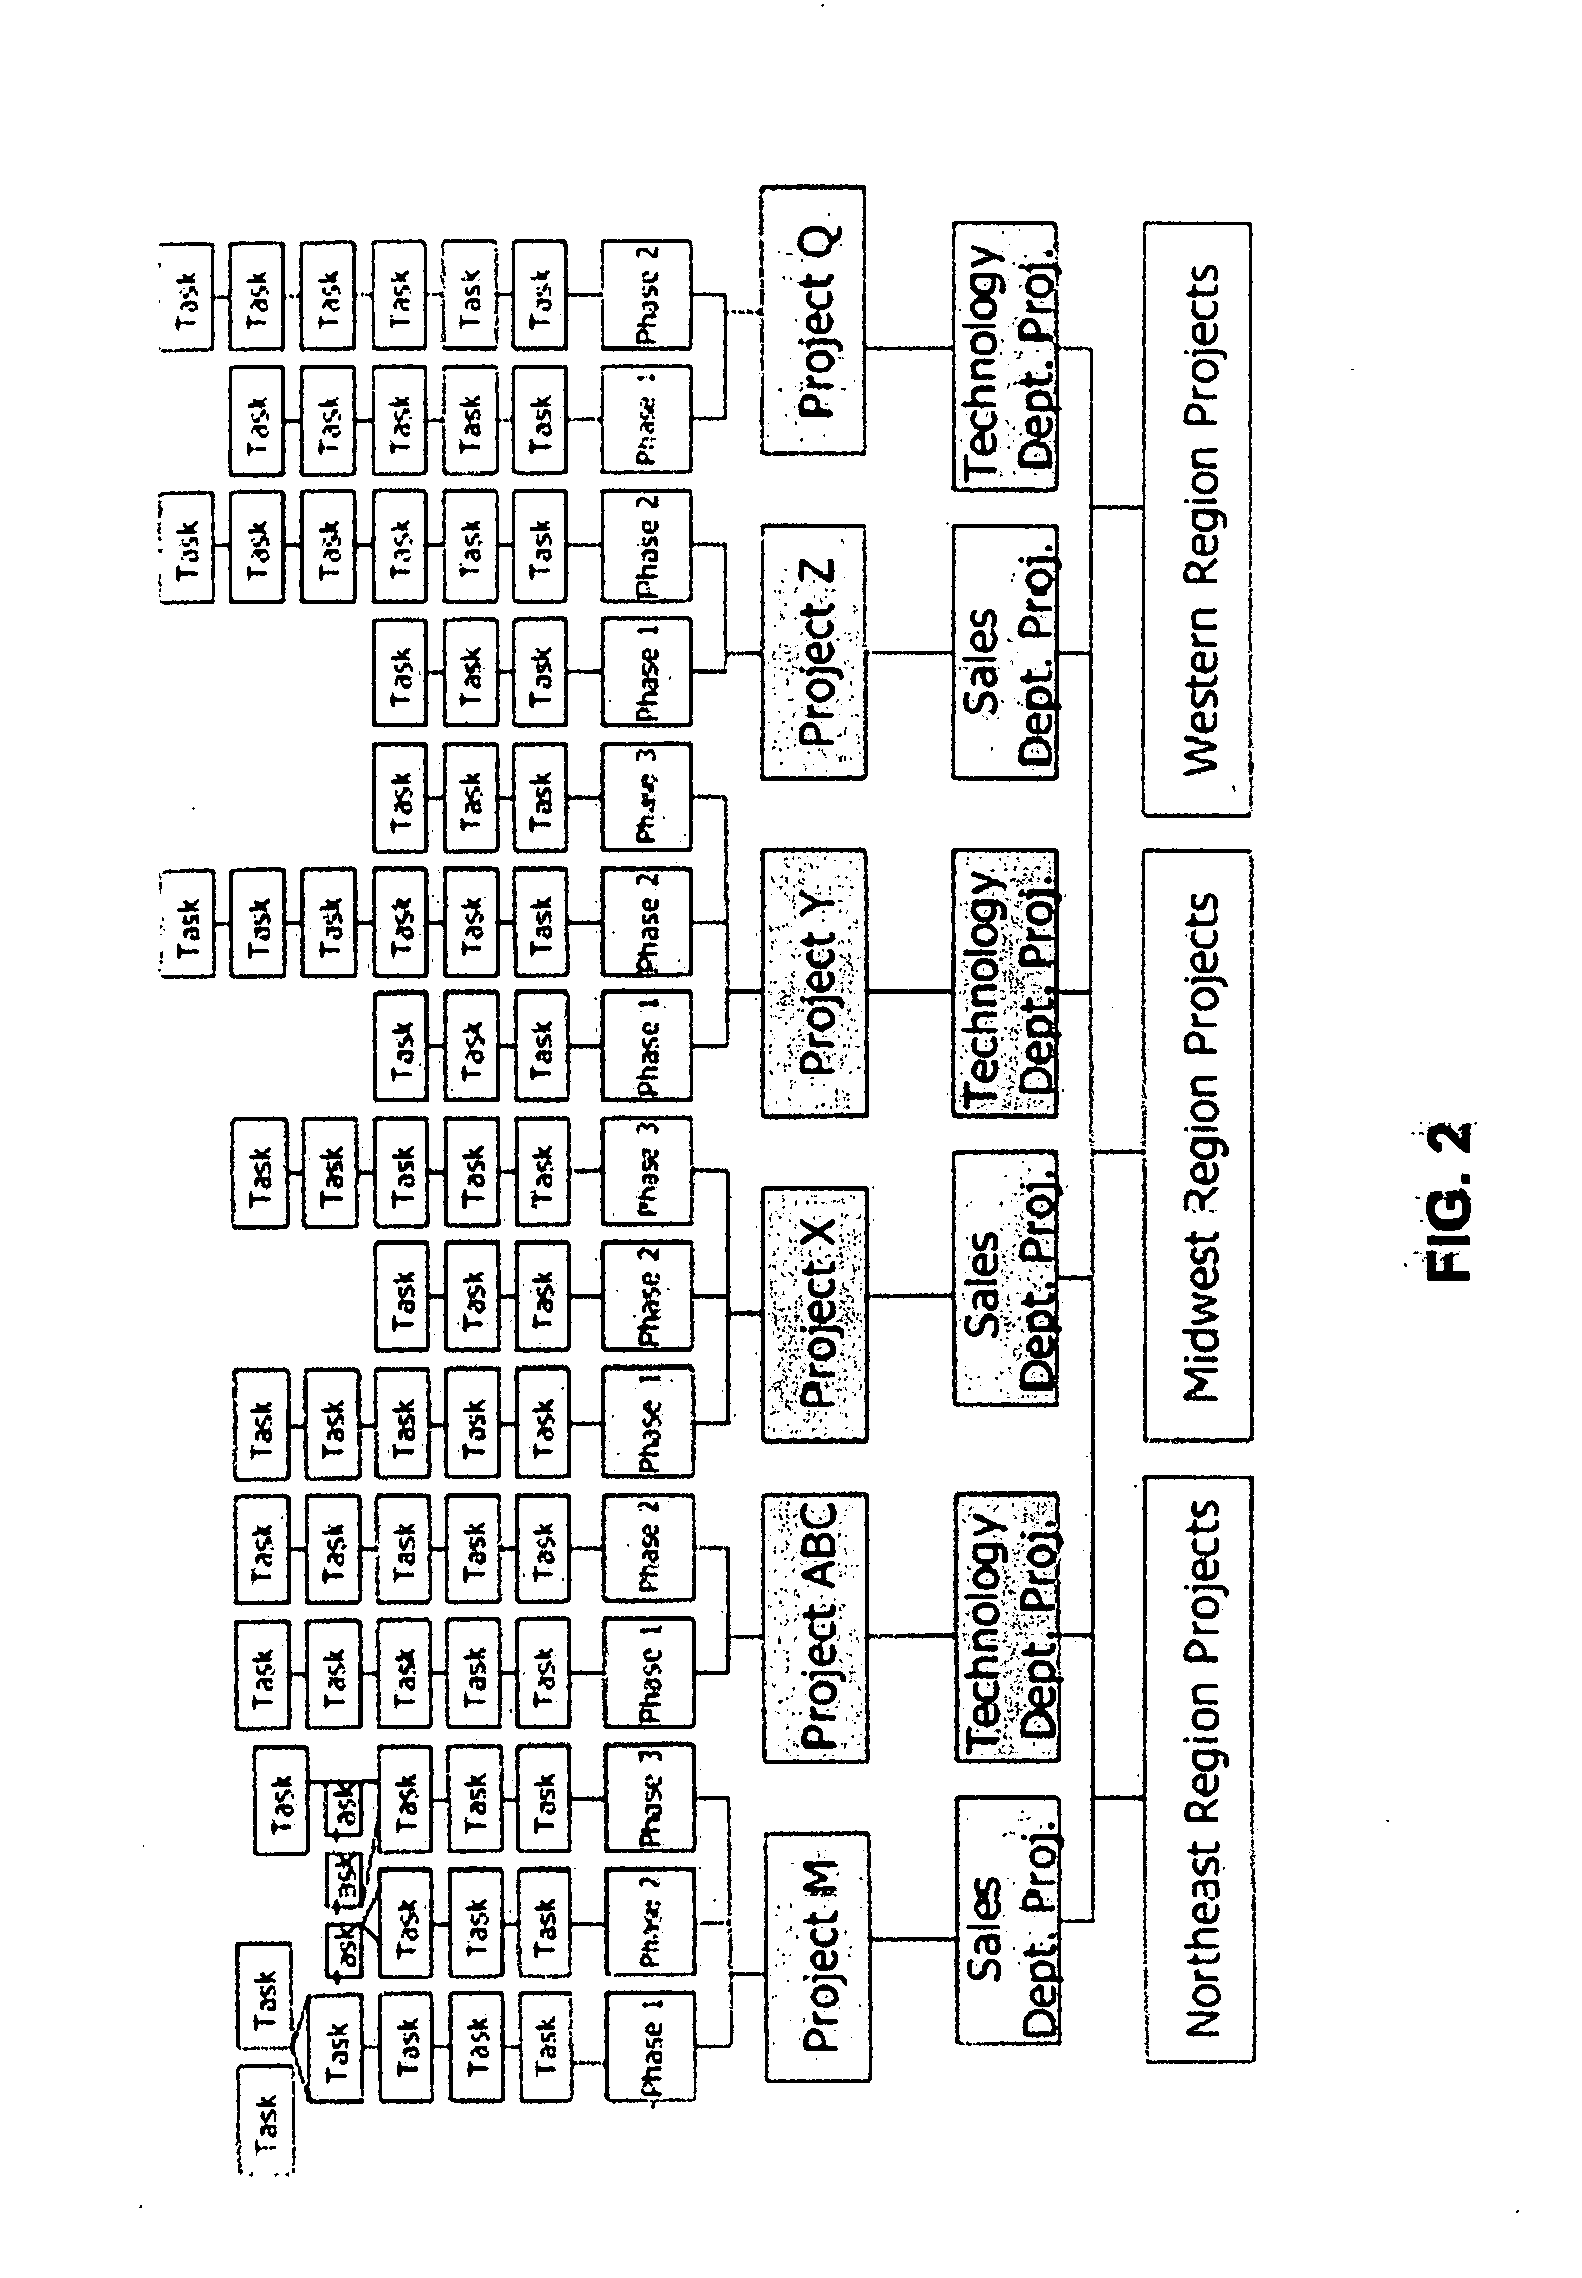
Additionally, while connectivity may be provided, the status of the projects is not available, Perhaps the most important aspect of management, would require a hyperlink of some kind in order to be rendered visible, thereby taking the task to another page, and, at that point, failing to maintain a consistent visual representation of connectivity to the remainder of the tasks, phases, projects, departments and regions.
Indeed, one could well imagine a large organization being unable to even represent the entirety of the organization on one page if the traditional organizational chart of the prior art is used, since the wasted space is unavailable.
However, the “Gantt Chart” is not practical for the targeted “at-glance” lookup of specific information for a given task, because the graphics are inconveniently spread out.
Clearly, a visualization mode that is mostly “blank space” and requires the user to scroll across three or more pages, just to look up one piece of information, is highly inefficient and impractical.
Another defect of the “Gantt Chart” is that, while a “Gantt Chart” may be initially setup and visually inspected at the start of a project, once the project is underway, sorting and searching is through associated task tables, and not through “Gantt Charts”, for the quick, day-to-day lookup and updating of task information.
Moreover, as a graphical user interface for drag / drop data updates, the “Gantt Chart” is very limited.
As a task visualization tool, the graphical calendar is impractical, because it would require searching through several pages to visualize tasks across three or four time periods.
Scrolling across several pages to locate a few tasks spread across a few months is not an efficient or practical visualization method.
Another inconvenience of the graphical calendar as a task visualization tool is that it is impractical to squeeze in one hundred to two hundred or more task objects with a single timeslot on the same day, or even within the same day.
As a drag / drop data update tool, the graphical calendar has very limited functionality.
There have been no known attempts to popularize a systematic “TreeMap” design methodology that is specifically set up for the purpose of “drag / dropping” or “auto-migration” of tree leaf boxes from one category to another.
The prior art “TreeMap” data visualizations do not provide any systematic method of structuring data to enable drag / drop or migration of data from one tree leaf category to another.
The very configuration of most “TreeMap” preferred embodiments currently in use are also not physically arranged easily to enable the drag / dropping activity of data between areas.
It is believed that the most advanced human computer interface research and designs in the use of “TreeMaps” for data visualization did not provide “drag and drop for data migration across a “TreeMap” as a systematic, known methodology and use of “TreeMaps”.
The weakness in this prior art method of drag / dropping within a “Tree-Map” is that once again, the visual structure is inconvenient for a large number of tasks that exceed the allotted number of available rows on a normal computer screen and thus would require excessive vertical scrolling or dragging across large areas to move an element from its source folder to the newly assigned destination folder or group.
Human perceptual skills are quite remarkable and largely underutilized in current information and computing systems.

Method used


Image

  • System and method for visually organizing, prioritizing and updating information
  • System and method for visually organizing, prioritizing and updating information
  • System and method for visually organizing, prioritizing and updating information

Examples


second embodiment

[0141]FIG. 11 is a display on a computer monitor in graph configuration form of a second embodiment provided when carrying out the method of the present invention by a computer program which executes a method of the present invention.

[0142] In this graph configuration, the program expresses two categories, namely category 1 and category 2 which are aligned in a horizontal row.

[0143] Stacked below category 1 is subcategory 1 whose width is identical to the width of category 1.

[0144] Stacked below subcategory 1 of category 1 is a plurality of data cells namely a, b, c and d, which are aligned and stacked below subcategory 1 of category 1 and whose width is identical to the width of category 1.

[0145] Stacked below the plurality of data cells in subcategory 1 of category 1 namely a, b, c and d, is another subcategory, namely subcategory 2 of category 1 which also has stacked below it data cells namely e and f, which are aligned and stacked below subcategory 2 of category 1 and whose ...

third embodiment

[0152]FIG. 12 is a display on a computer monitor in graph configuration form of a third embodiment provided when carrying out the method of the present invention by a computer program which executes a method of the present invention.

[0153] In this graph configuration, the program expresses two categories, namely category 1 and category 2 which are aligned in a horizontal row.

[0154] Stacked below category 1 is subcategory 1 whose width one half of the width of category 1.

[0155] Stacked below subcategory 1 of category 1 is a plurality of data cells namely “a”, “b”, and “c”, which are aligned and stacked below subcategory 1 of category 1 and whose width is identical to the width of category 1. However the program specifies a maximum stacking height. Consequently data cell “d” has been automatically snaked over to a position on the same horizontal level as subcategory 1 of category 1 whose width is identical to the width of subcategory 1 of category 1.

[0156] Stacked below data cell “...

fourth embodiment

[0161]FIG. 13 is a display on a computer monitor in graph configuration form of a fourth embodiment provided when carrying out the method of the present invention by a computer program which executes a method of the present invention.

[0162] In this graph configuration, the program expresses two categories, namely category 1 and category 2 which are aligned in a horizontal row.

[0163] Stacked below category 1 is subcategory 1 whose width the same width as category 1.

[0164] Stacked below subcategory 1 of category 1 is a plurality of data cells namely a and b which are aligned and stacked below subcategory 1 of category 1 and whose width is one half of the width of subcategory 1. However the program specifies a maximum stacking height. Consequently data cells c and d have been automatically snaked over to a position on the same horizontal level as data cells “a” and “b”, respectively.

[0165] Stacked below data cells “b” and “d” is a new subcategory, namely subcategory 2 of category 1 ...


PUM


Abstract

An improved method is provided herein of managing information that typically relates to a project, process, or workflow. The information is classified within various hierarchical levels of categories, subcategories and their lowest level data elements and is organized within an electronic graph in a corresponding hierarchical sequence. The graph comprises what is termed as “cell bodies” in the form of graphical objects. These graphical objects represent each of the categories, subcategories and data elements and are aligned against each other in various orthogonally stacked configurations where the cell bodies consist of one or more geometric shapes, symbols, characters and their respective features such as color, in a tight grouping, which together, represent several variables of a single data set record. Each cell body may be a cluster of one or more such graphical components.

Description

CONTINUING DATA [0001] This invention is a continuation-in-part of pending U.S. patent application Ser. No. 10 / 194,031, filed Jul. 11, 2002, published Jan. 16, 2003 as Publication No. US 2003 / 0014409 A1, that application claiming priority from provisional application No. 60 / 304,679, filed Jul. 11, 2001.BACKGROUND OF THE INVENTION [0002] 1. Field of the Invention [0003] The present invention relates to the fields of data visualization for business intelligence and decision support as it applies preferably (but not solely) to workflow and project management. The invention also relates to the field of graphical user interface design with associated methods for the interactive manipulation and updating of information stored in computer file storage and database systems. The present further invention relates to the field of information management, typically to the management of projects, workflows or processes that can be divided into a plurality of tasks or any informational items havin...

Claims


Application Information

Patent Timeline
IPC IPC(8): G06F9/46
CPCG06Q10/06G06Q10/0639G06Q10/0633G06Q10/063
Inventor SHUKOOR, SHABINA
Owner SHUKOOR SHABINA
Learn More