Prediction method and system

Inactive Publication Date: 2008-06-19
LEHIGH UNIVERSITY
View PDF7 Cites 85 Cited by
  • Summary
  • Abstract
  • Description
  • Claims
  • Application Information

AI Technical Summary

Benefits of technology

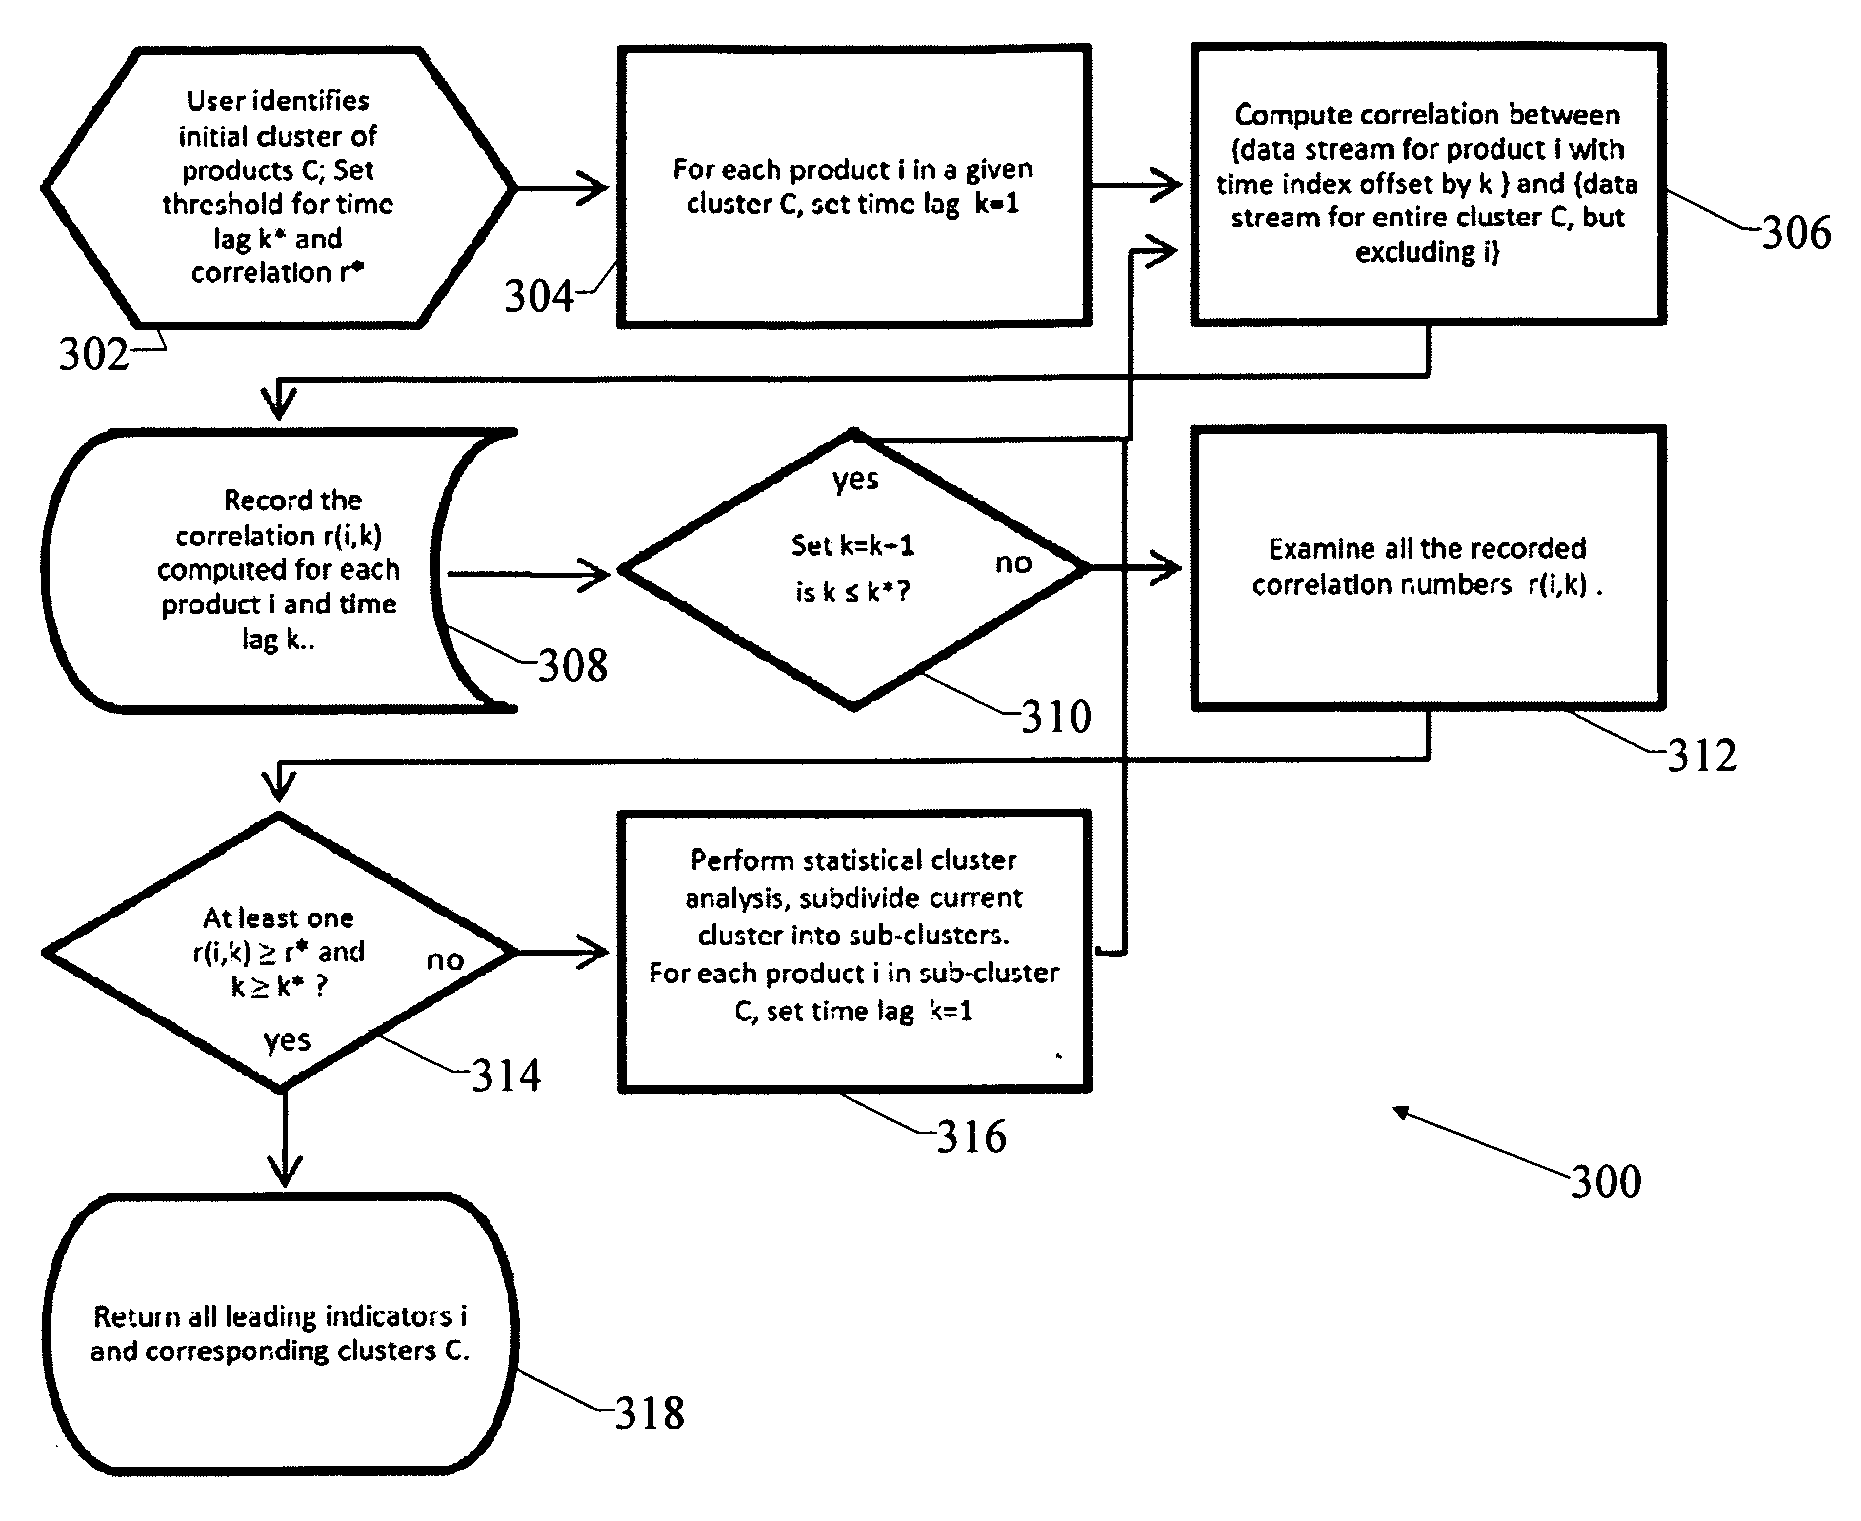
[0007]A method of identifying leading indicators based on a received plurality of data streams. A cluster of the plurality of the received data streams is selected. The strength of a plurality of data streams of the cluster relative to at least a portion of the plurality of received data streams is determined. At least one of the data streams having a strength exceeding a threshold value as a leading indicator is selected.
[0008]A method of generating a prediction based on a received plurality of data streams. The strength of one or more of the plurality of data streams is determined. The one or more data streams having a strength greater than a threshold value are identified as a leading indicator. Predicted values for the plurality of data streams are generated based on the at least one of the one or more data streams identified as a leading indicator.
[0009]A method of generating a prediction based on a received plurality of data strea

Problems solved by technology

However, this approach to planning prohibited many companies from reacting more quickly to the industry decline when it began in 2001.
With the decline initially predicted to be short-lived, many customers were reluctant or slow to revise their forecasts.
Many suppliers were reluctant or unable to enforce penalties for order cancellations and were left in the difficult position of trying to reconcile optimistic forecasts with increasingly negative economic indicators.
By the time the industry acknowledged the depth and potential duration of the decline, many companies were left to assume financial responsibility for large buffers of

Method used


Image

  • Prediction method and system
  • Prediction method and system
  • Prediction method and system

Examples


examples

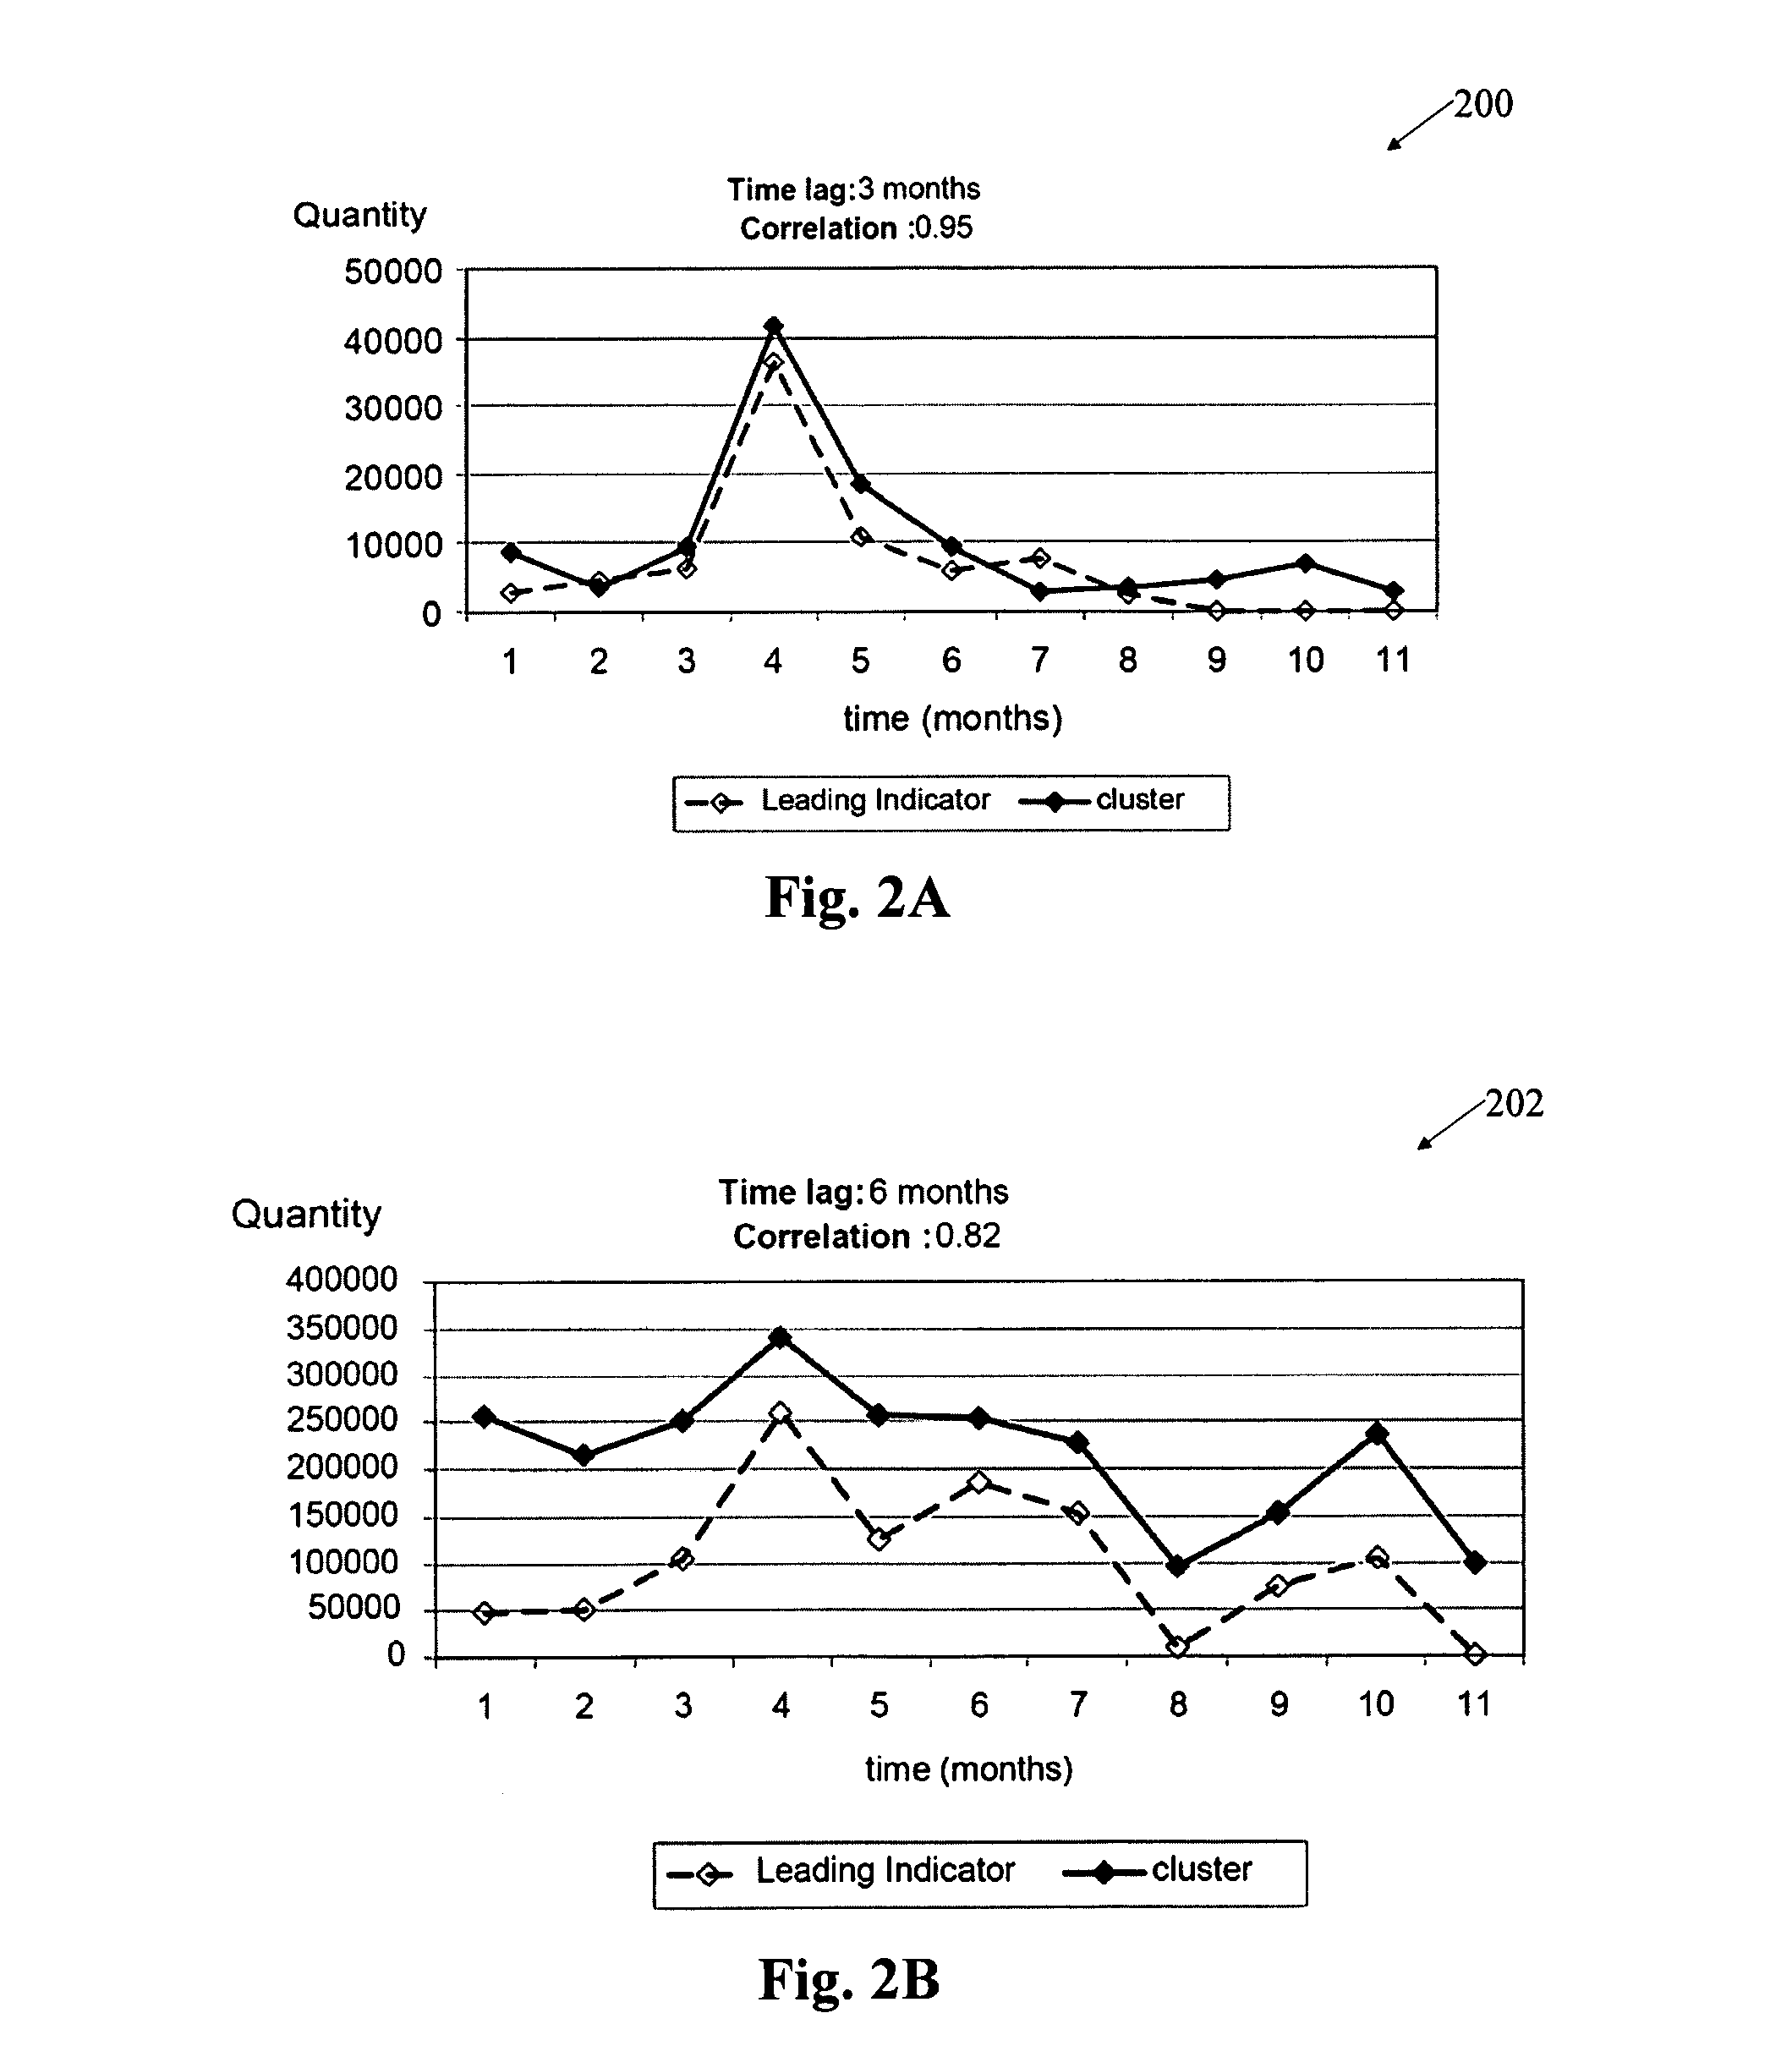
[0049]The leading indicator engine analyzes the data associated with a specified group of products, systematically searches for a set of leading indicator products for the group and generates demand forecasts based on the leading indicator identified. The tool also can be used in a scenario analysis mode to test whether a particular product is a strong leading indicator for some group of products, which is a question of great managerial interest. In this section, we provide several examples to illustrate different aspects of the leading indicator analysis. Our experiments were conducted using monthly demand data that covered the 26-month period from December 2001 to January 2004. The data set included 3,500 semiconductor (IC) products across eight business entities. For testing purposes, we used an estimation-validation procedure as follows. We designate, for example, the first 15 months in the data set as the estimation period (EP), which represents the historical demand data visib...


PUM


Abstract

A method and apparatus for predicting future data values based on past data values. Past data values such as past product demand values are received. Leading indicators are identified based on the past data values. The future data values are generated based on the leading indicators.

Description

FIELD[0001]This pertains to forecasting and, more particularly, to using leading indicators for forecasting.BACKGROUND OF THE INVENTION[0002]In the mid to late 1990's, high-tech industries such as consumer electronics, telecommunications equipment, and semiconductors were experiencing unprecedented growth and expansion. During that time, many firms developed and deployed supply chain management systems to integrate and optimize their operations. With goals of reducing costs and cycle times, companies focused on internal integration but continued to rely on a traditional model of demand planning in which marketing adjusts the projections of customers to produce a unit forecast against which operations executes.[0003]Against the backdrop of rapid demand growth fueled by the dot corn boom, planning to customer-driven marketing forecasts was adequate, because companies were more concerned with keeping pace with demand and ensuring availability of products than with the accuracy of the d...

Claims


Application Information

Patent Timeline
IPC IPC(8): G06Q10/00
CPCG06Q30/02G06Q30/0202G06Q30/0201
Inventor WU, S. DAVID
Owner LEHIGH UNIVERSITY
Why Eureka
Try Eureka